

Abstract
Hypoxia manifests in many forms including the short repetitive intermittent hypoxia (IH) of sleep apnoea and the continuous hypoxia (CH) of altitude, both of which may impact metabolic function. Based on our own previous studies and the available literature, we hypothesized that whereas acute exposure to IH and CH would lead to comparable metabolic dysfunction, with longer-term exposure, metabolism would normalize to a greater extent with CH than IH. Studies were conducted in lean C57BL/6J mice exposed to either IH or CH for 1 day or 4 weeks and compared to either intermittent air (IA) or unhandled (UN) controls, respectively. We utilized the frequently sampled intravenous glucose tolerance test and minimal model analyses to determine insulin-dependent (insulin sensitivity; SI) and insulin-independent (glucose effectiveness; Sg) glucose disposal, as well as the insulin response to glucose (acute insulin response to glucose; AIRg). Our data show that 1-day exposure impaired the glucose tolerance and caused reductions in Sg and AIRg in both the IH and CH groups, but only IH caused a significant decrease in SI (7.5 ± 2.7 vs. 17.0 ± 5.3 μU ml−1 min−1; p < 0.05). After 4-week exposure, there was evidence of metabolic adaptation in both hypoxic groups, however, in the CH group, there was a supranormal increase in SI relative to both UN and IH groups. We conclude that in lean mice, the marked metabolic dysfunction that occurs with acute exposure to hypoxia is reversed to a greater extent with chronic CH exposure than chronic IH exposure.
Keywords: Altitude, Hypoxia, Sleep apnoea, Glucose
Introduction
Hypoxia exists in many forms in daily life and stresses multiple physiologic systems as the body attempts to adapt to a reduced oxygen environment. Two common, although seemingly distinct, forms of hypoxia arise with the repetitive periods of intermittent hypoxia (IH) that occurs with airway obstruction in sleep apnoea and with the continuous hypoxia (CH) that occurs at altitude. Both IH and CH are reported to induce metabolic dysfunction (Ip et al. 2002; Larsen et al. 1997; Punjabi et al. 2004; Punjabi and Beamer 2009), but the chronicity of exposure and the presence of co-morbid factors makes it difficult to determine meaningful comparisons between these two forms of hypoxia.
The detrimental effect of IH in sleep apnoea on insulin sensitivity has received more attention in the clinical literature in the last decade, as highlighted by the data from the Sleep Heart Health Study (Punjabi et al. 2004). However, the inevitable presence of obesity as a major risk factor for sleep apnoea and insulin resistance has detracted from establishing a clear causal pathway between IH and impaired glucose and insulin regulation. Consequently, we have developed animal models to investigate the relationship between IH exposure and metabolic function. We have shown that there is reversal of the normal circadian rhythm of glucose (Yokoe et al. 2008) and development of insulin resistance with acute (hours) exposure to IH in lean mice (Iiyori et al. 2007), and that chronic (weeks) exposure to IH in genetically obese mice leads to elevated serum insulin levels and worsening the glucose tolerance (Polotsky et al. 2003), consistent with a sustained increase in insulin resistance. Thus, both experimental and clinical manifestations of IH suggest there may be impaired glucose and insulin regulation that is sustained over time.
In contrast to the IH stress of sleep apnoea, relatively little is known about the metabolic effects of CH or altitude. Studies of CH are usually associated with mountain ascent in healthy subjects or trained climbers. Ascent studies are invariably short in duration and demonstrate an initial acute impaired insulin sensitivity that begins to normalize within days (Larsen et al. 1997). Studies in high-altitude natives indicate the presence of a lower continuous blood-glucose profile compared to sea dwellers and evidence of protection from metabolic disorders (Castillo et al. 2007; Lhamo et al. 2008; Santos et al. 2001; Schobersberger et al. 2003). A recent study in mice exposed to 10 % oxygen for 4 weeks has demonstrated a reduction in basal glucose and insulin and increases in insulin-stimulated glucose uptake in soleus muscle (Gamboa et al. 2011). Taken together, these human and animal studies suggest that whereas acute exposure to CH can induce insulin resistance, chronic exposure to CH may be associated with normalization, or even an enhancement of metabolic function.
It is difficult to make comparisons among human metabolic studies of sleep apnoea and altitude because of the range and level of sophistication of experimental endpoints. The simplest endpoints involve assessment of basal glucose and insulin, and inferences about insulin sensitivity are based on the Homeostasis Model Assessment Index. The oral glucose-tolerance test perturbs glucose homeostasis and provides insight into glucose disposal; however, it does not provide any information regarding insulin sensitivity of the peripheral tissues or insulin secretion from the pancreas. The hyperinsulinemic euglycemic clamp represents the gold standard for assessing insulin sensitivity, but the clamp does not provide any information about non-insulin-mediated glucose uptake or insulin secretion. The more recently developed intravenous glucose-tolerance test (FSIVGTT) with application of minimal model analyses provides an assessment of glucose disposal by estimating insulin-dependent (insulin sensitivity; SI) and insulin-independent (glucose effectiveness; Sg) glucose disposal, as well as the insulin secretory response to glucose (acute insulin response to glucose; AIRg). To date, however, no clinical or pre-clinical study has used the FSIVGTT to provide an integrated metabolic comparison between the IH of sleep apnoea and the CH of altitude.
We have recently adapted the FSIVGTT and minimal model analyses for use in conscious unhandled mice (Alonso et al. 2012) and here apply this test to provide new insights into the disruption of glucose and insulin regulation that occurs with exposure to hypoxia. The goal of our study was to determine the acute (1 day) and chronic (4 weeks) effects of IH and CH exposure on glucose disposal in peripheral tissues and on insulin secretion from the pancreas. We hypothesized that in lean mice, acute exposure to IH and CH would lead to a similar degree of metabolic dysfunction, but that after chronic exposure, glucose and insulin regulation would be normalized to a greater extent with CH compared to IH.
Methods
Ethical approval and surgical procedures
Animal handling and experimentation was in accordance with approved Institutional Animal Care and Use Committee protocols at the University of Pittsburgh. Male C57BL/6J mice aged 10–12 weeks were kept on a 12-h light/dark cycle beginning at 8 a.m. with free access to food and water. Femoral arterial and venous catheters were chronically implanted as previously described (Alonso et al. 2007). For catheterization, mice were anesthetized with inhaled 2 % isoflurane. In brief, micro-renathane catheters (MRE-025; Braintree Scientific, Braintree, MA, USA) were prepared by heating, pulling, cutting to appropriate diameter, shaping into a J-form in hot oil, and sterilizing (ethylene oxide). Catheters were inserted in the left femoral artery and vein, sutured in place, stabilized with superglue (Henkel Corp, Rocky Hill, CT, USA), tunneled subcutaneously to the upper back by threading through a blunt needle, taped to a wire attached to posterior cervical muscles for stiffness (792500; A-M-Systems, Sequim, WA, USA), and connected to a 360° dual-channel swivel designed for mice (375/D/22QM; Instech, Plymouth Meeting, PA, USA). Prior to the initiation of the experimental protocols detailed below, patency of the catheters was maintained by continuously flushing 7 μl h−1 saline containing 20 U ml−1 heparin (Baxter, Deerfield, IL, USA) using a syringe pump with multi-syringe adaptor (R99-EM; Razel Scientific Instruments, St. Albans, VT, USA). Arterial catheters were monitored daily for patency and kept unclogged by manual flushes using a 1-cc syringe with 26G needle when necessary. Mice were given 3 days to recover from surgery before the FSIVGTT was performed. We have previously established that food intake, cardiovascular and metabolic status, and plasma corticosterone are all normalized 3 days after surgery (Alonso et al. 2007).
Intermittent hypoxia and continuous hypoxia
A gas control delivery system was designed to regulate the flow of nitrogen and room air into a customized cage housing individual mice during the experimental period, as previously described (Iiyori et al. 2007). A series of programmable solenoids and flow regulators altered the FiO2 level over a defined and repeatable profile. During each period of IH the FiO2 was reduced from 0.209 to 0.05–0.06 over a 30-s period and rapidly reoxygenated to room-air levels in the succeeding 30-s period (i.e., 60 cycles h−1). Control animals for IH were exposed to intermittent air (IA) using an identical protocol of gas flows as the IH protocol except room air was used rather than nitrogen.
CH was induced using the same gas control delivery system and customized cages as described above for IH, and unhandled controls were also maintained in equivalent customized cages. The FiO2 level was maintained at 0.10 throughout the protocol and unhandled control animals were maintained in regular open top cages (Instech Laboratories, Inc., Plymouth Meeting, PA, USA).
Protocol
A schematic timeline of the experimental protocol for the 1-day and 4-week exposures is shown in Fig. 1. For the 1-day experiment, four groups of animals were exposed to IH, intermittent air (IA; control for IH), CH, or unhandled (UN; control for CH) throughout an 8-h protocol beginning at 8 a.m. (lights on time). The FSIVGTT was conducted between 2 p.m. and 4 p.m. while maintaining the hypoxic exposures. For the 4-week exposure, beginning at 8 a.m. on day 0, animals were (1) exposed to either IH or IA for 12 h during the light period and maintained under stable room-air conditions during the dark period; (2) exposed to CH for 24 h per day or UN in room air for 24 h per day. After 25 days of exposure the mice were catheterized and maintained under constant room-air conditions to recover from surgery until the beginning of day 26 when the IA, IH, and CH exposures were reinitiated. Catheters were placed after 25 days, since it is not feasible to maintain patency of such a small diameter catheter over extended time periods, and we have previously reported that the animals have fully recovered from surgery within 3 days (Alonso et al. 2007). The FSIVGTT was performed on day 28 using the same protocol described above for the 1-day exposure.
Fig. 1.

Timeline for experimental protocols. Timeline of frequently sampled intravenous glucose tolerance test (FSIVGTT; glucose bolus of 1 g/kg D-50 given over a 15-s period through the venous catheter) protocols for 1-day and 4-week studies of exposure to intermittent hypoxia (IH) or continuous hypoxia (CH) and respective intermittent air (IA) and unhandled (UN) control groups
A second set of four groups of animals (n = 6–9 per group) underwent the same regimen of 1-day or 4-week exposure and were killed under deep pentobarbital anesthesia (100 mg/kg) for organ harvesting without undergoing the FSIVGTT.
FSIVGTT
Details of our methodology and validation of the model for performing the FSIGTT in conscious mice have previously been described in detail (Alonso et al. 2012). Animals were fasted from 8 a.m. on the morning of the FSIVGTT procedure. Baseline measurements of glucose and insulin (~20 μl; radioimmunoassay) were taken by sampling arterial blood prior to beginning the FSIVGTT. A glucose bolus of 1 g/kg D-50 was given over a 15-s period through the venous catheter. Arterial blood was sampled according to the following schedule for glucose and insulin with red blood cells spun down and re-infused to the mouse throughout the protocol to avoid blood loss: glucose sampled at −30, −10, 0, 1, 2, 3, 4, 5, 6, 8, 10, 12, 14, 16, 18, 20, 25, 30, 60, 90, 120 min; insulin sampled at −30, −10, 0, 1, 2, 4, 8, 12, 16, 20, 30, 60, 90, 120 min.
Minimal model
Blood glucose and plasma insulin curves from the FSIVGTT were applied to the minimal model analyses described by Bergman et al. (1981) with the following modifications to account for the faster glucose disposal in mice compared to humans: the mixing phase was defined as 0–2 min; the AIRg was calculated based on insulin values between 0 and 4 min; Sg was modeled between 2 and 5 min (Alonso et al. 2012).
Biochemical assays
Blood glucose was measured using a Prodigy Autocode glucometer (Diagnostic Devices Inc, Charlotte, NC, USA). Plasma insulin was measured by radioimmunoassay (Linco sensitive rat insulin RIA kit, Millipore, Billerica, MA, USA) and free fatty acids were measured by colourimetric assay (Roche, Indianapolis, IN, USA; catalogue # 11383175001).
Real time RT-PCR and Western blot analyses
Total RNA was isolated from the frozen soleus muscle using the RNeasy mini-kit (Quiagen Inc., USA) per manufacturer's instructions. DNA was removed from the samples via a DNase step during RNA purification in the RNeasy kit. Reverse transcription was performed on 1 ug of total RNA using the Reverse IT First Stand Synthesis Kit (Abgene Inc., USA). Real-time RT-PCR was subsequently performed using the DNA binding dye SYBR Green3 and previously validated primers for mouse glucose transporter 4 (GLUT4), endothelial nitric oxide synthase (eNOS), and 18S ribosomal RNA (Pimiento et al. 2008; Makikallio et al. 2006; Hertzel et al. 2006).
For Western blots, soleus muscle was lysed in 125 mmol/l Tris, pH 6.8, 2 % SDS, 1 mmol/l dithiothreitol, 20 ug/ml p-amidinophenyl methanesulfonyl fluoride hydrochloride, and protease-inhibitor cocktail; sonicated; centrifuged and loaded onto SDS-PAGE gels. Antibodies used included phospho-Akt, total Akt and beta-actin (Cell Signaling, Beverly, MA, USA).
Statistical analyses
Differences between means in each of the four experimental groups after either 1 day or 4 weeks of exposure was determined by two-way ANOVA for hypoxia (IH and CH) or control (unhandled and IA) factors, with variable log transformed as appropriate to maintain normality. Where the ANOVA indicated statistical significance (p < 0.05), differences between the means of the four experimental groups were determined by a post-hoc Newman–Keuls test. Comparisons were not made between the 1-day and 4-week groups, except as stated in the “Results”. Data are reported as mean ± SEM.
Results
Baseline parameters
Baseline data for age, weight, and blood glucose and plasma insulin prior to the FSIVGTT are shown in Table 1. In the 1-day exposure, there was an overall independent effect for hypoxia (p = 0.001; ANOVA) to raise basal blood glucose, but due to variability, only CH was statistically higher than its unhandled control group by post-hoc analyses (p = 0.025). There was no difference in baseline plasma glucose between any groups at 4 weeks, but plasma glucose was lower in the CH group at 4 weeks compared to the CH group at 1 day (p = 0.037; t test). There were no differences in insulin between any group at either 1 day or 4 weeks.
Table 1.
Baseline parameters of mice prior to initiation of the frequently sampled intravenous glucose tolerance test
| Intermittent air | Intermittent hypoxia | Unhandled | Continuous hypoxia | |
|---|---|---|---|---|
| 1 day | ||||
| Age (days) | 80 ± 3 | 86 ± 3 | 76 ± 3 | 84 ± 3 |
| Weight (g) | 23.6 ± 0.6 | 23.6 ± 0.4 | 22.4 ± 0.5 | 24.6 ± 0.7 |
| Basal glucose (mg dl−1) | 85 ± 5 | 102 ± 7 | 85 ± 3 | 112 ± 7* |
| Basal insulin (ng ml−1) | 0.59 ± 0.16 | 0.67 ± 0.11 | 0.70 ± 0.15 | 0.65 ± 0.06 |
| Sample size | 8 | 9 | 7 | 10 |
| 4 weeks | ||||
| Age (days) | 107 ± 1 | 108 ± 1 | 106 ± 1 | 106 ± 1 |
| Weight (g) | 25.5 ± 0.6 | 22.8 ± 0.6 | 23.9 ± 0.7 | 23.3 ± 0.5 |
| Basal glucose (mg dl−1) | 102 ± 5 | 103 ± 3 | 101 ± 5 | 93 ± 4¥ |
| Basal insulin (ng ml−1) | 0.54 ± 0.08 | 0.48 ± 0.10 | 0.50 ± 0.08 | 0.45 ± 0.07 |
| Sample size | 10 | 11 | 10 | 11 |
p < 0.05 compared to unhandled at 1 day;
p < 0.05 compared to 1 day of continuous hypoxia
Acute 1-day exposure to IH and CH
The glucose curves for the IH and CH groups and their respective controls are shown in Fig. 2a, c. Both the IA and UN control groups exhibited similar glucose disposal curves, with glucose peaking within the first minute and rapidly returning to basal levels within approximately 15 min. In contrast, during IH and CH exposure, the glucose disposal curves were markedly delayed, resulting in impaired glucose tolerance as evident by a more than 30 % increase in AUCg for both forms of hypoxia compared to controls (Table 2). For the IH group, the impaired glucose disposal was the result of significant decreases in both insulin-dependent (SI; Fig. 3a) and insulin-independent (Sg; Fig. 3b) disposal of glucose. The CH group also showed a significant decrease in Sg, but the SI was not significantly different from UN controls, although it did show a strong trend (p = 0.0756 by ANOVA) to be increased relative to the IH group. Thus, Sg was equally impaired by IH or CH exposure, but the slower glucose decay of the IH group compared to the CH group relative to the change in insulin (Fig. 2b, d) resulted in the development of significant insulin resistance only in the IH group.
Fig. 2.

FISVGTT after 1-day exposure to IH and CH. Frequently sampled intravenous glucose tolerance test after 1-day of exposure in hypoxic and control animals. At time zero an i.v. injection of 1 g/kg D-50 was administered over a 15-s interval and blood glucose and plasma insulin were sampled over a 2-h period: glucose (a) and insulin (b) curves for the intermittent air (IA) control and intermittent hypoxia (IH) groups; glucose (c) and insulin (d) curves for the unhandled (UN) control and continuous hypoxia (CH) groups
Table 2.
Area under the curve for glucose (AUCg), acute insulin response to glucose (AIRg), and the disposition index (DI) as determined by the frequently sampled intravenous glucose tolerance test and the application of the minimal model in each of the four experimental groups after acute (1 day) and chronic (4 weeks) exposure to hypoxia
| Intermittent air | Intermittent hypoxia | Unhandled | Continuous hypoxia | |
|---|---|---|---|---|
| 1 day | ||||
| AUCg (mg dl−1 min−1) | 14,796 ± 814 | 21,009 ± 376** | 13,824 ± 527 | 19,929 ± 821** |
| AIRg (μU l−1) | 175 ± 41 | 91 ± 18* | 201 ± 32 | 117 ± 16* |
| DI (units) | 3,046 ± 1,214 | 788 ± 33 | 3,607 ± 770 | 1,818 ± 736 |
| 4 weeks | ||||
| AUCg (mg dl−1 min−1) | 15,947 ± 595 | 17,596 ± 796 | 16,159 ± 695 | 13,928 ± 538¥ |
| AIRg (μU l−1) | 401 ± 64 | 119 ± 35** | 163 ± 25 | 136 ± 56 |
| DI (units) | 6,598 ± 955 | 1,453 ± 780** | 2,453 ± 845 | 3,797 ± 1,193**,¥ |
p < 0.05,
p < 0.01 for intermittent hypoxia versus intermittent air or continuous hypoxia versus unhandled;
p < 0.05 for intermittent hypoxia versus continuous hypoxia
Fig. 3.
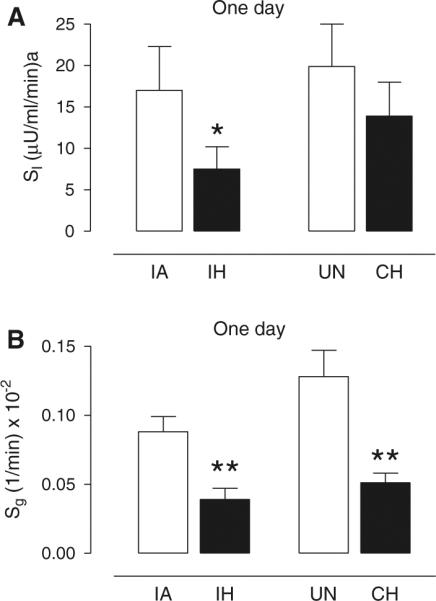
Effect of 1-day exposure of IH or CH on insulin sensitivity and glucose effectiveness. Mean ± SE values for a insulin sensitivity (SI) and b glucose effectiveness (Sg) for each experimental group of intermittent air (IA), intermittent hypoxia (IH), unhandled (UN) control, and continuous hypoxia (CH) after 1 day of exposure. Significance determined by two-way ANOVA with differences between the means of the four experimental groups assessed by a post-hoc Newman–Keuls test. *p < 0.05 and **p < 0.005 for IH versus IA or CH versus UN
The insulin response curves were also affected by exposure to IH and CH (Fig. 2b, d). For the IA and UN control groups, insulin peaked within the first minute, and similar to the glucose curves, rapidly declined back to basal levels within 15 min. The IH and CH insulin curves peaked at lower levels than their respective control curves resulting in significant decreases in the AIRg for both hypoxic curves (Table 2). It is also noteworthy that the IH and CH insulin curves remained elevated compared to control groups between 20 and 60 min, likely reflecting the severely impaired glucose disposal that occurred during this time period. The disposition index (SI × AIRg), which is a sensitive predictor of diabetes, showed a strong trend to be reduced in the IH group (p = 0.059 by ANOVA) compared to the IA control group (and was significantly reduced if compared to the UN control group; p = 0.025 by ANOVA). Although the disposition index (DI) of the CH group was intermediate between the control groups and the IH group, the differences were not statistically significant.
Chronic 4-week exposure to IH and CH
The glucose curves for the animals exposed to 4 weeks of IH and CH and their respective controls are shown in Fig. 4a, c. The IH glucose curve was still above its IA control curve at every time-point between 5 and 30 min, but unlike the acute 1-day exposure, the degree of glucose intolerance (AUCg; Table 2) was no longer different between the IA and IH groups. In contrast, the CH curve was below its unhandled control curve between 5 and 30 min, although again there were no statistical differences in AUCg between the CH and control groups. However, the IH and CH glucose curves exhibited the greatest differences and the AUCg was significantly less in CH animals compared to IH animals (Table 2; Fig. 5a). Consistent with this relative improvement in glucose tolerance after 4-week exposure to CH, there was a normalization of Sg and an increase in SI that was significantly elevated above its UN control group (Fig. 6a, b). Sg was also normalized after 4 weeks of exposure to IH and there was a trend (p = 0.17) for a sustained reduction in SI compared to IA controls. There was a very large and significant elevation in SI of the CH mice compared to the IH mice (Fig. 6a).
Fig. 4.

FISVGTT after 4-week exposure to IH and CH. Frequently sampled intravenous glucose tolerance test after 4 weeks of exposure in hypoxic and control animals. At time zero, an i.v. injection of 1 g/kg D-50 was administered over a 15-s interval and blood glucose and plasma insulin were sampled over a 2-h period: glucose (a) and insulin (b) curves for the intermittent air (IA) control and intermittent hypoxia (IH) groups; glucose (c) and insulin (d) curves for the unhandled (UN) control and continuous hypoxia (CH) groups
Fig. 5.

Re-plotting of FISVGTT curves without controls after 4-week exposure to IH and CH. Frequently sampled intravenous glucose tolerance test after 4 weeks of exposure in hypoxic animals. At time zero, an i.v. injection of 1 g/kg D-50 was administered over a 15-s interval and blood glucose and plasma insulin were sampled over a 2-h period: glucose (a) and insulin (b) curves for the intermittent hypoxia (IH) groups and continuous hypoxia (CH) groups only. Data re-plotted from Fig. 4 to emphasize much faster glucose disposal under CH compared to IH conditions
Fig. 6.
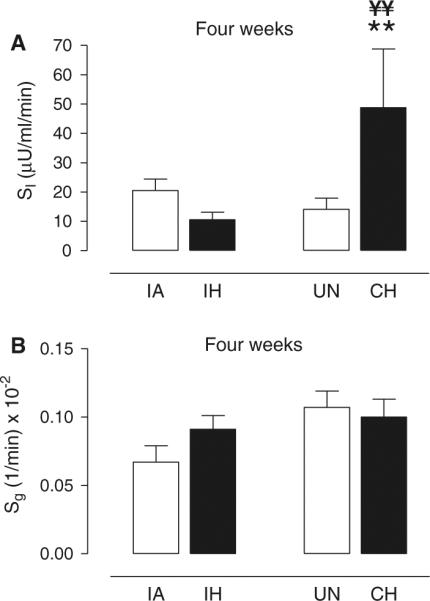
Effect of 4-week exposure of IH or CH on insulin sensitivity and glucose effectiveness. Mean ± SE values for a insulin sensitivity (SI) and b glucose effectiveness (Sg) for each experimental group of intermittent air (IA), intermittent hypoxia (IH), unhandled (UN) control, and continuous hypoxia (CH) after 4 weeks of exposure. Significance determined by two-way ANOVA with differences between the means of the four experimental groups assessed by a post-hoc Newman–Keuls test. **p < 0.01 for CH versus UN; ¥¥p < 0.005 CH versus IH
The insulin response curves of the IH, CH, and control mice are shown in Figs. 4b, d and 5b. The AIRg of the IH group was significantly less than its IA control group, although the IA group had an insulin response that was different from the other UN control group and possibly related to the variability we have previously reported in insulin secretory responses in the C57BL/6J strain (Alonso et al. 2012) [note: for insulin (1) there was no batch or litter effect, because the order of experimentation was determined by block design across groups and (2) there was no assay effect, because the insulin data for the IA group were assessed across three separate assays equally dispersed among the four experimental groups]. Although the IA group exhibited a relatively large AIRg, it is worth noting that modeling of the relationship between insulin and glucose resulted in normal values for SI (i.e., the IA group also had a rapid glucose disposal curve; Fig. 4a). Despite the larger AIRg of the IA group it is likely that insulin secretion remains impaired after 4 weeks of IH, as the IH group also showed a very strong trend for AIRg to be reduced compared to the other unhandled control group (119 ± 35 vs. 163 ± 25 μU/l, p = 0.054 by ANOVA; Table 2). The highly insulin-sensitive state of the CH animals resulted in an elevated DI compared to its unhandled control group as well as the IH group (Table 2).
FFA levels and molecular analyses
In separate groups of animals from those that underwent the FSIVGTT, circulating levels of free fatty acids and molecular assessment of soleus muscle tissue were undertaken as an initial screen to gain insight into the mechanisms underlying the physiological phenotypes we observed. In general, free fatty acid levels were variable and no statistical differences were observed between any groups by ANOVA (Table 3). However, it was interesting that the lowest free fatty acid levels were observed in the 4-week CH group (p = 0.15; compared to 4-week UN group by unpaired t test), which exhibited the highest insulin sensitivity. We also investigated the phosphorylation of Akt protein (Table 3) and GLUT4 mRNA expression (Fig. 7a, b) as an index of activation of the insulin signaling pathway. No differences were observed between any of the four experimental groups under basal, non-insulin-stimulated conditions after 1 day or 4 weeks of exposure to IH or CH. Finally, we measured eNOS expression as potential marker of increased NO and muscle blood flow delivery in response to hypoxia. There were no differences between groups after 1 day of IH or CH exposure (Fig. 7c), but there was a significant, more than fourfold, increase in eNOS expression after four weeks of CH exposure compared to both the UN control group and the IH group (Fig. 7d).
Table 3.
Total- and phosphorylated-Akt protein levels in soleus muscle and plasma free fatty acid (FFA) levels in each of the four experimental groups after acute (1 day) and chronic (4 weeks) exposure to hypoxia
| Intermittent air | Intermittent hypoxia | Unhandled | Continuous hypoxia | |
|---|---|---|---|---|
| 1 day | ||||
| t-Akt | 2.91 ± 0.61 | 2.09 ± 0.47 | 1.54 ± 0.28 | 2.40 ± 0.51 |
| p-Akt | 1.38 ± 0.31 | 1.12 ± 0.40 | 1.30 ± 0.30 | 1.70 ± 0.41 |
| p-Akt/t-Akt | 0.54 ± 0.12 | 0.53 ± 0.14 | 0.94 ± 0.30 | 0.76 ± 0.17 |
| FFA (mM) | 0.80 ± 0.31 | 0.70 ± 0.20 | 1.12 ± 0.60 | 0.99 ± 0.49 |
| 4 weeks | ||||
| t-Akt | 1.30 ± 0.15 | 1.24 ± 0.19 | 1.86 ± 0.23 | 1.53 ± 0.18 |
| p-Akt | 0.77 ± 0.17 | 0.45 ± 0.08 | 1.26 ± 0.27 | 0.80 ± 0.22 |
| p-Akt/t-Akt | 0.60 ± 0.11 | 0.36 ± 0.02 | 0.70 ± 0.16 | 0.52 ± 0.15 |
| FFA (mM) | 0.72 ± 0.28 | 0.64 ± 0.23 | 0.90 ± 0.39 | 0.27 ± 0.12 |
Data collected from animals that did not undergo the FSIVGTT: n = 6–9 per group
Fig. 7.

Biochemical and molecular responses to 1-day and 4-week exposure to IH or CH in skeletal muscle. Mean ± SE values for fold change (Δ–Δ cycle threshold; CT) in expression of a glucose transporter 4 (GLUT4) and b endothelial nitric oxide synthase (eNOS) for intermittent hypoxia (IH) and continuous hypoxia (CH) groups relative to respective intermittent air (IA) and unhandled (UN) control groups after 1 day or 4 weeks of exposure. Significance determined by one-way ANOVA with differences between the means of the four experimental groups at 1 day or 4 weeks assessed by a post-hoc Newman–Keuls test. Statistical differences were determined from Δ CT between GLUT4 or eNOS and 18S ribosomal RNA. *p < 0.05 CH versus UN; ¥¥p < 0.025 CH versus IH; n = 6–9 per group
Discussion
Exposure to hypoxia occurs in various forms and durations and can significantly impact on glucose and insulin regulation. Here, we compare the acute and chronic metabolic effects of two experimental hypoxic models simulating the night-time intermittent hypoxia of sleep apnoea and the continuous hypoxia of altitude. We utilized an integrative physiological assessment of glucose homeostasis that combines a FSIVGTT with mathematical modeling of the relationship between glucose and insulin. Although the FSIVGTT and minimal model approach is commonly used in humans and was recently validated by our group in mice (Alonso et al. 2012), this is the first experimental application of the model in conscious mice. Our data in lean mice suggest several new findings relevant to metabolic changes occurring in sleep apnoea and altitude exposure. First, we show that acute 1-day exposure to IH or CH results in impaired glucose tolerance, reduced non-insulin-dependent glucose uptake, and blunted insulin secretion from the pancreas. However, insulin-dependent glucose uptake was decreased significantly only in IH exposed mice and reflected an increased risk for the development of diabetes as evident by a reduced DI. Second, after 4 weeks of chronic exposure there was adaptation in many of the metabolic parameters. Glucose tolerance and non-insulin-dependent glucose uptake were now comparable between each hypoxic group and their respective control groups. There were, however, indications based on non-significant trends that insulin sensitivity and pancreatic insulin secretion may remain impaired after 4 weeks of IH exposure. Third, there were marked differences in metabolism between chronic exposure to CH and IH. In CH animals, there was a supranormal increase in insulin sensitivity compared to IH animals resulting in improved glucose tolerance and an elevated disposition index; notably, these metabolic improvements with chronic CH exposure occurred in healthy lean mice. In the discussion that follows, we present our findings in the context of previous metabolic studies of sleep apnoea and altitude acclimatization and explore potential metabolic pathways.
Metabolism and sleep apnoea
Numerous studies show an association between sleep apnoea and indices of impaired insulin sensitivity. The relationship between sleep apnoea and insulin resistance remains significant after adjustment for measures of obesity (e.g., weight, BMI, neck circumference) and is associated with the degree of hypoxic stress (Punjabi et al. 2004). However, smaller therapeutic intervention studies using continuous positive pressure therapy to treat sleep apnoea have produced equivocal findings leading to suggestions that metabolic improvements may be limited to less obese apneics (Harsch et al. 2004) and that insulin resistance may be effectively irreversible in severely obese apneic patients with pre-existing diabetes (West et al. 2007).
Recently, Punjabi and Beamer (2009) were the first to utilize the FSIVGTT and minimal model approach in apneics. They reported that with increasing severity of apnoea, there were decreases in SI, Sg, and DI. In addition, they interpreted the absence of a compensatory increase in AIRg with worsening SI across apneics groups as a deficit in pancreatic beta-cell secretion of insulin. Moreover, decrease in SI and DI correlated significantly with the average degree of oxyhemoglobin desaturation, suggesting that the metabolic derangements were dependent on the development of hypoxic stress in the apneic subjects. In a follow-up study, Louis and Punjabi (2009) exposed normal human volunteers to 8 hours of IH in an almost identical experiment to our acute IH experiment in lean mice. This clinical physiology study produced similar findings to our animal study with acute IH exposure in normal humans leading to significant reductions in SI, Sg, and DI, although they did not see any evidence of compromised pancreatic beta-cell secretion in the form of a reduced AIRg. This latter result could be due to the mice receiving a greater hypoxic stimulus than the humans, although the minimum SaO2 values reported in humans are in range of our recent blood gas analyses of the IH profile in mice (Lee et al. 2009), or may reflect an increased pancreatic sensitivity to hypoxia in mice compared to humans. Nevertheless, there was considerable agreement between the human studies and our mouse model suggesting that IH exerts a common underlying metabolic stress, and furthermore highlights the utility of the FSIVGTT and minimal model approach for comparison between species.
Metabolism and altitude
An unexpected finding of our study was the supranormal insulin sensitivity that occurred in animals exposed to CH for 4 weeks, which represented a marked reversal in metabolic function compared to the acute 1-day response to CH. Our data are consistent with a recent study in C57BL/6J mice showing 4 weeks of exposure to 10 % oxygen lowers basal blood glucose (Gamboa et al. 2011). Although there are few human studies examining metabolic function associated with CH, or altitude, there is biological plausibility to support our experimental observations in mice. Hyperinsulinemic euglycemic clamp studies in humans rapidly ascending to 4,559-m altitude show time-related improvements in an initially insulin resistant state (Larsen et al. 1997), and aspects of the metabolic syndrome, including glucose tolerance, were improved with 3-week exposure period to an altitude of 1,700 m (Schobersberger et al. 2003). Finally, studies in high-altitude natives suggest that chronic exposure to CH has potential metabolic advantages, particularly under conditions of obesity and pre-existing metabolic dysfunction (Castillo et al. 2007; Santos et al. 2001; Lhamo et al. 2008).
Animal studies of chronic exposure to CH are often complicated by weight loss, which independent of any effect of the hypoxia would be expected to induce positive metabolic changes. However, weight changes were small in our study and the UN control group was effectively weight-matched to the highly insulin-sensitive CH group after 4-week exposure. Moreover, the lightest group was the 4-week IH-exposed animals, which exhibited significantly reduced glucose tolerance, SI, and DI compared to CH animals, consistent with the type of hypoxic exposure, rather than any weight changes, being the predominant factor affecting insulin resistance in our model system. It will be interesting in future studies to determine whether milder forms of shorter duration CH can improve metabolic function in insulin-resistant obese animals without inducing the co-morbidities that are known to accompany long-term CH exposure (e.g., polycythemia, pulmonary hypertension, and right ventricular hypertrophy (Campen et al. 2005; Yu et al. 1999).
Pattern and severity of the hypoxic stimulus
We have previously assessed the degree of hypoxemia associated with our IH protocol and 10 % CH protocol using arterial blood gases from conscious unrestrained lean C57BL/6J mice. At a nadir of 6.0 ± 0.2 % inspired oxygen during the IH protocol, PaO2, PaCO2, and pH were 47 ± 2 mmHg, 26 ± 2 mmHg, and 7.46 ± 0.2 units, respectively (Lee et al. 2009); the corresponding blood gases during 10 % CH exposure were 41 ± 3 mmHg, 26 ± 2 mmHg, and 7.49 ± 0.2 units, respectively (Tagaito et al. 2001), emphasizing that the maximum, but transient, degree of hypoxemia associated with IH is not more severe than that experienced with CH under our experimental conditions. The implication is that the pattern of cyclical hypoxia/reoxygenation, rather than the absolute severity of the hypoxia, is the predominant factor driving the differences in metabolism we see between the IH and CH groups with chronic exposure.
Mechanisms of action
The mechanisms by which the hypoxia impacts on metabolism are likely dependent on both the pattern and the duration of hypoxic exposure. Physiologically, the acute 1-day exposure to either IH or CH resulted in a relatively similar profile of metabolic impairments. Our data did not show evidence of changes in the insulin signaling pathway or free fatty acid levels that would influence glucose uptake across the cell membrane or any alteration in eNOS expression that might indicate altered vasoreactivity and blood glucose delivery to muscle through nitric oxide-mediated mechanisms. We have previously reported that the reduced insulin sensitivity that occurs with 1-day exposure to IH is not dependent on autonomic pathways (Iiyori et al. 2007). We have, however, shown that our acute IH regimen results in large increases in plasma corticosterone (Yokoe et al. 2008) and we speculate that the activation of counter-regulatory hormones with the physiologic stress of the initial exposure to either IH or CH is the most likely mechanism leading to the acute metabolic derangements we observe.
After 4-week exposure to hypoxia, the metabolic responses to IH and CH were very different. The surprising improvement in metabolic function with chronic CH exposure was not associated with activation of the insulin signaling pathway. However, it should be noted that the p-Akt and GLUT4 data were generated from skeletal muscle under basal, or non-insulin-stimulated, conditions, and we did not measure protein levels of GLUT 4 or other important molecules that contribute to glucose disposal such as p-AMPK. Indeed, Gamboa et al. (2011) showed in their recent paper that 4-week exposure to 10 % CH in C57BL/6J mice also did not upregulate insulin signaling under basal conditions, consistent with our findings, but they did observe an increase in phosphorylation of Akt and glucose uptake in the soleus muscle under insulin-stimulated conditions. In addition, our 4-week CH group showed a trend for a decrease in circulating free fatty acids, which could potentially improve insulin signaling by reducing any interacting effect of lipotoxicity. We also observed more than fourfold increase in eNOS expression that occurred only in the chronic CH group. A putative increase in NO-mediated blood flow, and hence, muscle glucose delivery after 4 weeks of CH exposure would be consistent with the recent findings of elevated NO and increased forearm blood flow in high-altitude natives (Erzurum et al. 2007). However, experiments directly assessing muscle blood flow, which were beyond the scope of the current study, would be necessary to confirm a blood glucose delivery mechanism. Regardless of the potential roles of muscle glucose delivery and insulin responsiveness, our data demonstrate that a unique metabolic adaptation occurs with chronic exposure to CH or altitude that is not present with chronic exposure to IH or sleep apnoea.
Conclusion
The metabolic responses to hypoxia in lean mice are dependent on both the pattern and chronicity of exposure. Acute 1-day exposure to IH or CH caused similar deficits in glucose tolerance, non-insulin-mediated glucose uptake, and pancreatic insulin secretion, although insulin-mediated glucose uptake was more compromised with IH than CH exposure. After 4 weeks of exposure to either IH or CH, normalization of non-insulin-mediated glucose uptake occurred, but insulin sensitivity remained significantly impaired after IH compared to CH exposure. It will be interesting in future studies to determine if more milder degrees of chronic CH exposure can improve metabolic function in the obese, or diabetic, state without eliciting any co-morbid cardiorespiratory side effects, potentially revealing a novel therapeutic strategy for treating insulin resistance.
Acknowledgments
These studies were supported by the National Heart, Lung, and Blood Institute Grant HL063767.
Abbreviations
- AIRg
Acute insulin response to glucose
- AUCg
Area under the curve for glucose
- CH
Continuous hypoxia
- DI
Disposition index
- eNOS
Endothelial nitric oxide synthase
- FSIVGTT
Frequently sampled intravenous glucose tolerance test
- FFA
Free fatty acids
- GLUT4
Glucose transporter 4
- IA
Intermittent air
- IH
Intermittent hypoxia
- Sg
Glucose effectiveness (non-insulin-mediated glucose uptake)
- SI
Insulin sensitivity
- UN
Unhandled
Footnotes
Conflict of interest No author has any conflict of interest with respect to the experiments conducted or the data collected for this manuscript.
References
- Alonso LC, Yokoe T, Zhang P, Scott DK, Kim SK, O'Donnell CP, Garcia-Ocana A. Glucose infusion in mice: a new model to induce beta-cell replication. Diabetes. 2007;56:1792–1801. doi: 10.2337/db06-1513. [DOI] [PMC free article] [PubMed] [Google Scholar]
- Alonso LC, Watanabe Y, Stefanovski D, Lee EJ, Singamsetty S, Romano LC, Zou B, Garcia-Ocana A, Bergman RN, O'Donnell CP. Simultaneous measurement of insulin sensitivity, insulin secretion and the disposition index in conscious unhandled mice. Obesity. 2012;20(7):1403–1412. doi: 10.1038/oby.2012.36. [DOI] [PMC free article] [PubMed] [Google Scholar]
- Bergman RN, Phillips LS, Cobelli C. Physiologic evaluation of factors controlling glucose tolerance in man: measurement of insulin sensitivity and beta-cell glucose sensitivity from the response to intravenous glucose. J Clin Invest. 1981;68:1456–1467. doi: 10.1172/JCI110398. [DOI] [PMC free article] [PubMed] [Google Scholar]
- Campen MJ, Shimoda LA, O'Donnell CP. Acute and chronic cardiovascular effects of intermittent hypoxia in C57BL/6J mice. J Appl Physiol. 2005;99:2028–2035. doi: 10.1152/japplphysiol.00411.2005. [DOI] [PubMed] [Google Scholar]
- Castillo O, Woolcott OO, Gonzales E, Tello , Tello L, Villarreal C, Mendez N, Damas L, Florentini E. Residents at high altitude show a lower glucose profile than sea-level residents throughout 12-hour blood continuous monitoring. High Alt Med Biol. 2007;8:307–311. doi: 10.1089/ham.2007.8407. [DOI] [PubMed] [Google Scholar]
- Erzurum SC, Ghosh S, Janocha AJ, Xu W, Bauer S, Bryan NS, Tejero J, Hemann C, Hille R, Stuehr DJ, Feelisch M, Beall CM. Higher blood flow and circulating NO products offset high-altitude hypoxia among Tibetans. Proc Natl Acad Sci USA. 2007;104:17593–17598. doi: 10.1073/pnas.0707462104. [DOI] [PMC free article] [PubMed] [Google Scholar]
- Gamboa JL, Garcia-Cazarin ML, Andrade FH. Chronic hypoxia increases insulin-stimulated glucose uptake in mouse soleus muscle. Am J Physiol Regul Integr Comp Physiol. 2011;300:R85–R91. doi: 10.1152/ajpregu.00078.2010. [DOI] [PMC free article] [PubMed] [Google Scholar]
- Harsch IA, Schahin SP, Radespiel-Troger M, Weintz O, Jahreiss H, Fuchs FS, Wiest GH, Hahn EG, Lohmann T, Konturek PC, Ficker JH. Continuous positive airway pressure treatment rapidly improves insulin sensitivity in patients with obstructive sleep apnea syndrome. Am J Respir Crit Care Med. 2004;169:156–162. doi: 10.1164/rccm.200302-206OC. [DOI] [PubMed] [Google Scholar]
- Hertzel AV, Smith LA, Berg AH, Cline GW, Shulman GI, Scherer PE, Bernlohr DA. Lipid metabolism and adipokine levels in fatty acid-binding protein null and transgenic mice. Am J Physiol Endocrinol Metab. 2006;290:E814–E823. doi: 10.1152/ajpendo.00465.2005. [DOI] [PubMed] [Google Scholar]
- Iiyori N, Alonso LC, Li J, Sanders MH, Garcia-Ocana A, O'Doherty RM, Polotsky VY, O'Donnell CP. Intermittent hypoxia causes insulin resistance in lean mice independent of autonomic activity. Am J Respir Crit Care Med. 2007;175:851–857. doi: 10.1164/rccm.200610-1527OC. [DOI] [PMC free article] [PubMed] [Google Scholar]
- Ip MS, Lam B, Ng MM, Lam WK, Tsang KW, Lam KS. Obstructive sleep apnea is independently associated with insulin resistance. Am J Respir Crit Care Med. 2002;165:670–676. doi: 10.1164/ajrccm.165.5.2103001. [DOI] [PubMed] [Google Scholar]
- Larsen JJ, Hansen JM, Olsen NV, Galbo H, Dela F. The effect of altitude hypoxia on glucose homeostasis in men. J Physiol. 1997;504(Pt 1):241–249. doi: 10.1111/j.1469-7793.1997.241bf.x. [DOI] [PMC free article] [PubMed] [Google Scholar]
- Lee EJ, Woodske ME, Zou B, O'Donnell CP. Dynamic arterial blood gas analysis in conscious, unrestrained C57BL/6J mice during exposure to intermittent hypoxia. J Appl Physiol. 2009;107:290–294. doi: 10.1152/japplphysiol.91255.2008. [DOI] [PMC free article] [PubMed] [Google Scholar]
- Lhamo SY, Supamai S, Virasakdi C. Impaired glucose regulation in a Sherpa indigenous population living in the Everest region of Nepal and in Kathmandu Valley. High Alt Med Biol. 2008;9:217–222. doi: 10.1089/ham.2008.1011. [DOI] [PubMed] [Google Scholar]
- Louis M, Punjabi NM. Effects of acute intermittent hypoxia on glucose metabolism in awake healthy volunteers. J Appl Physiol. 2009;106:1538–1544. doi: 10.1152/japplphysiol.91523.2008. [DOI] [PMC free article] [PubMed] [Google Scholar]
- Makikallio K, Rounioja S, Vuolteenaho O, Paakkari J, Hallman M, Rasanen J. Fetal cardiac natriuretic peptide expression and cardiovascular hemodynamics in endotoxin-induced acute cardiac dysfunction in mouse. Pediatr Res. 2006;59:180–184. doi: 10.1203/01.pdr.0000196719.95046.19. [DOI] [PubMed] [Google Scholar]
- Pimiento JM, Maloney SP, Tang PC, Muto A, Westvik TS, Fitzgerald TN, Fancher TT, Tellides G, Dardik A. Endothelial nitric oxide synthase stimulates aneurysm growth in aged mice. J Vasc Res. 2008;45:251–258. doi: 10.1159/000112940. [DOI] [PubMed] [Google Scholar]
- Polotsky VY, Li J, Punjabi NM, Rubin AE, Smith PL, Schwartz AR, O'Donnell CP. Intermittent hypoxia increases insulin resistance in genetically obese mice. J Physiol. 2003;552:253–264. doi: 10.1113/jphysiol.2003.048173. [DOI] [PMC free article] [PubMed] [Google Scholar]
- Punjabi NM, Beamer BA. Alterations in glucose disposal in sleep-disordered breathing. Am J Respir Crit Care Med. 2009;179:235–240. doi: 10.1164/rccm.200809-1392OC. [DOI] [PMC free article] [PubMed] [Google Scholar]
- Punjabi NM, Shahar E, Redline S, Gottlieb DJ, Givelber R, Resnick HE. Sleep-disordered breathing, glucose intolerance, and insulin resistance: the Sleep Heart Health Study. Am J Epidemiol. 2004;160:521–530. doi: 10.1093/aje/kwh261. [DOI] [PubMed] [Google Scholar]
- Santos JL, Perez-Bravo F, Carrasco E, Calvillan M, Albala C. Low prevalence of type 2 diabetes despite a high average body mass index in the Aymara natives from Chile. Nutrition. 2001;17:305–309. doi: 10.1016/s0899-9007(00)00551-7. [DOI] [PubMed] [Google Scholar]
- Schobersberger W, Schmid P, Lechleitner M, von Duvillard SP, Hortnagl H, Gunga HC, Klingler A, Fries D, Kirsch K, Spiesberger R, Pokan R, Hofmann P, Hoppichler F, Riedmann G, Baumgartner H, Humpeler E. Austrian Moderate Altitude Study 2000 (AMAS 2000): the effects of moderate altitude (1,700 m) on cardiovascular and metabolic variables in patients with metabolic syndrome. Eur J Appl Physiol. 2003;88:506–514. doi: 10.1007/s00421-002-0736-8. [DOI] [PubMed] [Google Scholar]
- Tagaito Y, Polotsky VY, Campen MJ, Wilson JA, Balbir A, Smith PL, Schwartz AR, O'Donnell CP. A model of sleep-disordered breathing in the C57BL/6J mouse. J Appl Physiol. 2001;91:2758–2766. doi: 10.1152/jappl.2001.91.6.2758. [DOI] [PubMed] [Google Scholar]
- West SD, Nicoll DJ, Wallace TM, Matthews DR, Stradling JR. The effect of CPAP on insulin resistance and HbA1c in men with obstructive sleep apnoea and type 2 diabetes. Thorax. 2007;62(11):969–974. doi: 10.1136/thx.2006.074351. [DOI] [PMC free article] [PubMed] [Google Scholar]
- Yokoe T, Alonso LC, Romano LC, Rosa TC, O'Doherty RM, Garcia-Ocana A, Minoguchi K, O'Donnell CP. Intermittent hypoxia reverses the diurnal glucose rhythm and causes pancreatic beta-cell replication in mice. J Physiol. 2008;586:899–911. doi: 10.1113/jphysiol.2007.143586. [DOI] [PMC free article] [PubMed] [Google Scholar]
- Yu AY, Shimoda LA, Iyer NV, Huso DL, Sun X, McWilliams R, Beaty T, Sham JS, Wiener CM, Sylvester JT, Semenza GL. Impaired physiological responses to chronic hypoxia in mice partially deficient for hypoxia-inducible factor 1alpha. J Clin Invest. 1999;103:691–696. doi: 10.1172/JCI5912. [DOI] [PMC free article] [PubMed] [Google Scholar]