

Abstract
Human DNA replication depends on the activation of thousands of origins distributed within the genome. The actual distribution of origins is not known, nor whether this distribution is unique to a cell type, or if it changes with the proliferative state of the cell. In this study we have employed a real time PCR-based nascent strand DNA abundance assay, to determine the location of origins along a 78 kb region on Ch2q34. Preliminary studies using nascent DNA strands isolated from either HeLa and normal skin fibroblast cells showed that in both cell lines peaks of high origin activity mapped in similar locations. However, the overall origin profile in HeLa cells corresponded to broad origin activation zones, whereas in fibroblasts a more punctuated profile of origin activation was observed. To investigate the relevance of this differential origin profile, we compared the origin distribution profiles in breast cancer cell lines MDA-MB-231, BT-474, and MCF-7, to their normal counterpart MCF-10A. In addition, the CRL7250 cell line was also used as a normal control. Our results validated our earlier observation and showed that the origin profile in normal cell lines exhibited a punctuated pattern, in contrast to broader zone profiles observed in the cancer cell lines. A quantitative analysis of origin peaks revealed that the number of activated origins in cancer cells is statistically larger than that obtained in normal cells, suggesting that the flexibility of origin usage is significantly increased in cancer cells compared to their normal counterparts.
Keywords: DNA REPLICATION ORIGINS, NASCENT DNA, REAL TIME PCR, HUMAN CELL LINES, RPE GENE
Duplication of metazoan genomes relies on a programmed activation of origins of DNA replication which ensures that every DNA segment is copied only once during each cell cycle. To achieve this end, these genomes contain more potential origins than those required to complete its duplication. Following the Jesuit dictum “Multi sunt vocati, pauci vero electi” model proposed by DePamphilis (DePamphilis, 1993), it is believed that all potential origins are licensed for initiation of replication, by participating in the formation of pre-replicative complexes (preRCs), however, upon passage into the S phase, only a fraction of these preRCs is selected to be engaged in actual DNA synthesis. Recent experimental evidence, derived from the study of origin activation in single DNA fibers, suggests that preRCs could be classified as containing constitutive, flexible, or dormant origins. Constitutive origins are defined as those that fire upon entry into the S phase in all cell types; flexible origins can be stochastically used in different cells; and finally, dormant origins are those that fire only under special circumstances (Mechali, 2010). The plasticity of origin usage had been largely recognized since the pioneering studies of J.H. Taylor in the 1970’s (Taylor et al., 1973; Taylor, 1977). These studies, using DNA fiber autoradiography in Chinese hamster ovary cells (CHO), showed that the reduction of replication fork movement, achieved by thymidine deprivation, resulted in the shortening of the distance between adjacent replication sites. Recent work by Anglana et al. (Anglana et al., 2003) using fluorescent microscopy has confirmed and extended Taylor’s findings. By studying the distribution of origins of DNA replication around the adenosine deaminase 2 (AMPD2) gene in CHO cells, they have shown that the number of active origins could be modulated by the levels of nucleotide pools. Both studies clearly argue that under conditions of reduced replication fork rate, cells respond by increasing the number of active origins from a pool of otherwise inactive ones. This compensatory effect ensures the maintenance of the duration of the S-phase under conditions of limited nucleotide supply (Gilbert, 2007). Origin selection has also been found to respond to the developmental stage of the organisms, as wells as, to chromosomal context (Mechali, 2010).
Given the range of factors that could modulate origin usage, it has been of interest to investigate if the abnormal metabolism observed in cancer cells could influence origin selection, and provide these cells with alternative replicative programs. Several studies on both transformed, and tumor derived cell lines, have revealed that in these cells the number of origins per unit length of DNA is increased (Martin and Oppenheim, 1977; Oppenheim and Martin, 1978; Frum et al., 2009), and that the activity of specific origins is higher in transformed cells compared to their normal counterparts (Tao et al., 1997; DiPaola et al., 2006; DiPaola et al., 2010). In addition, higher expression of components of the pre-RC coupled to their higher chromatin association has been reported in transformed compared to normal cells (McNairn and Gilbert, 2005). These findings suggest that the regulation of origin selection and activity may be altered in transformed cells.
Our previous work on the mapping of origins of DNA replication using a real time PCR-based nascent DNA abundance assay on a DNA segment encompassing the Ribulose 5′ Phosphate 3-epimerase (RPE) gene had revealed that in normal skin fibroblasts the pattern of origin activation appeared to be punctuated, in contrast to that found in HeLa cells where a broad initiation zone was observed (Hu et al., 2004b). In the present report we have expanded our mapping analysis to cover a 78 kb of contiguous DNA, around the RPE gene, and also extended our study by including five additional normal and tumor derived cell lines. Our results indicate that while the localization of origins along the 78 kb region is largely preserved among all cell lines, the origin profile in normal cell lines exhibited a punctuated pattern, compared to the cancer cell lines, where broader zone profiles were observed. A quantitative analysis has revealed that the number of activated origins in cancer cells is statistically larger than that obtained in normal cells, suggesting that the flexibility of origin usage is significantly increased in cancer cells compared to their normal counterparts.
MATERIALS AND METHODS
CELL LINES, FACS ANALYSIS, AND TOTAL DNA ISOLATION
Cell lines HeLa, MCF-7, MCF-10A, BT-474, MDA-MB-231, CRL7250, and a primary cell line derived from normal skin fibroblasts (generously provided by J. Trupin, Meharry Medical College) were grown to about 70% confluence following required specifications. An aliquot of the cell culture, corresponding to about 106 cells was prepared for Fluorescent Activated Cell Sorting (FACS) analysis using a cellular DNA flow cytometric analysis kit (Roche, IN) and following the manufacturer’s specifications. After FACS analysis the percentage of cells in the S phase served as a good predictor of the amount of nascent strand DNA available in the preparation. Another aliquot of the cell culture was lysed as described below for the isolation of total DNA. This DNA was then sonicated to yield DNA fragments in the size range of 0.5 – 1.5 kb. The resulting DNA was then used for array comparative hybridization (aCGH), for copy number standards in real time PCR reactions, and as control DNA in λ-exonuclease digestions of nascent DNA preparations.
ISOLATION OF SHORT NASCENT STRAND DNA
A procedure previously employed to isolate nascent DNA (Hu et al., 2004a; Valenzuela et al., 2011) was followed with minor modifications. Briefly, about 2–5×10⁸ cells were collected and washed with PBS. After a gentle lysis with SDS in presence of proteinase K, total genomic DNA was extracted with phenol and chloroform, precipitated by centrifugation with ethanol in 0.3M sodium acetate, and resuspended in TE (10mM Tris-HCl, pH 8.0; 1mM EDTA) buffer. The re-suspended DNA was denatured by incubation in boiling water for 12 min, quenched in ice for 6 min, and immediately applied onto a preformed linear 5–30% neutral sucrose gradient. After centrifugation of the gradient in a Beckman SW28 rotor at 24,000 rpm for 20 hrs at 15°C, the gradient was fractionated using an ISCO 185 fractionator. One ml fractions were collected and the linearity of the gradient assessed by measuring the refractive index of every third fraction. Gradients were highly reproducible with regression line R2 values larger than 0.99. The reproducibility of the gradients allowed us to identify fractions corresponding to the desired DNA size range (0.5–1.5 kb), which in our experience fell around a refractive index of 1.35. Fractions were extensively dialyzed against TE buffer. About 80 μl of every fraction was concentrated 10-fold and analyzed by gel electrophoresis in 1% agarose to confirm the DNA size range in the fractions. Fractions containing DNA in the range of 0.5–1.5kb in length were then pooled and concentrated. An aliquot of the pooled DNA was digested with λ-exonuclease following a standard protocol (Gerbi and Bielinsky, 1997), and the quality and abundance of short nascent strands in the λ-exonuclease resistant DNA preparations was assessed by real time PCR.
REAL TIME PCR
In addition to origin/non origin sites previously characterized by others around the Lamin B2 gene and the β-globin locus (Abdurashidova et al., 2000; Aladjem et al., 1998), two bona fide sites, around the ribulose 5-phosphate3-epimerase gene (Hu et al., 2004b) were used as markers to determine the enrichment for initiation sites in the fractions containing our short nascent DNA pools. For our real-time PCR assays, fractions around the DNA size range of 0.5–1.5 kb were brought to a concentration of about 10ng/μl, and 20ng of the DNA was used for each real time PCR assay. As a reference marker, fraction number 25 corresponding to the lower third of the sucrose gradient was also analyzed. PCR reactions were carried out as previously described (Hu et al., 2004a). For each primer set used, total DNA from each of the cell lines which had been sheared by sonication to a size range of 0.5–1.5 kb was diluted to give 20,000, 4,000, 800, 160, and 32 genomic copies per μl respectively. 2μl of these dilutions were run in triplicate as copy number standards. As a negative control 2μl triplicate aliquots of water were used. Copy numbers for origin and non-origin sites were estimated from a standard curve obtained with the samples containing known amounts of genomic equivalents. Ratios of the copy number at these sites larger than 3, were indicative of a good nascent DNA strand preparation. As an internal control, the ratio in fraction number 25 was always found to yield a value close to 1. Short nascent DNA preparations showing ratios larger than 3 were then used in real time PCR reactions, to assess the enrichment at selected sites along the 78 kb region of chromosome2q34 (for a list of the primers sets used see Table S1).
ARRAY COMPARATIVE GENOMIC HYBRIDIZATION (ACGH)
Sonicated total DNA obtained from each of the cell lines, and control male human genomic DNA (Promega, Madison, WI) were quantitated using PicoGreen fluorescence analysis (Quant-iT, Invitrogen, Carlsbad, CA). About 5–10 ug of DNA was labeled using Klenow fragment and random primers according to the manufacturer’s directions (Bioprime, Invitrogen, Carlsbad, CA) with the following nucleotide concentrations:120 uM dATP, dCTP, dGTP and 60 uM dTTP, along with 60 uM Cy3 or Cy5-labelled dUTP. After labeling, the DNA was column purified with QIAquick PCR purification columns (Qiagen, Valencia, CA). Changes in the standard protocol included adding 10 ul of 3 M sodium acetate (pH 5.2) to the probe before purification, and an initial wash step of 500 ul 35% guanidine HCl. The labeled DNA was eluted from the column with EB buffer prewarmed to 50°C. Labeled test and control DNAs were combined and concentrated to 18ul, then 5 ul of Cot 1 DNA (10 ug/ul), 2 ul of yeast tRNA(50 ug/ul), and 25 ul of 2× hybridization buffer (50% formamide, 10× SSC, 0.4% SDS) previously warmed at 42°C. The DNA mixture was denatured at 95°C for 5 min, and incubated at 42°C for 60 min. DNA samples were hybridized onto a oligonucleotide-based microarray (Agilent 44k or Agilent 244K; Agilent Technologies, Santa Clara, CA) for 16–18 hours at 42°C utilizing the MAUI 4-bay hybridization system and MAUI Mixer A0 (BioMicro System, Salt Lake City, UT). After hybridization, array and MAUI Mixer were disassembled in 42°C 1×SSC and 0.05% SDS (wash solution 1) and subsequently washed two times in wash solution 1 for 5 minutes followed by two washes in 0.1×SSC (wash solution 2) for 5 minutes. The slide was then removed from the slide rack and dried by centrifugation (1500 rpm for 3 min) prior to scanning. Microarray slides were scanned on an Agilent Microarray Scanner G2565BA with 5-μm resolution. Captured images were transformed to data with Feature Extraction Software, version 9.5 (Agilent Technologies, Santa Clara, CA), and then imported into Agilent CGH Analytics 3.2.5 software for analysis. The thresholds of log2 ratio values for gain and loss were 0.2 and −0.2, respectively.
RESULTS
IDENTIFICATION OF ORIGINS OF DNA REPLICATION IN HUMAN CELLS
A well established real-time PCR-based nascent DNA abundance assay previously described by us and others (Hu et al., 2004a; Valenzuela et al., 2011) was used to determine the localization of origins of DNA replication. Briefly, about 108 of exponentially growing cells as determined by FACS analysis (see Materials and Methods section) were harvested. Total DNA from this culture was isolated, and upon heat denaturation, layered on a 5–30% continuous sucrose gradient and fractionated in order to obtain nascent DNA in the size range of 0,5 to 1.5 kb. The pooled DNA in this size range was analyzed by real-time PCR for enrichment of three distinct DNA regions containing previously characterized human origins of replication, as well as their adjacent non-origin containing regions. To this end primer sets around the LaminB2 gene, the β-globin locus (Abdurashidova et al., 2000; Aladjem et al., 1998), and the Ribulose 5′ phosphate 3-epimerase gene (RPE)(Hu et al., 2004a&b; Valenzuela et al., 2011), as well as primer sets to their adjacent non-origin regions were used in this study. In all cases, we observed at least three-fold origin enrichment in the fractions covering the 0.5–1.5 kb size range for all the primer sets targeting an origin compared to their non-origin counterparts. In contrast, this enrichment was not observed in fractions containing smaller (<0.3 kb) or larger (>3 kb) size DNA fragments. Also, as previously observed, prior treatment of the 0.5–1.5 kb pooled with λ exonuclease, did not altered the enrichment ratios observed (Hu et al., 2004a&b; Valenzuela et al., 2011), and finally a synchronized population of cells in G1, only showed enrichment upon passage into the S phase (Valenzuela et al., 2011). These results strongly indicated that the nascent DNA in the size range of 0.5–1.5 kb was enriched for DNA sequences that supported initiation of DNA replication.
ORIGIN ACTIVITY AROUND THE RPE GENE IN BOTH HELA AND NORMAL SKIN FIBROBLASTS CELLS
In a previous real time PCR-based study that focused on an 11 kb DNA region on chr2q34, containing the human RPE gene, we had observed that nascent DNA isolated from normal skin fibroblast cells appeared to yield fewer origins of DNA replication compared to a similar preparation isolated from HeLa cells (Hu et al., 2004b). This observation implied that either more origins of replication were fired in HeLa cells or that origin firing in these cells occurred in a more diffuse manner leading to the generation of broad initiation zones. To investigate this latter possibility we decided to check in close detail the profile of nascent DNA enrichment around a previously localized origin of DNA replication site (STS63) shown to be active in both of these cell lines (Hu et al., 2004a&b). To this end, we selected primer sets to amplify DNA regions which were separated by 0.7 to 1.2 kb (STSs 61.2; 61.9; 63; and 64.1; see Figure 1A) and located on each side of STS63. The copy number at each of these locations was then measured in 0.5–1.5 kb nascent DNA preparations obtained from each of the cell lines, using a previously described real-time PCR–based abundance assay. As a baseline control, the copy number at a non-origin region (ST98.4) was also measured. Copy number enrichment values were then calculated for each STS relative to that at STS98.4. Our results shown in Figure 1B indicate first, that our assay is sensitive enough to resolve copy number changes for regions that are closely spaced from each other (< 1.2 kb apart); second, in both preparations the highest enrichment corresponds to the expected origin site at STS63; and third, by comparing the profiles of our RT-PCR assays at these four sites, it is evident that while in fibroblasts the fold enrichment at STS63 is quite predominant with respect to the baseline (10 fold) and adjacent regions (> 2 fold), in Hela cells this enrichment is more modest ( 4-fold and < 2-fold respectively). These results strongly suggest that around STS63 origin activation in HeLa cells is broader than in normal skin fibroblasts. Prompted by this observation, we decided to expand the region of study to cover around 78 kb of Chr2q34 (nucleotide position: 210,993,598-211,071,598). To this end we arbitrarily selected 29 independent primer sets (Figure S1) to query their corresponding DNA regions (100– 240 bp in length) and measure the abundance of each of these DNA regions by real time PCR. Most of the primer sets were separated by about 3 kb except for the region STS60 to STS68 where the separation was about 1 kb in length (see Table S1 and Figure S1 for the list of primer sets used in this study, as well as, for their relative position along the 78 kb region).
Figure 1.

Nascent DNA enrichment profile around an origin located within the RPE gene in both human fibroblasts and HeLa cell lines. (A) Partial diagrammatic representation of the organization of the human RPE gene. Arrow points the direction and position of transcription initiation. Black boxes correspond to exons. The approximate location of closely positioned primer sets (60.1; 61.9; 63; and 64.1) proximal the largest RPE exon and a distal one 30 kb downstream (98.4) are indicated by the colored boxes.(B) Real time-PCR derived copy number fold enrichment at each STS relative to STS98.4 in nascent DNA preparations obtained from normal fibroblasts and HeLa cells respectively.
As shown in Figure 2A and 2B respectively, the distribution of origin peaks was quite different in normal fibroblasts compared to HeLa cells. Whereas in fibroblasts a punctuated profile was observed, the profile in Hela cells showed to be more disperse. This difference became more evident when we plotted the copy number enrichment at each STS relative to the copy number found at STS98.4 invariably found to be the lowest in the two cell lines studied (Figure 2C). The highest level of enrichment in fibroblasts was found at STS40.2 (eleventh fold enrichment) whereas in Hela cells it occurred at STS63 (four-fold enrichment). To better grasp the difference in origin profile between these two cell lines, we calculated the ratio of the enrichment values found at each STS over half of the value found at the highest peak (STS40.2 for fibroblasts, and STS63 for HeLa cells). This provided us with a distribution of peaks that were at least 50% of the maximum peak observed in each cell line preparation. As shown in Figure 2D, whereas most of the half maximal peaks found in fibroblasts occur at the same position as in HeLa cells, indicating that at these origins DNA replication is efficient in both cell lines, in fibroblasts only 7 peaks were classified at least a half maximal value of the peak at STS 40.2. In contrast, 22 sites fulfilled this criteria in HeLa cells, suggesting that the activation of initiation events (at least in this 78 kb interval of chromosome 2) are less specific in HeLa cells compared to cultured normal skin fibroblast cells.
Figure 2.

Origin activity along a 78 kb region of human Chr2q34 in both human fibroblast and HeLa cell lines. Copy number at STSs covering the region as determined by a real time PCR-based nascent strand abundance assay in DNA preparations obtained from (A) normal fibroblast, or (B) HeLa cells. (C) Relative copy number enrichment at each STS with respect to value obtained at STS98.4 for both fibroblast (broken black line) and HeLa (continuous line) cell preparations. (D) Distribution of peaks corresponding to at least half of the maximal copy number found in either fibroblast (filled bars) or HeLa (open bars) cell preparations.
MAPPING OF ORIGINS OF DNA REPLICATION IN HUMAN BREAST CELL LINES
Since both HeLa cells and normal skin fibroblast cell lines can be viewed as representatives of cancer and normal cells, respectively, it was of interest to investigate if the cancer phenotype was associated with a broader distribution of replication origins as observed in HeLa cells. To this end, we decided to obtain nascent DNA preparations from cell lines derived from human breast tissues of both normal and cancer origin. Our study included the well studied breast cancer cell lines MDA-MB-231, MCF-7 and BT-474, as representatives of cancer cell lines and MCF-10A as their ‘normal’ counterpart. In addition, for comparative purposes, the fetal cell line CRL2520 while not originating from breast tissue, but considered as another representative of a normal cell line, was also included in our analysis.
ACGH ANALYSIS OF GENOMIC DNA
Given the fact that the nascent DNA abundance assay used to identify the location of origins of DNA replication relies on copy number changes for the regions queried, it was important to determine that the intrinsic copy number profile around the 78Kb region of Chr2q34 was not altered in all the cell lines included in this study. We therefore performed aCGH analysis of DNA extracted from each of the cell lines using the Agilent 44K or 244k platforms. Our results showed that all breast cancer cell lines harbored specific copy number alterations at several chromosomal locations. None of them however occurred at Ch2q34, with the exception of MDA-MB-231 (which showed a relative loss near the left end of Chr2q34). Unfortunately, the resolution of this array (44K) did not allow us to discern about the proximity of the deletion site to the 78 kb region under study. Of all the cell lines tested, CRL250 showed the least number of genomic variations. Based on these results it is clear that any copy number gains found using our nascent DNA abundance assay, must be solely a reflection of differences in the enrichment for the selected regions tested in the population of short nascent DNA strands obtained from each of the cell lines studied.
ORIGIN ACTIVITY ALONG THE 78 KB REGION OF Chr2q34 IN BREAST CELL LINES
To reduce the number of RT-PCR reactions, without compromising overall coverage, we decided to eliminate four STSs (STSs 60.1, 61.2, 64.1, and 67 respectively) that were positioned less than 1.5 kb apart from their neighboring STSs. The resultant set covered the 78 kb region with 25 STSs with an average distance of 3 kb. Once peaks of origin activity were determined, we compared the strength of these peaks among the various cell lines by calculating the half maximal values as described above. Since our primary interest was in comparing origin peak activities among cancer and normal cell lines, we first determined the reproducibility of the half maximal peak profiles among independent preparations obtained from both MCF-7 and MCF-10A cells. Figure 3 illustrates the correlation of maximal peaks among MCF-7 and MCF-10A duplicates. In MCF-7 eleven out of fourteen half maximal peaks occurred in the same position, whereas in MCF-10A eight out of ten half maximal peaks fulfilled this criterion. For all cell lines tested we have observed a minimum of 80% correlation of half maximal peaks which is consistent with earlier results we had obtained with a larger data set for both MCF-7 and BT-474 (Valenzuela et al., 2011). We ascribed the slight variation found to both the composition of our nascent DNA in each batch, and to internal variations in real time PCR measurements. Interestingly, when the profile from MCF-10A was compared to that of CRL7250, the half maximal peak profiles in both of these unrelated cell lines were also very similar (Figure S2). In both of these cell lines the maximal origin peak was localized around STS64.9 and except for STSs 45 and 85.6 where the CRL7250 cell line showed a higher origin activity compared to MCF-10A, the position of the remaining half maximal peaks in these two cell lines overlapped. Moreover, the origin peak profile in these cell lines along the whole 78 kb region was very similar for all primer sets tested (Figure S2). These results suggest that the pattern of origin activation along this region of the genome is quite conserved in these two unrelated normal cell lines. When the half maximal peak profile of either of these cell lines was however compared to that of the MCF-7 cancer cell lines the results were dramatically different. Figure 4 indicates that while the majority of the half maximal peaks in MCF-10A occurred at the same locations in MCF-7 (seven out of nine peaks), an additional subset (made up of five peaks), was present only in the MCF-7 sample. This increase in the number of half maximal peaks was consistently found in independent MCF-7 preparations. More interestingly, an MCF-7 preparation which had been obtained following a 14hr release after estrogen deprivation (a time point at which cells appear to have entered into S, as judged by FACS analysis; see Valenzuela et al., 2011) also showed a similar profile as their unsynchronized populations (data not shown). To further investigate if this property of yielding a larger number of half maximal peaks is inherent in cancer cell lines, we repeated our assay with preparations obtained from MDA-MB-231 and BT-474 cell lines. The results shown in Figure 5 confirm that cancer cell lines present a larger number of peaks than their normal counterparts, the most apparent occurring in the MDA-MB-231 cancer cell line. The difference in the number of half maximal peaks among normal and cancer cell lines was shown to be statistical significant (p=0.029) as assessed by a two sample T-test (Figure 6).
Figure 3.

Correlation of the location of half maximal peaks among two independent nascent DNA preparations (filled and open bars) obtained from either MCF-7 cells (top panel), and MCF-10A (bottom panel) cells respectively.
Figure 4.

Comparison of the distribution and number of half maximal peaks along the 78 kb region in nascent DNA preparations obtained from breast cancer cell line MCF-7 (filled bars), and normal cell line MCF10-A (open bars).
Figure 5.
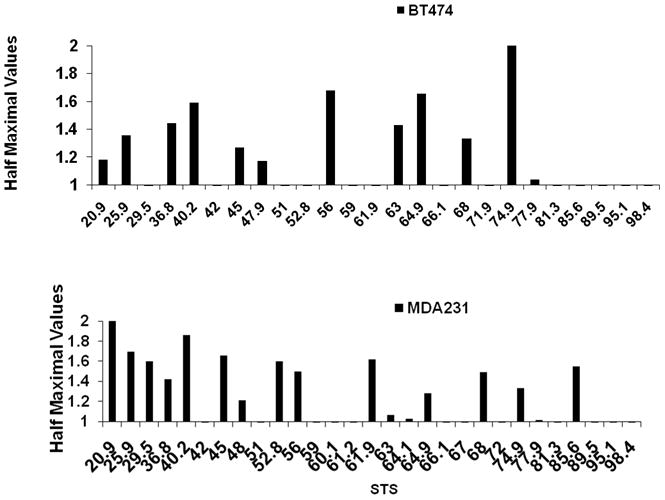
Distribution and number of half maximal peaks in nascent DNA preparations obtained from the breast cancer cell line BT-474 (top) and MDA-MB-231 (bottom).
Figure 6.

Statistical analysis of the overall distribution of half maximal peaks among nascent DNA preparations obtained from cancer and normal cell lines.
DISCUSSION
In this study we have used a real time PCR-based nascent DNA enrichment assay to investigate the activity of origins of DNA replication along a 78 kb region located on Chr2q34 harboring the Ribulose 5-phospahe 3- epimerase (RPE) gene. Preliminary data had suggested that the origin profile around this gene was different in HeLa cells compared to normal skin fibroblasts, NSF (Hu et al., 2004b). Our starting analysis utilizing closely spaced primer sets surrounding the most prominent peak of origin activity at RPE, showed that indeed the nascent DNA enrichment profile in NSF was more well defined than in HeLa cells (Fig. 1A & B) suggesting that more origins are activated in HeLa cells. It is possible however that the pattern shown in Figure 1B could be accounted by a different modality of fork migration occurring in HeLa cells compared to fibroblasts (i.e. more bidirectional origins in HeLa cells) as reported by Frum et al. in a single fiber analysis of human fibroblasts and glioblastoma T98G cells (Frum et al., 2009). This differential profile however persisted, as we extended the coverage of our analysis to the whole 78 kb region (Fig. 2A&B). To aid in the visualization in this different profile, we determined the number and location of origin peaks showing at least half of the maximal value observed in each preparation. Our results shown in Fig. 2D, indicated that while in Hela cells twenty two origin peaks corresponded to this category, only seven origin peaks met this criteria in NSF cells. This finding suggests that in HeLa cells, replication of the 78 kb DNA occurs as a result of a broader activation of origins. In contrast, in NSF cells, a more punctuated type of origin activation is present. There have been earlier reports that in SV40-transformed cells more origins of DNA replication are activated compared to their non-transformed counterparts (Martin and Oppenheim, 1977; Oppenheim and Martin, 1978), and that for some well defined origins of DNA replication (such as those associated with c-myc locus, and the autonomously replicating sequence NOA3) HeLa cells showed a higher activity compared to NSF cells (Tao et al., 1997). In view of these reports, we wished to investigate if the broader origin activation profile observed along the 78 kb regions in HeLa cells was also present in other cancer cell lines. We chose the breast cancer cell lines, MCF-7, MDA-MB-2321, and HBT-474, and the breast cell line MCF-10A as their normal counterpart. For comparative purposes, a tissue-unrelated normal cell line, CRL7250 was also analyzed.
Since copy number variations at the locations tested along the 78 kb region of Ch2q34 could arise from genetic instability (a hallmark in most cancer cells), even though we had purposely chosen a region containing a ‘housekeeping’ gene, we decided to investigate by aCGH the genomic profile around Chr2q34 in all our cell lines. Our results indicating that none of the cell lines presented any genome gains covering the Ch2q34 that may lead to an apparent enrichment of nascent DNA at this region, confirmed our expectations. Upon RT-PCR analysis of nascent DNA enrichment along the 78 kb region in both MCF-7 and MCF-10A cells, we found that the half maximal peak profile was highly reproducible in these two cell lines (11/14 in MCF-7 and 8/10 in MCF-10 half maximal peaks corresponded to the same location in two independent preparations (Figure 3). More interestingly, nascent DNA preparations from the two ‘normal’ cell lines MCF-10A and CRL7250 also showed a striking concordance of half maximal peaks (Figure S2). When comparing the distribution of half maximal peaks among MCF-7 and MCF-10A cell lines, it was very apparent that while most of the half maximal peaks in MCF-10 (eight out of ten) were also present in MCF-7, the overall number of peaks was significantly larger in MCF-7 (Figure 4). This same bias was observed in two other breast cancer cell lines, BT-474 and MDSA-MB-231 (Figure 5). The difference in the number of half maximal peaks between normal and cancer cell lines was found to be statistically significant (p=0.029) by a two sample T- test analysis (Figure 6).
The broader origin activation profile, and the concomitant larger number of origin peaks, in the cancer cell lines analyzed in this study could be indicative of a different replication program operating in these cells compared to normal ones. It has been well established that eukaryotic genomes contain a large excess of potential origins. Therefore it could be argued that in cancer cells more of these dormant origins get activated, generating the broad replication profiles we have observed. This view is supported by previous studies by Martin and Oppenheim, who by using pulse-labeling with 3H-thymidine and analyses of DNA fiber spreads, determined that the average replicon size in SV40-tranformed cells was significantly less than that of non-transformed cells (Martin and Oppenheim, 1977; Oppenheim and Martin, 1978). Additional support comes from a recent single fiber DNA study by Frum et al., where the sequential incorporation of fluorescent labeled nucleotides into replicating DNA was compared between normal human fibroblasts and glioblastoma T98G cells. Their results suggested that in T89G cells more origins of DNA replication were active during mid S phase of the cell cycle (Frum et al., 2009). Cellular transformation has also been shown to alter the regulation of ORC expression, leading to an increase both in the production of some of the ORC subunits, their association with chromatin (McNairn and Gilbert, 2005), as well as on the activity of some selected origins (Tao et al., 1997; DiPaola et al., 2006). Moreover, for one of these origins, found to be primarily active in transformed cells, electrophoretic mobility shift assays (EMSAs) revealed putative transformation-specific origin DNA protein complexes, containing proteins that were over-expressed, and bound to chromatin at a higher level in the transformed cells (DiPaola et al., 2010). All these findings could be interpreted as indicative of an altered DNA replication program in malignant cells leading to the activation of dormant, and perhaps, cancer-specific origins of DNA replication. Another possible scenario leading to the activation of dormant origins in cancer cells could be related to the mechanism(s) by which normal cells respond to replicative stress. It has been shown that the programming of origin selection could be modulated by factors that influence the rate of fork movement (Anglana et al., 2003; Ge et al., 1998; Courbet et al., 2008) or untimely initiation (Tanaka and Araki, 2011). It is therefore tempting to suggest that cancer cells may be more prone to respond to the signals that elicit the activation of dormant origins which in normal cells are utilized to safeguard the integrity of the genome only under conditions of replicative stress (Blow et al. 2011). Although the studies of Dimitrova and Berezney have shown that the spatio-temporal organization of replication patterns in normal and transformed cells is essentially the same (Dimitrova and Berezney, 2002) it is possible for subtle differences in origin activation such as a more flexible utilization of dormant origins in cancer cells to be present without affecting the global replication patterns described by these authors. Our results only suggest a more flexibility in the activation of origins of DNA replication in cancer cells compared to normal, rather to an absolute increase in origin usage in each cell. It is also important to point out that since our studies focused on a small region of Chr2q34, the results obtained for this region may not be a reflection of what happens in the rest of the genome. Clearly, genomic wide studies using high resolution DNA arrays, or high throughput DNA sequencing, in combination with parallel single fiber DNA studies, will provide us with a better understanding of the effect of malignant transformation on the regulation of origin activity in human cells.
Supplementary Material
Figure S1. Diagrammatic representation of the relative position of primer sets used to amplified selected regions (STSs) along a 78 kb region of the human chromosomes 2q34, encompassing the RPE gene
Figure S2. Correlation of the distribution and number of half maximal peaks in nascent DNA preparations obtained from, normal cell lines CRL7250 (filled bars), and MCF-10A (open bars).
Table S1. Primer sets used in this study to determine nascent DNA enrichment along a 78 kb region of human Chr2q34
Acknowledgments
Contract grant sponsor: NIH; Contract grant number: CA138180 (MSV)
Contract grant sponsor: NIH; Contract grant number: Intramural program (PSM)
We would like to thank S. Anderson, and M. Kirby, for assistance with the flow cytometry studies, and to Nicole Green and Yidong Chen for help with the figures. MSV wishes to thank the Health Disparities Visiting Faculty Program at the National Institute for Human Genome Research for support during the initial phase of this study. This research was funded in part by the intramural program of the National Institutes of Health (NIH), and by NIH grant CA138180 to MSV.
References
- Abdurashidova G, Deganuto M, Klima R, Riva S, Biamonti G, Giacca M, Falaschi A. Start sites of bidirectional DNA synthesis at the human lamin B2 origin. Science. 2000;287:2023–2026. doi: 10.1126/science.287.5460.2023. [DOI] [PubMed] [Google Scholar]
- Aladjem MI, Rodewald LW, Kolman JL, Wahl G. Genetic dissection of a mammalian replicator in the human beta-globin locus. Science. 1998;281:1005–1009. doi: 10.1126/science.281.5379.1005. [DOI] [PubMed] [Google Scholar]
- Anglana M, Apiou F, Bensimon A, Debatisse M. Dynamics of DNA replication in mammalian somatic cells: nucleotide pool modulates origin choice and inter-origin spacing. Cell. 2003;114:385–394. doi: 10.1016/s0092-8674(03)00569-5. [DOI] [PubMed] [Google Scholar]
- Blow JJ, Ge XQ, Jackson DA. How dormant origins promote complete genome replication. TIBS. 2011;36 doi: 10.1016/j.tibs.2011.05.002. [DOI] [PMC free article] [PubMed] [Google Scholar]
- Courbet S, Gay S, Arnoult N, Wronka G, Anglana M, Brison O, Debatisse M. Replication fork movement sets chromatin loop size and origin choice in mammalian cells. Nature. 2008;455:557–560. doi: 10.1038/nature07233. [DOI] [PubMed] [Google Scholar]
- DePamphilis ML. Eukaryotic DNA replication: anatomy of an origin. Annu Rev Biochem. 1993;62:29–63. doi: 10.1146/annurev.bi.62.070193.000333. [DOI] [PubMed] [Google Scholar]
- Dimitrova DS, Berezney R. The spatio-temporal organization of DNA replication sites is identical in primary, immortalized and transformed mammalian cells. J Cell Sci. 2002;115:4037–4051. doi: 10.1242/jcs.00087. [DOI] [PubMed] [Google Scholar]
- Di Paola D, Price GB, Zannis-Hadjopoulos M. Differentially active origins of DNA replication in tumor versus normal cell. Cancer Res. 2006;66:5094–5103. doi: 10.1158/0008-5472.CAN-05-3951. [DOI] [PubMed] [Google Scholar]
- Di Paola D, Rampakakis E, Chan MK, Arvanitis DN, Zannis-Hadjopoulos M. Increased origin activity in transformed versus normal cell: identification of novel protein players involved in DNA replication and cellular transformation. Nucleic Ac Res. 2010;38:2314–2331. doi: 10.1093/nar/gkp1192. [DOI] [PMC free article] [PubMed] [Google Scholar]
- Frum RA, Khonder ZS, Kaufman DG. Temporal differences in DNA replication during the S phase using single fiber analysis of normal human fibroblasts and glioblastoma T98G cells. Cell Cycle. 2009;8:3133–3148. doi: 10.4161/cc.8.19.9682. [DOI] [PMC free article] [PubMed] [Google Scholar]
- Ge XQ, Jackson DA, Blow JJ. Dormant origins licensed by excess Mcm2-7 are required for human cells to survive replicative stress. Genes Dev. 2007;21:3331–3341. doi: 10.1101/gad.457807. [DOI] [PMC free article] [PubMed] [Google Scholar]
- Gerbi SA, Bielinsky AK. Replication initiation point mapping. Methods. 1997;13:271–280. doi: 10.1006/meth.1997.0526. [DOI] [PubMed] [Google Scholar]
- Gilbert DM. Replication origin plasticity, Taylor-made: inhibition vs recruitment of origins under conditions of replicative stress. Chromosoma. 2007;116:341–347. doi: 10.1007/s00412-007-0105-9. [DOI] [PubMed] [Google Scholar]
- Hu L, Xu X, Valenzuela MS. Identification of novel initiation sites for human DNA replication around ARSH1, a previously characterized yeast replicator. Biochem Biophys Res Commun. 2004a;313:1058–1064. doi: 10.1016/j.bbrc.2003.12.040. [DOI] [PubMed] [Google Scholar]
- Hu L, Xu X, Valenzuela MS. Initiation sites for human DNA replication at a putative ribulose-5-phosphate 3-epimerase gene. Biochem Biophys Res Commun. 2004b;320:648–655. doi: 10.1016/j.bbrc.2004.06.018. [DOI] [PubMed] [Google Scholar]
- Martin RG, Oppenheim A. Initiation points for DNA replication in nontransformed and simian virus 40-transformed Chinese hamster lung cells. Cell. 1977;11:859–869. doi: 10.1016/0092-8674(77)90297-5. [DOI] [PubMed] [Google Scholar]
- McNairn AJ, Gilbert DM. Overexpression of ORC subunits and increased ORC-chromatin association in transformed mammalian cells. J Cell Biochem. 2005;96:879–887. doi: 10.1002/jcb.20609. [DOI] [PubMed] [Google Scholar]
- Mechali M. Eukaryotic DNA replication origins: many choices for appropriate answers. Nature Rev. 2010;11:728–738. doi: 10.1038/nrm2976. [DOI] [PubMed] [Google Scholar]
- Oppenheim A, Martin RG. Initiation points for DNA replication in nontransformed and simian virus 40-transformed BALB/c 3T3 cells. J Virol. 1978;25:450–452. doi: 10.1128/jvi.25.1.450-452.1978. [DOI] [PMC free article] [PubMed] [Google Scholar]
- Tanaka S, Araki H. Multiple regulatory mechanisms to inhibit untimely initiation of DNA replication are important for stable genomic maintenance. PLoS Genet. 2011;7(6):e1002136. doi: 10.1371/journal.pgen.1002136. [DOI] [PMC free article] [PubMed] [Google Scholar]
- Tao L, Nielsen T, Friedlander P, Zannis-Hadjopoulos M, Price G. Differential DNA replication origin activities in human normal skin fibroblast and HeLa cell lines. J Mol Biol. 1997;273:509–518. doi: 10.1006/jmbi.1997.1352. [DOI] [PubMed] [Google Scholar]
- Taylor JH, Adams AG, Kurek MP. Replication of DNA in mammalian chromosomes. II. Kinetics of 3H-thymidine incorporation and the isolation and partial characterization of labeled subunits at the growing point. Chromosoma. 1973;41:361–384. doi: 10.1007/BF00396495. [DOI] [PubMed] [Google Scholar]
- Taylor JH. Increase in DNA replication sites in cells held at the beginning of S phase. Chromosoma. 1977;62:291–300. doi: 10.1007/BF00327029. [DOI] [PubMed] [Google Scholar]
- Valenzuela MS, Chen Y, Davis S, Yang F, Walker RL, Bilke S, Lueders J, Martin MM, Aladjem MI, Massion PP, Meltzer PS. Preferential localization of human origins of DNA replication at the 5′-ends of expressed genes and at evolutionarily conserved DNA sequences. PLoS ONE. 2011;6(5):e17308. doi: 10.1371/journal.pone.0017308. [DOI] [PMC free article] [PubMed] [Google Scholar]
Associated Data
This section collects any data citations, data availability statements, or supplementary materials included in this article.
Supplementary Materials
Figure S1. Diagrammatic representation of the relative position of primer sets used to amplified selected regions (STSs) along a 78 kb region of the human chromosomes 2q34, encompassing the RPE gene
Figure S2. Correlation of the distribution and number of half maximal peaks in nascent DNA preparations obtained from, normal cell lines CRL7250 (filled bars), and MCF-10A (open bars).
Table S1. Primer sets used in this study to determine nascent DNA enrichment along a 78 kb region of human Chr2q34