Abstract
The malignant glioma is the most common primary human brain tumor, and its migration and invasiveness away from the primary tumor mass are considered a leading cause of tumor recurrence and treatment failure. Recently, gene expression profiling revealed that the transmembrane glycoprotein CD99 is more highly expressed in malignant glioma than in normal brain. Although its function is not completely understood, CD99 is implicated in cell adhesion and migration in a variety of different cell types. CD99 has wild-type and splice variant isoforms. Previous studies have shown that wild-type CD99 may be an oncosuppressor in some tumors, distinct from the role of the splice variant isoform. In this study, our data reveal that only wild-type CD99 is expressed in human glioma cells and tissues. Using a tissue microarray, we validated that gliomas demonstrate higher expression of CD99 compared with nonneoplastic brain. To assess the role of CD99 in glioma migration and invasion, we inhibited CD99 expression by siRNA and demonstrated decreased glioma migration and invasion. In contrast, when CD99 was overexpressed in glioma cells, we observed enhancement of cell migration and invasiveness. An orthotopic brain tumor model demonstrates that CD99 overexpression significantly increases invasiveness and decreases survival rate. Interestingly, Rac activity was decreased and Rho activity was increased in CD99 overexpressing glioma cells, and the proportion of amoeboid cells to mesenchymal cells was significantly increased. Taken together, our findings suggest that CD99 may play an important role in the migration and invasion of human gliomas independent of Akt, ERK, or JNK signaling pathways. Moreover, CD99 might be involved in amoeboid-mesenchymal transition in glioma migration. CD99 may be an important future target to inhibit migration and invasion, especially in CD99-expressing gliomas.
Keywords: CD99, glioma, migration, invasion, mesenchymal, amoeboid
Introduction
Malignant gliomas are the most common primary brain tumors in adults1 and are among the most aggressive malignant tumors in part because of their propensity to disseminate diffusely throughout the brain.2 Therefore, to improve our ability to treat patients with malignant gliomas, we must increase our understanding of the migratory and invasive properties of these tumors.
To migrate, glioma cells must acquire a special asymmetric, and polarized phenotype. This enables them to transform intracellular forces into net cell body translocation.3 Typically, a migrating glioma cell remodels its cytoskeleton and forms protrusions and focal adhesions at the leading edge of the migratory front. This generates contractile forces and traction, allowing the cell body to move forward. Recent studies have demonstrated that individual cells of certain cancers, such as melanoma, have 2 different interchangeable modes of movement: a mesenchymal mode driven by Rac GTPase activation and an amoeboid mode driven by Rho GTPase activation.4-6 Therefore, the ability of tumor cells to switch between different modes of migration might limit the effectiveness of single therapeutic agents targeting migration and invasion of cancer cells.
Invasion is a complex cellular phenomenon that involves cell-to-cell and cell-to-extracellular matrix (ECM) interactions, enzymatic degradation of the ECM, and cell migration.7 Cell movement involves the coordination of multiple signaling pathways that regulate cell-substratum adhesion and actin cytoskeletal dynamics.8
Therefore, numerous potential targets for migration and invasion in gliomas have been reported. Recently, through a gene-expression array study for possible immunotherapeutic targets of gliomas, 31 novel potential membranous proteins were revealed.9 One of these was CD99, whose expression was 4.8-fold higher than in normal brain. In addition, CD99 expression level directly correlated with advancing grade of glial tumors.
CD99, a cell surface glycoprotein with a molecular mass of 32 kDa, was originally described as a human thymus leukemia antigen,10 a Ewing sarcoma-specific membrane marker molecule,11,12 and an adhesion molecule involved in spontaneous rosette formation of T cells with erythrocytes.13 CD99 is distributed on many cell types, with particularly strong expression on human cortical thymocytes, Ewing sarcoma, ependymoma, and peripheral primitive neuroectodermal tumors.12,14 Although the functional role of CD99 is not fully understood, in normal cells CD99 has been associated with cell adhesion, migration, apoptosis, differentiation, activation, and proliferation of lymphocytes and extravasation.15 In pathological conditions, the role of CD99 has not been completely elucidated. Expression of CD99 resulted in the induction of cell-cell adhesion and apoptosis16 and the inhibition of anchorage-independent growth, anoikis resistance, migration, and metastasis in Ewing sarcoma.17 Similar results were also reported in osteosarcoma.18 Contrary to this, others have reported that high expression of CD99 contributed to the malignant properties of sarcomas by promoting growth and migration.19
CD99 encodes 2 distinct proteins by alternative splicing of the CD99 gene transcript.20 Compared with the wild-type full-length form (CD99wt), the minor splicing variant (CD99sh) of molecular weight 28 kDa has a shortened intracytoplasmic fragment.15 Several papers suggest that the CD99sh favors oncogenesis, including anchorage-independent growth, anoikis resistance, migration, and invasion, whereas the CD99wt inhibits these phenomena in a few sarcomas.15,17 To the best of our knowledge, there are no published reports showing the expression and functional significance of CD99 in human gliomas. Accordingly, in the present study, we have examined the role played by CD99 in human glioma cells.
Results
CD99 expression in glioma cell lines and glioblastoma tissue samples
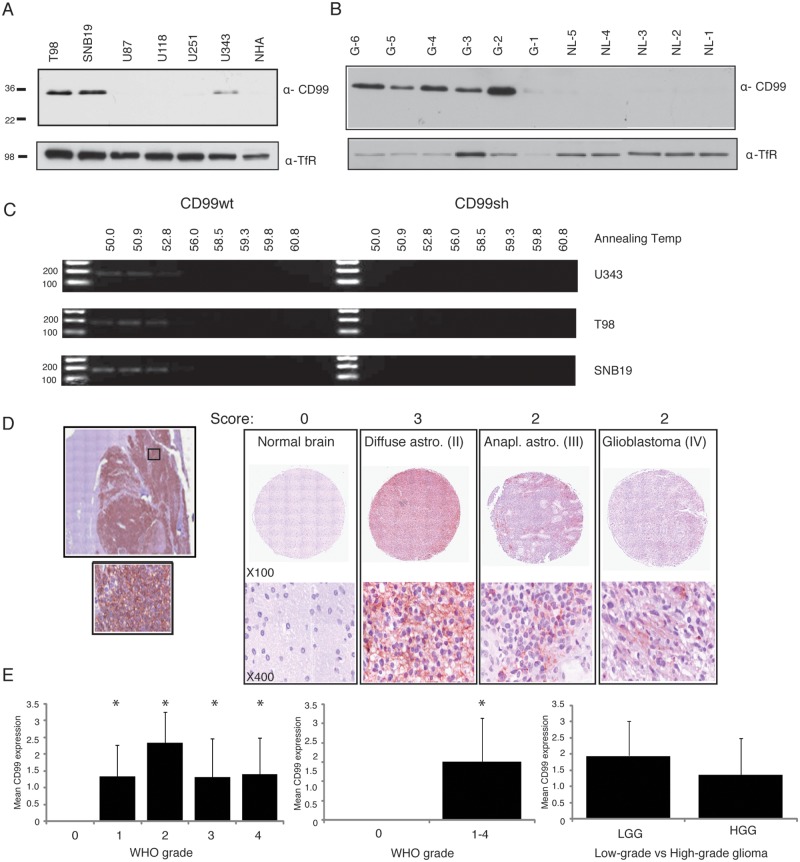
Western blot was performed on the different glioma cell lines, including U343, U251, U118, U87, SNB19, and T98, as well as on normal human astrocytes (NHAs). T98, SNB19, and U343 glioma cell lines expressed CD99 (Fig. 1A), whereas NHAs, U251, U118 and U87 did not. From these results, we selected U87 for CD99 overexpression experiments because it expressed almost no CD99; we selected T98 and SNB19 glioma cells for gene silencing because these 2 cell lines demonstrated high levels of CD99 expression. Five of 6 glioblastoma tissue samples showed high expression of CD99, whereas all 5 nonneoplastic brain specimens did not express this protein (Fig. 1B). To determine whether either of CD99 isoforms was expressed, we used 12% SDS-PAGE as previously described15,17; however, only CD99wt was expressed in the cell lines and tissues.
Figure 1.
Western blots show variable amounts of CD99 expression in different glioma cell lines, and NHA does not show the expression of CD99 (A). Five of 6 glioblastoma tissue samples show relatively high expression of CD99, whereas all the 5 normal brains do not express this protein (B). The gradient RT-PCR analysis in different annealing temperature shows that only CD99wt was expressed (C). The representative tissue microarray images (TMA) from normal or varying grades of glioma tissue are shown (D). Quantification of tissue microarray demonstrates significant increase of CD99 in tumor compared with normal brain (E). TfR - Transferrin Receptor (loading control).
On the basis of the Western blot results for glioma cell lines, U343, T98, and SNB19 were selected for gradient RT-PCR analysis at different annealing temperatures using 2 sets of primers that are specific for the CD99 isoforms. Consistent with the Western blot experiment, only CD99wt was expressed in these cell lines (Fig. 1C).
CD99 immunohistochemical detection using tissue microarray analysis
The comparison of CD99 expression in different grades of glioma revealed higher levels of expression in all grades of glioma compared with nonneoplastic brain (P = 0.004). In addition, Fig. 1D shows a representative tissue microarray result in which the tumors and a nonneoplastic brain are scored. Quantification and statistical analysis demonstrate that CD99 expression is higher in tumor versus normal but is not significant between grades of glioma tumors (Fig. 1E) (P < 0.05).
CD99 localizes mainly to membrane of dynamic cells as well as motile cells
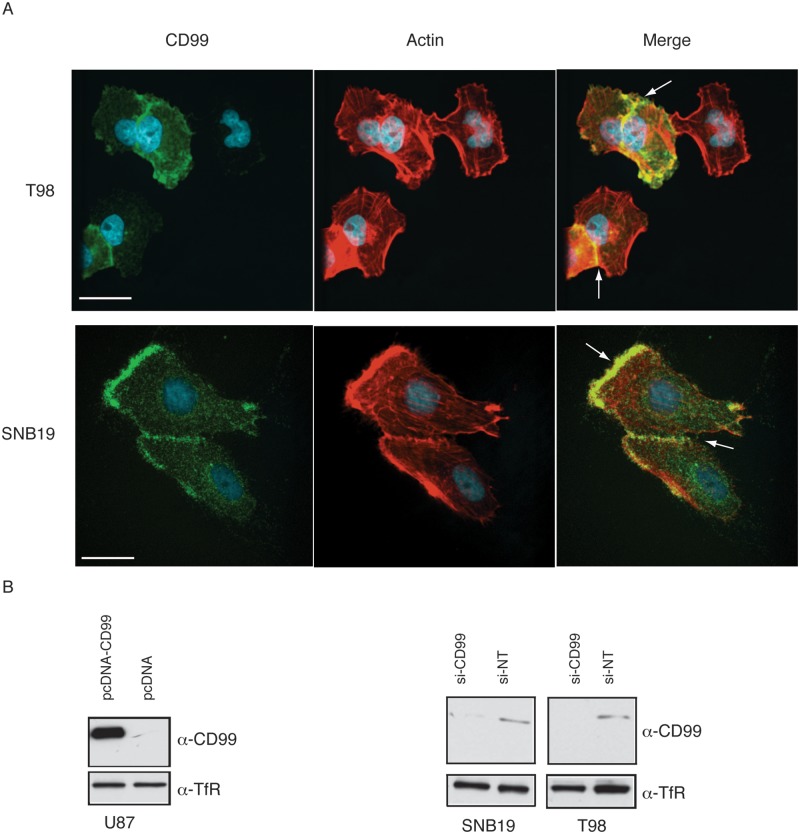
CD99 was expressed in both the membrane and the cytoplasm of glioma cells. In T98 and SNB19 cell lines, the leading edge of the cells or regions demonstrating cell-to-cell-contact showed enhanced expression of CD99 (Fig. 2A).
Figure 2.
Immunofluorescence shows that CD99 localizes mainly to membrane. In T98 and SNB19 cell lines, the leading edge or cell-to-cell-interacting membrane shows strong expression (A). Expression of CD99wt in the resultant stable transfectant clone of U87 cells was confirmed using Western blot. Stable control cell lines were also produced by the pcDNA3.1- empty vector and EGFP-pcDNA3.1- construct (B, left panel). CD99 knockdown with the CD99 siRNA quadriplex shows effects within 48 hours after siRNA transfection (B, right panel). Nontargeting siRNA (NT-siRNA) was used as a negative control.
Expression of CD99wt in stable transfectants of U87 cells was confirmed using Western blot analysis (Fig. 2B, left panel). CD99 knockdown with the CD99 siRNA quadriplex could be demonstrated within 48 hours after siRNA transfection with nontargeting siRNA (NT-siRNA) used as a negative control. (Fig. 2B, right panel) and reached maximum effects at 72 hours after transfection (data not shown).
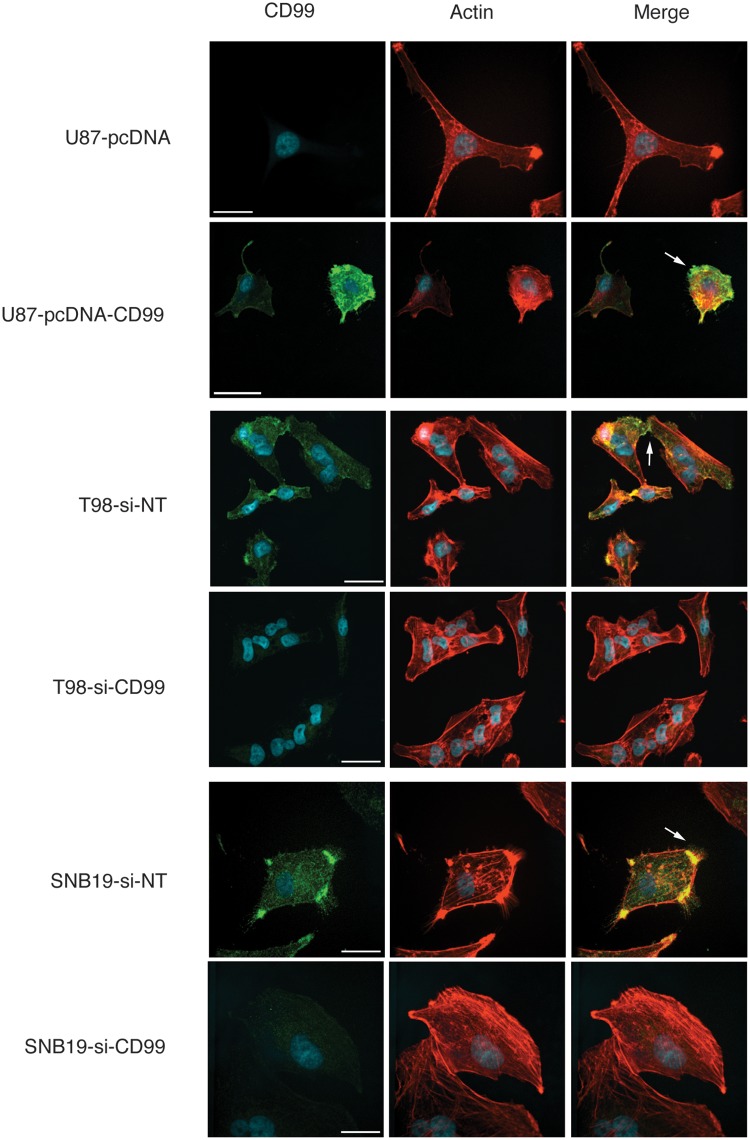
Immunofluorescence was used to examine the effects of CD99 modulation. CD99 localized to the periphery in the cell membrane, especially processes between glioma cells. In the nontargeting siRNA-transfected T98, SNB19, and stable CD99-pcDNA3.1-expressing cells, CD99 was localized to the filopodia (Fig. 3). Interestingly, there was a decrease in the formation of filopodia and cell processes with predominantly flattened polygonal shaped cells in the CD99-depleted glioma cells.
Figure 3.
Immunofluorescence shows that CD99 localizes to peripheral membrane, especially the connecting process between the cells or the filopodia in the nontargeting siRNA-transfected T98, SNB19, and stable CD99-pcDNA3.1-expressing cells. In contrast to these, the formation of filopodia and membrane processes are decreased, resulting in the polygonal appearance in CD99-depleted glioma cells.
Alterations in CD99 expression levels do not significantly alter glioma cell viability, anchorage-independent growth, or resistance to anoikis
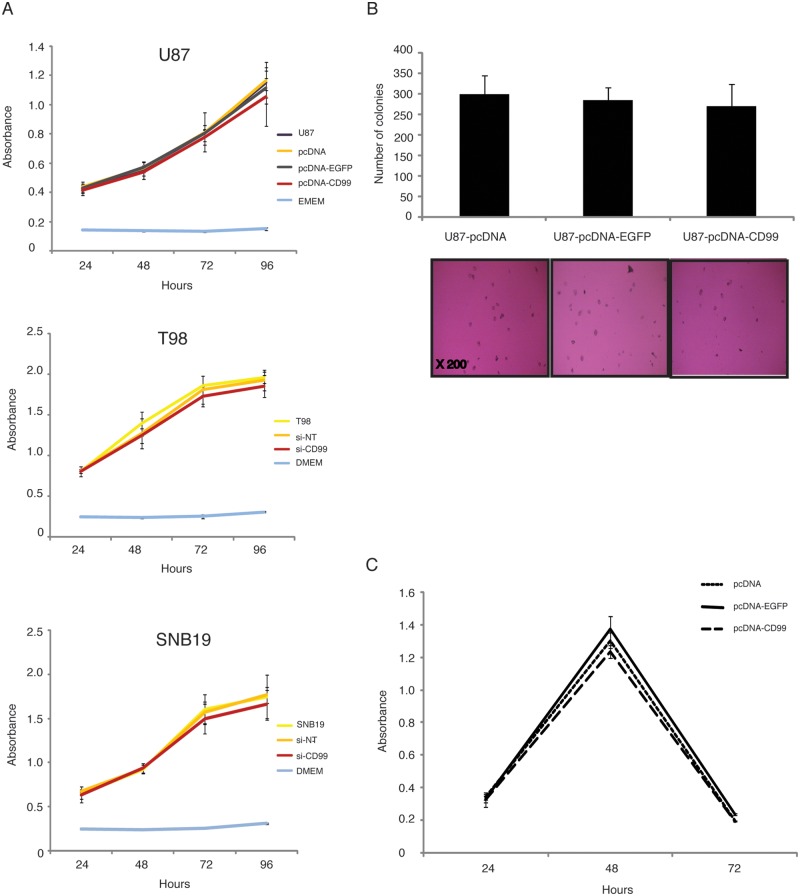
To determine the effect of stable CD99 expression on cell proliferation, an MTS assay was performed using U87 cells transfected with a CD99 expression vector construct, EGFP, or empty vector controls. In addition, T98 and SNB19 cells transfected with nontargeting siRNA (si-NT) or siRNA-CD99 were also investigated. As shown in Figure 4A, no significant differences were observed between the samples.
Figure 4.
There are no remarkable differences among the samples in MTS assays (A), colony formation assay in soft agar (B), and Anoikis assay (C).
To assess the effect of stable CD99 expression on the ability of glioma cells to grow in anchorage- independent conditions, we tested colony formation in soft agar using the stably transfected U87 cell line (Fig. 4B). The empty vector control produced a mean number of 300 ± 46.4 colonies. The EGFP control and the U87-CD99-pcDNA3.1- cells produced 285 ± 30.6 and 270 ± 55.3, respectively. No significant differences in anchorage-independent growth were observed in this assay.
In addition, to evaluate the resistance to anoikis of the stably-transfected cells, an anoikis assay was performed (Fig. 4C). The peak time to resistance was 48 hours in CD-99 transfected U87 cells, and no significant difference was observed among the EGFP and empty vector control cell lines (P > 0.05).
Modulation of CD99 expression alters glioma cell adhesion to ECM
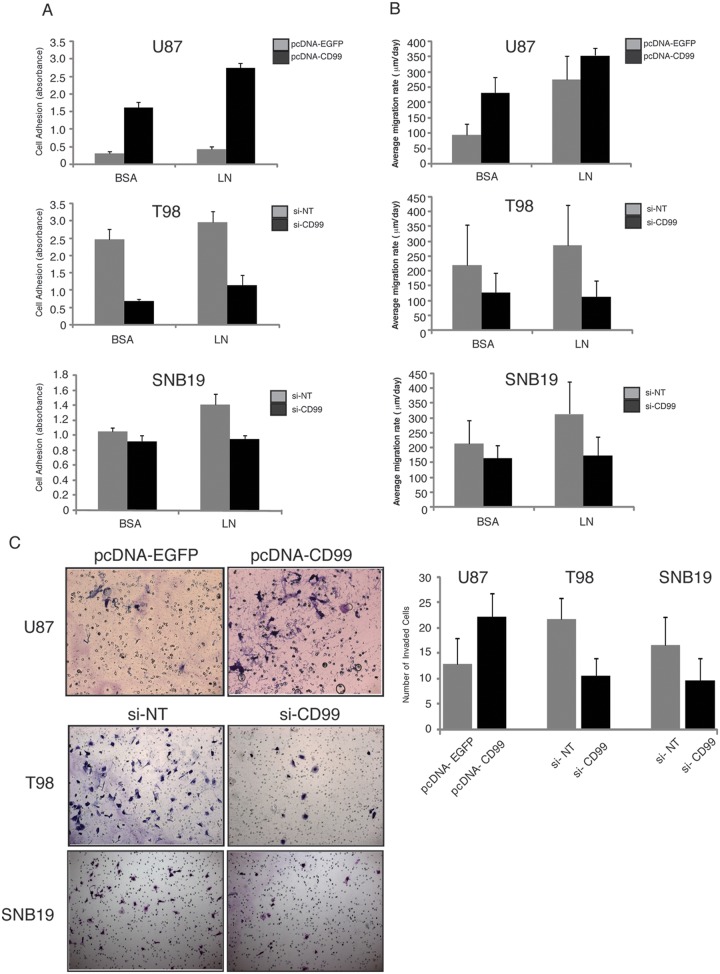
Overexpression of CD99 increased the adherence of U87 glioma cells to BCA and laminin (P = 0.0001 and 0.00002, respectively). In contrast, CD99 knockdown strongly inhibited glioma cells from adhering to the ECM substrate (Fig. 5A). In T98 glioma cells treated with CD99 siRNA, there was significantly decreased adhesion to laminin (BSA, P = 0.06; and laminin, P = 0.008). In SNB19 glioma cells treated with CD99 siRNA, adhesion was significantly reduced on BSA and laminin (BSA, P = 0.015; and laminin, P = 0.009).
Figure 5.
The adherence of U87 glioma cells to BCA and laminin is potentiated by the overexpression of CD99 (P = 0.0001 and 0.00002, respectively). In contrast, CD99 knockdown strongly inhibits glioma cells from adhering to the ECM substrate. In T98 glioma cells treated with CD99 siRNA, the adhesion to laminin is significantly decreased (laminin, P = 0.008). In SNB19 glioma cells treated with CD99 siRNA, the adhesion is significantly reduced on laminin (laminin, P = 0.009) (A). The radial migration assays with the same ECM macromolecules as in the attachment assays show similar results to those of the attachment assay (B). In U87 glioma cells that overexpress CD99, invasiveness increases (P = 0.0005). In T98 and SNB19 glioma cells in which CD99 is knocked down, invasiveness decreases (P = 0.000004 and 0.002, respectively) (C).
CD99 expression alters glioma migration
To investigate whether CD99 plays a role in the migratory process of human glioma cells, we used radial migration assays with the same ECM macromolecules as in the attachment assays described above. In stably CD99-transfected U87 glioma cells, the rate of migration was increased on both BSA and laminin (P = 0.0001 and P = 0.034, respectively), compared with stably EGFP-transfected U87 glioma cells (Fig. 5B). In CD99-siRNA-treated T98 glioma cells, the migration rate was decreased on laminin but not BSA (BSA, P = 0.06; laminin, P = 0.008). Similarly, in SNB19 glioma cells, CD99 knockdown decreased the migration rate on laminin, but not BSA (BSA, P = 0.15; laminin, P = 0.009) (Fig. 5B).
CD99 expression alters glioma invasiveness
In U87 glioma cells that overexpressed CD99, invasiveness increased through Matrigel over controls (P = 0.0005) (Fig. 5C). In T98 glioma cells in which CD99 was knocked down, invasiveness was significantly decreased (P = 0.000004). Similarly, in SNB19 in which CD99 was knocked down, invasiveness was decreased (P = 0.002) (Fig. 5C).
Orthotopic intracranial xenografts of stably transfected U87 cell lines
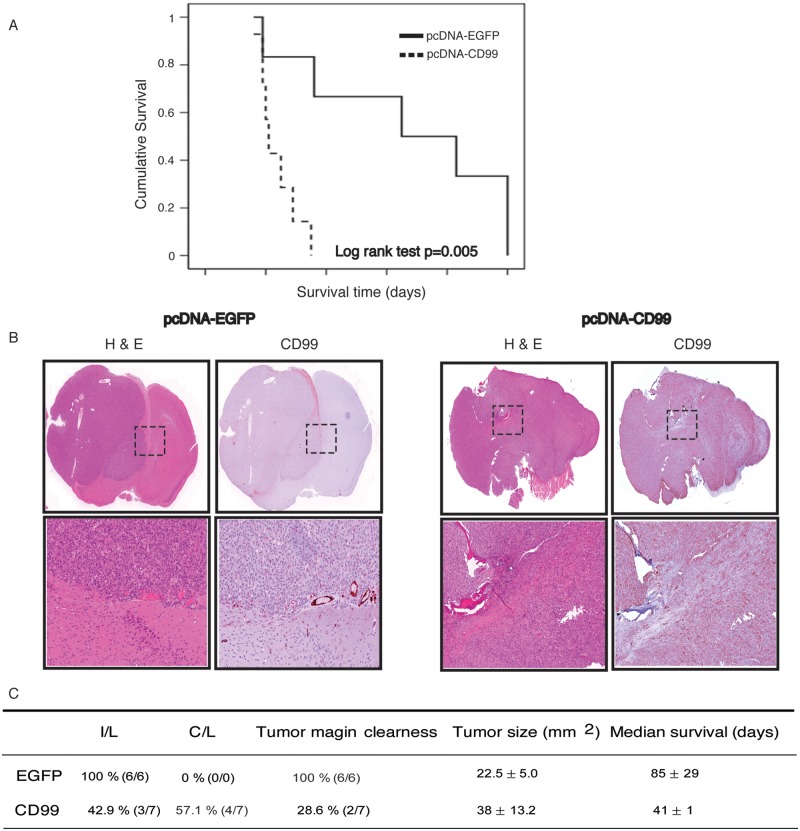
Mice harboring intracerebral xenografts derived from U87 cells stably transfected with EGFP exhibited a mean overall survival (OS) after initial tumor engrafting of 85 days. In contrast, mice with xenografts derived from the U87-CD99 overexpressing clone showed a mean OS of 41 days. The difference in mean OS was significant (P = 0.005) (Fig. 6A). By light microscopy, all the EGFP-expressing xenografts (6/6) showed well-demarcated margins of tumor and an ipsilateral tumor location. In contrast to this, 5 of 7 mice with xenografts overexpressing CD99 exhibited indistinct tumor margins (Fig. 6B). Interestingly, 57.1% (4/7) of mice with tumors overexpressing CD99 demonstrated contralateral hemispheric involvement. Although mean tumor size between controls and CD99 overexpressing tumors was not significantly different, the actual measurement of tumor size in the CD99 overexpressing xenografts was more problematic given the infiltrative pattern of tumor involvement. These data are summarized in Fig. 6C.
Figure 6.
The overall survival is longer in mice harboring intracerebral xenografts derived from the U87 cells stably transfected with EGFP (85 days after initial tumor engrafting) than in mice with xenografts derived from the U87-CD99 clone (41 days) (P = 0.005) (A). Microscopically, all of the EGFP control xenografts show well-demarcated margin of tumor. In contrast to this, only 28.6% of CD99 xenografts exhibited clear tumor margins (B). In addition, all of the EGFP mice show ipsilateral involvedness of tumor, whereas 57.1% of CD99 mice revealed contralateral involvement (C).
Mass spectrometry identifies multiple cytoplasmic CD99-interacting proteins
We performed mass spectrometry to identify cytoplasmic interacting proteins within the cytoplasmic fraction of CD99wt overexpressing U87 protein lysates immunoprecipitated with CD99 antibody. The candidate list of putative CD99 cytoplasmic interacting partners is shown in Table 1. Putative interacting proteins were more frequently identified in CD99 immunoprecipitations than in the IgG control. Of the identified proteins, capain-1 is interesting given its role in cytoskeleton remodeling and may shed light on a potential mechanism of action of CD99 signaling in glioma cells.
Table 1.
Candidate CD99 Interacting Proteins Identified by Mass Spectrometry
| Identified Proteins | CD99 IP | IgG IP |
|---|---|---|
| Isoform 1 of CD99 antigen | 6 | 1 |
| Annexin A1 | 21 | 12 |
| 14-3-3 protein zeta/delta | 13 | 8 |
| L-lactate dehydrogenase β chain | 10 | 6 |
| IGL@ protein | 3 | 0 |
| 29kDa protein | 8 | 4 |
| Cathepsin D | 3 | 0 |
| Capain-1 catalytic subunit | 4 | 0 |
| Collagen alpha-1 chain | 3 | 0 |
Mass spectrometry (LC-MS/MS using LC system) was performed to identify cytoplasmic interacting proteins on the cytoplasmic fraction of CD99wt overexpressing U87 protein lysates immunoprecipitated with CD99 antibody. The candidate list of putative CD99 cytoplasmic interacting partners is shown.
Akt, ERK, and JNK do not participate in CD99 signaling pathway
To investigate the functional role of CD99 in gliomagenesis, we examined the involvement of kinases previously identified as important in CD99 signaling. We assessed the roles of Akt, ERK, and JNK following EGF stimulation of CD99 overexpressing cells. In this study, the expression of Akt, phospho-Akt, ERK, phospho-ERK, JNK, and phosphor-JNK was not increased in stably CD99-transfected cells when compared with control cells (Suppl. Fig. 1), suggesting that Akt, ERK, and JNK are not significantly involved in CD99 signaling in glioma cells.
Rac activity decreases and Rho activity increases in CD99 overexpressing cells
Rac activity was assessed in stably CD99-transfected U87 glioma cells and was found to be decreased compared with that of stably EGFP-transfected U87 glioma cells and wild-type U87 glioma cells. In contrast, Rho activity of stably CD99-transfected U87 glioma cells was found to be increased compared with controls (Fig. 7).
Figure 7.
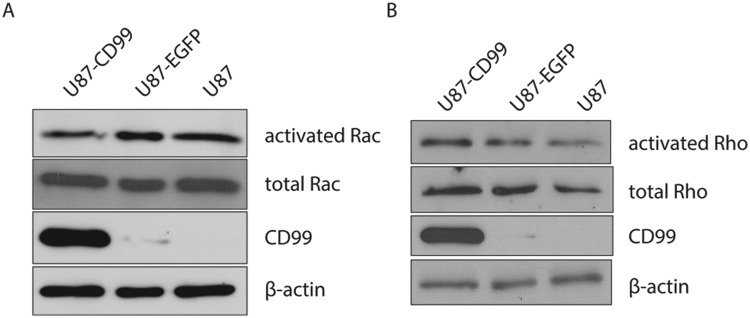
The Rac activity of stably CD99-transfected U87 glioma cells decreases compared with that of stably EGFP-transfected U87 glioma cells and wild-type U87 glioma cells (left panel). In contrast, the Rho activity of stably CD99-transfected U87 glioma cells increases (right panel).
CD99 overexpressing cells form amoeboid cells in 3D collagen culture
To assess cellular morphology and 3-dimensional growth patterns of glioma cells following CD99 transfection, we used a type I collagen matrix assay. Immunofluorescence of the actin cytoskeleton for CD99 overexpressing cells showed a preponderance of amoeboid cells. The proportion of amoeboid-type cells to mesenchymal-type cells was significantly higher in stably CD99-transfected U87 cells than in U87-EGFP-pcDNA3.1-stable cells, U87-pcDNA3.1-stable cells, and wild-type U87 cells (P = 0.001) (Fig. 8).
Figure 8.
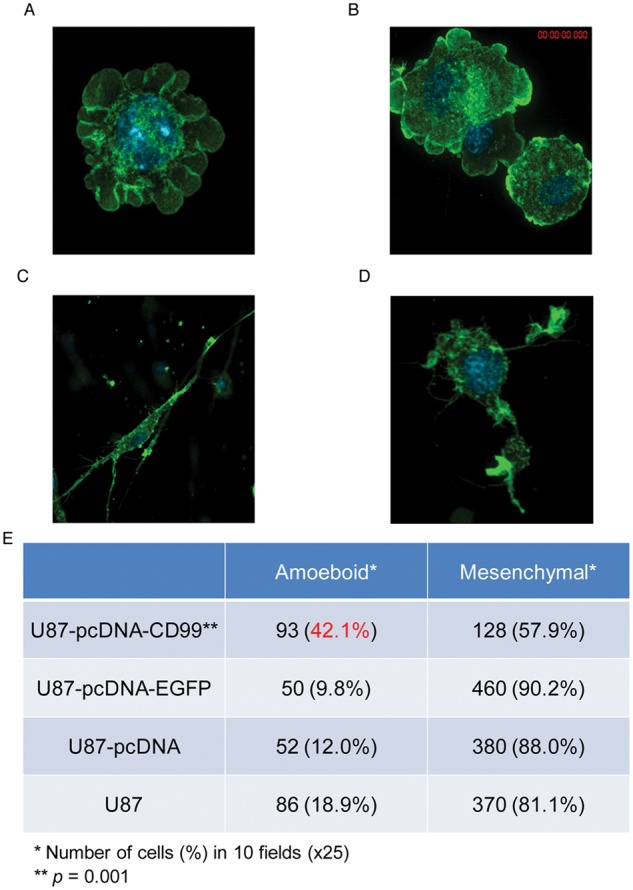
To check the cellular morphology and growth pattern in 3-dimensional spaces, 3D culture using type I collagen matrix was used. The proportion of amoeboid-type cells (A and B) to mesenchymal-type cells (C and D) was significantly higher in stably CD99-transfected U87 cells than in control cells (E, P = 0.001).
Discussion
In this study, we examined the biological role of CD99 in human malignant gliomas. We show that CD99 overexpression was associated with morphological alterations of glioma cells, increased motility and invasion, and increased adhesiveness. In addition, Rac activity was decreased, and Rho activity increased following CD99 overexpression, suggesting a potential mechanism by which CD99 influences the actin cytoskeleton. Elimination of CD99 expression by siRNA led to the opposite effects predominantly.
The role of CD99 in many tumors is still controversial. High CD99 expression has been shown in Ewing sarcoma, acute lymphoblastic lymphoma, synovial sarcoma, mesenchymal chondrosarcoma, and rhabdomyosarcoma.11,12,21-24 A significant relationship between CD99-positive cells and the occurrence of local invasion and/or distant metastasis has been found in gastrointestinal and pulmonary neuroendocrine tumors.25 However, low expression of CD99 has also been associated with the development of pancreatic and gastric cancers.26,27 A recent report also showed that down-regulation of CD99 is associated with the metastatic phenotype of osteosarcoma.18 Meanwhile, in breast invasive carcinomas, no significant association was found between CD99 immunoreactivity and the metastatic stages of the tumors.28 This discrepancy may be due not only to the difference in cancer types but also to the difference in the relative expression levels of the 2 CD99 isoforms.
Differential expression of alternative splice variants has been known to occur on both physiological and pathological bases. CD99 isoforms have been found to be differentially expressed in various human tumor cell lines and normal tissues.15 The general concept is that both isoforms exhibit different functions in malignancy. CD99sh was originally reported as an inhibitor for homotypic cell adhesion of lymphocytes, whereas CD99wt acted as an inducer for cell adhesion.20 Previous studies have suggested that CD99wt is a potent oncosuppressor in osteosarcoma, because CD99-forced expression reduced resistance to anoikis and inhibited growth in soft agar as well as migration.18 In contrast, our studies showed that CD99wt-overexpressing glioma cells have similar ability of survival and progression compared with nonexpressing glioma cells. Furthermore, our in vivo data revealed that mice harboring xenografts overexpressing CD99 had a decreased survival rate and higher invasive profiles than did controls.
In tumors expressing CD99sh or CD99wt, it has been shown that CD99 signaling cascades include the JunD-FosB complex, which enhances the transcription of AP-1-responsive genes, such as MMP-9 and cell motility-stimulating genes.15 Moreover, it was also reported that CD99 expression results in positive cross-talk between the epidermal growth factor receptor and Akt pathways, causing increased expression of JunD and FosB along with increased AP-1 activity. Interestingly, our data demonstrated that Akt, ERK, and JNK were not activated in CD99 overexpressing human glioma cells, perhaps because only CD99wt was expressed, and not CD99sh. In efforts to understand more completely what signaling pathways may be operational in CD99 overexpressing glioma cells, we performed mass spectrometry to identify cytoplasmic interacting peptides, and we found some putative interactions worthy of further investigation, such as capain-1. MMP-9 was increased, however, in keeping with previous studies showing its activation following CD99 up-regulation (data not shown).
Recently, 2 different migratory modes have been reported in certain types of cancer cells such as melanoma.5,6 One is mesenchymal migration, which is characterized by an elongated morphology that requires extracellular proteolysis localized at cellular protrusions and is driven by activation of Rac. The other is amoeboid migration, which is characterized by round cells with no obvious polarity that is independent of proteases and is driven by activation of Rho.29 These 2 migratory modes are interconvertible, depending on environmental conditions. In our study, Rac activity was decreased and Rho activity was increased in stably CD99-transfected glioma cells, which enhanced migration and invasiveness of human malignant glioma cells. Moreover, the ratio of amoeboid cells to mesenchymal cells was much higher in CD99 overexpressing glioma cells compared with control cells, further confirming a Rho-activated cell migratory phenotype and suggesting a potential mechanism by which CD99 may be associated with increased cellular migration. From our mass spectrometry analysis, potential CD99 interactors Capain1 and the 14-3-3 chaperone proteins may represent a potential mechanism as to how CD99 regulates Rac and Rho activation, as these proteins have been previously shown to influence Rac and Rho activity.30,31 Although the majority of the literature indicates that CDC42 and Rac are critical regulators of filipodia formation, there is evidence to suggest alternative mechanisms of filopodia activation through RhoA regulation, as demonstrated in this study and previous groups.32,33 Although beyond the scope of this study, genome-wide profiling of CD99 positive versus negative cells would be of interest to interrogate further mechanisms by which CD99 promotes these invasive phenotypes in glioblastoma.
In summary, we have demonstrated for the first time expression and activation of CD99wt enhance the migration and invasive ability of human glioma cells. CD99 may play a role in in amoeboid-mesenchymal transition in glioma migration. Our findings suggest that CD99 could be an important target for tumor migration and invasion in those gliomas, which express CD99 and show enhanced invasiveness.
Materials and Methods
Cell lines, cell culture, and tissue samples of glioblastoma and normal brain
The permanent, well-characterized U343, U251, U118, SNB19, and T98 human glioma cell lines were maintained in Dulbecco’s modified eagle’s medium (DMEM) with 10% fetal bovine serum (FBS) (HyClone Laboratories, Inc., Logan, Utah). The U87 cell line was maintained in minimum essential medium (MEM) supplemented with 10% FBS. Normal human astrocytes (NHAs) were maintained in ABM media containing 3% FBS 0.1% ascorbic acid, 0.5% recombinant human epidermal growth factor, 0.1% GA-1000, 0.25% insulin, and 1% L-glutamine (Clonetics, East Rutherford, New Jersey). Cells were cultured in a 37°C, 5% CO2 humidified chamber. Tissue samples of 6 glioblastoma and 5 normal brain samples were provided from the brain tumor bank of the Toronto Western Hospital/Labatt Brain Tumor Research Centre with Research Ethics Board approval.
Western blot analysis
Cell lysates were prepared by scraping 90% confluent 10-cm dishes into 1 mL of lysis buffer (50 mM HEPES, pH 7.5, 150 mM NaCl, 1.5 mM MgCl2, 1% Triton X-100, 10% glycerol, and protease inhibitors; Roche Molecular Biochemicals, Laval, Quebec). Tissue samples were homogenized with cell lysis buffer. They were then centrifuged at 14,000 rpm to pellet the insoluble material. The protein concentrations of the cell lysates were determined using the MicroBCA kit (Pierce Biotechnology, Rockford, Illinois) according to the manufacturer’s directions. Twelve percent SDS-PAGE was used to separate 2 isoform proteins. Proteins were transferred onto PVDF membrane (Immobilon-P, Millipore, Billerica, Massachusetts) and immunoblotted with primary antibodies overnight at 4°C. For CD99 immunoblotting, mouse monoclonal anti-MIC2 (CD99) antibody (1:1000; Santa Cruz Biotechnology, Santa Cruz, California) was used. As a loading control on the same blot, a mouse monoclonal antibody against the human transferrin receptor (1:1000; Zymed Laboratories, South San Francisco, California) was used.
Bound antibodies were visualized using horseradish peroxidase (HRP)-conjugated goat anti-mouse IgG (Bio-Rad Laboratories, Hercules, California) and analyzed using Western blot Luminol Reagent (PerkinElmer Life and Analytical Sciences, Waltham, Massachusetts).
Reverse-transcription PCR
Total cellular RNA was purified from the cultured cells using Trizol reagent (Invitrogen, Carlsbad, California). cDNA was prepared using 1 µg of total RNA, random hexamer primers, and the Omniscript RT kit (Qiagen, Valencia, California). Gradient (in different annealing temperatures) reverse transcription-PCR (RT-PCR) was performed using Platinum Tag DNA Polymerase (Invitrogen) in an MJ Research PTC-200 thermal cycler (Bio-Rad Laboratories). To detect both CD99wt and CD99sh isoforms, the following primers were used (all 5′-3′)17: forward GTGATCCCCGGGATTGTG; CD99wt reverse CTATTTCTCTAAAAGAGTACG; CD99sh reverse CCTAGGTCTTCAGCCATG. The sizes of the expected PCR products were 180 bp for CD99wt and 117 bp for CD99sh.
Tissue microarray and immunohistochemistry
Immunohistochemical staining was done using the commercially available brain tumor tissue microarray GL803 (US Biomax, Inc., Rockville, Maryland), which consists of 55 astrocytic tumor specimens and 5 normal brain specimens. The patient population included 22 male and 33 female tumor specimens, with a mean patient age of 41.7 years (range, 4-68), and 3 male and 2 female normal control specimens, with a mean patient age of 45.8 years (range, 30-52). Of the astrocytic tumor specimens, 6 were Grade I, 9 were Grade II, 25 were Grade III, and 15 were Grade IV. Tumor grade data were provided by US Biomax, Inc., and were determined according to the 2007 WHO grading system.
The tissues were deparaffinized, endogenous peroxide was blocked using 3% hydrogen peroxide in methanol, and microwave antigen retrieval was done using Antigen Unmasking Solution (Vector Laboratories, Inc., Burlingame, California). Blocking was done using 10% normal horse serum, and endogenous biotin was blocked using an avidin/biotin kit (Vector Laboratories). The tissue and tumor sections were incubated with a mouse monoclonal anti-CD99 antibody (1:500; Santa Cruz Biotechnology), followed by a biotinylated secondary antibody (Vector Laboratories) for 30 minutes and then a HRP-conjugated ultrastreptavidin labeling reagent (ID Labs Biotechnology, Inc., London, Ontario) for 30 minutes. After thorough rinsing in PBS, color development was performed using freshly prepared NovaRED solution (Vector Laboratories). Finally, sections were counterstained lightly with Meyer’s hematoxylin, dehydrated in alcohols, cleared in xylene, and mounted in Permount (Fisher Scientific, Ottawa, Ontario).
CD99 expression was then evaluated. Results of immunostaining were graded semiquantitatively from 0 to 3 using the following ranges; Grade 0, 0%; Grade I, 1–30%; Grade II, 31–70%; and Grade III, ≥71% positive tumor cells. Sections of Ewing sarcoma sample were used for positive control of immunoreactivity.
CD99 expression construct and stably overexpressing cell line
A plasmid containing full-length human CD99wt cDNA was obtained from the Mammalian Gene Collection (CD99-IRAU48-F10 in pOTB7). This cDNA was subcloned into the pcDNA3.1-expression vector (Invitrogen) using PCR cloning techniques to generate EcoRI and BamHI restriction sites. The sequence was then verified. Empty pcDNA3.1 and an enhanced green fluorescent protein (EGFP)-pcDNA3.1 expression construct were used as negative controls. To produce stable transfectants, expression vectors were linearized, transfected into the U87 cell line using FuGene6 (Roche Applied Science, Laval, Quebec) reagent, and kept under G418 antibiotic selection. Transfected cells were subsequently plated into 96-well plates at 1 cell per well and expanded to obtain stably transfected clones. Western blot verified the expression level of CD99 at the protein level.
siRNA preparation and transfections
For gene silencing, an siRNA quadriplex specific to CD99wt (NM_002414) Accell SMARTpool (Dharmacon, Thermo Scientific, Waltham, Massachusetts) was purchased. The target sequences were as follows: The first, corresponding to 599th to 617th nucleotide (5′ TCTCTAGCTTCATTGCTTA); the second, corresponding to 903rd to 921st (5′ TTACTAACGATGAATTTTA); the third, corresponding to 1183rd to 1201st (5′ TTTGTAGGGATATTTGTTT); and the fourth, corresponding to 1059th to 1077th (5′ CCAGAATCTTGGCTGTTTA). A commercial Accell nontargeting pool (Thermo Scientific) was used to evaluate off-target effects. Transient transfection was performed using the manufacturer’s protocol of Accell siRNA delivery media (Thermo Scientific). Maximal inhibition of protein was achieved by the third day after transfection, so the glioma cells were assayed at 72 hours posttransfection.
Immunofluorescence and confocal microscopy
Cells were plated onto coverslips 24 hours after transfection. At 72 hours after transfection, cells were washed 3 times with PBS, fixed with 4% paraformaldehyde and 750 µL of 1 M sucrose for 30 minutes, and then permeablized for 10 minutes using 0.2% Triton X-100 in PBS at room temperature. Nonspecific binding was blocked by 5% BSA in PBS for 30 minutes at room temperature. Subsequently, cells were incubated with mouse monoclonal anti-CD99 antibody (1:100; Santa Cruz Biotechnology) for 30 minutes in a 37°C incubator. After washing, cells were then incubated with Alexa Fluor 488 (1:200, Molecular Probes, Eugene, Oregon) conjugated goat anti-mouse IgG secondary antibody. For double labeling with F-actin, cells were coincubated with Texas Red-X phalloidin (1:50; Molecular Probes). To visualize fluorescence, a Zeiss Axiovert 200M Spinning Disk confocal microscope (Carl Zeiss Inc.) equipped with a Hamamatsu Back-Thinned EM-CCD camera (Hamamatsu Corporation, Bridgewater, New Jersey) was used.
Cell viability assay
Cell viability was determined using the colorimetric MTS assay. Cells stably transfected with the CD99wt overexpression construct or with the CD99wt siRNA were trypsinized, counted, and resuspended 6 hours after transfection. The cells were plated in 96-well dishes at a density of 2,000 cells per well and allowed to adhere overnight. To assess viability, cells were tested in 5 replicates using MTS [3-(4,5-dimethylthiazol-2-yl)-5-(3-carboxy-methoxyphenyl)-2-(4-sulfophenyl)-2H-tetrazolium, inner salt (Promega Corporation, Madison, Wisconsin)]. Absorbance at 490 nm was measured 2 hours after the addition of 20 µL of MTS reagent per well, every 24 hours over a 96-hour period.
Colony formation assay in soft agar
A base layer of 1.5% agar/2× DMEM/FBS was prepared in 35-mm plates. Upper layer agar was made using 1.5% agar, 2× DMEM, FBS, and sterile water and kept in liquid phase in a 42°C water bath. Cells were resuspended in 0.75% agar/DMEM/FBS and overlaid on the base layer with 2,000 cells per 35-mm plate and subsequently kept in a humidified chamber at 37°C for 2 weeks. Plates were stained with crystal violet, and the numbers of colonies in triplicate plates were counted.
Anoikis (detachment-induced apoptosis in poly-2 hydroxyethyl methacrylate) assay
Cells undergoing death by anoikis were identified and quantified using the CytoSelect anoikis assay kit according to the manufacturer’s instructions (Cell Biolab, San Diego, California). Briefly, cells to be assayed for anoikis were collected, pelleted by centrifugation, and resuspended in culture medium. Cells (400,000) in suspension were added to an anchorage-resistant poly-Hema-coated well. After 24-hour, 48-hour, and 72-hour incubation times at 37°C, 50 µL of MTT reagent in the kit was added into each well to detect living cells. Absorbance at 570 nm was measured 2 hours after the addition of MTT reagent.
Cell attachment assay
The cell attachment assay was performed as described previously (Elbashir, 2001 #46; Sriramarao, 1993 #47) with some modifications. Briefly, 96-well plates were incubated at 4°C overnight with an ECM protein, laminin (at 10 µg/mL). The unbound sites were blocked with 0.1% BSA in PBS for 1 hour at 37°C. Control dishes were prepared by blocking with BSA alone. Glioma cells were detached, resuspended in serum-free medium, and then plated at 5 × 10⁴ cells/well on laminin- or BSA-coated plates. The cells were allowed to adhere for 3 hours at 37°C and 5% CO2 in a humidified chamber. Unattached cells were removed by washing with PBS 3 times, and the remaining cells were fixed with 4% paraformaldehyde and stained with 0.5% crystal violet. Excess stain was washed away with water, and then the plates air-dried overnight. The crystal violet bound to the attached cells was solubilized with 1% SDS, and a microtiter plate reader (Molecular Devices, Sunnyvale, California) measured the absorbance of each well at 595 nm. All experiments were repeated 3 times using replicates of 5.
Radial cell migration assay
Cell migration assays were performed using the microliter-scale radial monolayer assay as described previously.34,35 Briefly, 10-well Teflon-coated slides (CSM Inc., Phoenix, Arizona) were coated with different ECM proteins and 0.1% BSA as described above. To establish a circular confluent monolayer 1 mm in diameter at the center of the substrate-coated well, transfected cells were collected 24 hours after transfection and seeded through a cell sedimentation manifold (CSM Inc.) at 2,000 cells per well. Photographs were taken 22 hours after plating, and a circle of best-fit circumscribing the cells was drawn. The cells were allowed to migrate for 24 hours, and then another circle circumscribing the newly migrated cells was made. The average migration rate was calculated as the change in the diameter of the circle circumscribing the cell population over a 24-hour period (micrometers per 24 hours). Photomicrographs were taken with an inverted microscope (Leica DM IRE2; Leica Microsystems, Inc., Bannockburn, Illinois) and studied using image-analysis software (Scion Image, Frederick, Maryland). All experiments were repeated 3 times using 3 replicates each.
Transwell cell invasion assay
A cell invasion assay was carried out using modified Boyden chambers that consisted of Transwell-coated Matrigel membrane filter inserts with 8 µm pores in 24-well tissue culture plates (BD Biosciences, Bedford, Massachusetts) as described previously.36 Two days after transfection, 4 × 10⁴ cells were plated onto the top of the chamber in DMEM with 5% FBS. The bottom chamber was filled with DMEM containing 20% FBS as a chemoattractant. Plates were incubated for 24 hours in a 5% CO2 humidified chamber at 37°C. Noninvading cells were wiped off the upper surface of the membrane with a cotton swab, and the filter membrane was fixed with 4% paraformaldehyde and stained with 0.5% crystal violet. The degree of invasion was determined by counting the number of cells that had migrated through the membrane in at least 6 random fields (total magnification, 200×) per filter. Experiments were repeated 3 times in triplicate.
Orthotopic intracranial xenograft
U87 cells stably transfected with EGFP-pcDNA3.1- and CD99wt-pcDNA3.1- expression constructs were used for xenograft experiments. Cells were released from the culture plates using Accutase (Sigma-Aldrich, St. Louis, Missouri), washed twice in 1 × PBS, resuspended in a small volume of serum-free EMEM at a final concentration of 100,000 cells/µL, and kept on ice until the time of injection. Male Nu/Foxn1/Nu mice (ages 5-6 weeks; Charles River, Senneville, Quebec) were anesthetized using i.p. ketamine/xylazine. Intracranial injection of 200,000 cells (2 µL) was performed in the right forebrain at the following coordinates: 2.0 mm lateral and 1 mm anterior to bregma at a 2.0 mm depth from the skull surface, using a murine stereotactic head frame and Hamilton syringe. Six mice were injected with U87 cells stably transfected with EGFP-pcDNA3.1-, and 7 mice were injected with U87-CD99-pcDNA3.1- stable cell line. Mice were observed for evidence of a symptomatic intracranial mass such as incoordination, lethargy, or weight loss >20% of maximal body weight. Whole brain specimens were fixed in 10% formalin for 72 hours followed by 70% ethanol until all samples were obtained for further processing. Samples were paraffin embedded; sections were cut, mounted onto slides, and stained for H&E, human CD99, the same as in the tissue microarray.
Mass spectrometry
Eight µg of total cellular lysate of CD99wt overexpressing U87 cell lines was obtained using NP40 (50 mM Tris-HCL, 150 mM NaCl, and 1% NP-40) lysis buffer. Then 4 µg of cell lysate was subjected to immunoprecipitation with 8 µg of mouse monoclonal anti-MIC2 (CD99) antibody or normal mouse IgG antibody (Santa Cruz Biotechnology), respectively. The samples were loaded onto 12% 1.0 mm Tris gels for SDS-PAGE, and the gels were stained with Colloidal Blue Staining Kit (Invitrogen) per the manufacturer’s instruction. The gels were then sent to the Advanced Protein Technology Centre at the Hospital for Sick Children (Toronto) and subjected to liquid chromatography–mass spectrometry (LC/MS) using an LC system (Easy-nLC, Proxeon Biosystems A/S, Odense) coupled with an LTQ-Orbitrap mass spectrometer (Thermo Scientific, Bremen, Germany). The data were analyzed using SCAFFOLD 3 software (Proteome Software, Portland, Oregon).
Epidermal growth factor (EGF) stimulation for CD99 overexpressing cells
The cell lines were stimulated with 100 ng/mL EGF for 10 minutes after serum starvation for 24 hours, and cell lysates were obtained using lysis buffer. After standardization of protein concentration, Western blotting analysis was performed using antibodies to Akt (1:1000; Cell Signaling Technology, Danvers, Massachusetts), phospho-Akt(Ser473) (1:1000; Cell Signaling Technology), ERK1/2 (1:1000; Cell Signaling Technology), phospho-ERK1/2(Thr202/Tyr204) (1:2000; Cell Signaling Technology), JNK (1:500; Millipore, Temecula, California), and phospho-JNK(Thr183/Tyr185) (1:500; Millipore).
Rac and Rho GTPase Activation Assay
Rac and Rho pull-down assays were performed using protein lysates of cell lines and GTPase Activation Assay Kit (Millipore) per the manufacturer’s directions. Then samples were subjected to 10% SDS-PAGE and Western blot analysis.
Three-dimensional (3D) collagen cultures and immunofluorescence
Glioma cells (1 × 10⁵ cells/mL) were suspended in 1.4 µg/mL Type I collagen Cultrex gels (Trevigen, Gaithersburg, Maryland) and incubated at 37°C for 48 hours. Then the collagen gels were fixed with 4% paraformaldehyde for 30 minutes at room temperature, permeablized using 0.2% Triton-X for 10 minutes, and stained with Alexa Fluor Phalloidin (1:40; Invitrogen, Eugene, Oregon) and H3343 (1:10000; Invitrogen) after blocking with 5% BSA in PBS for 1 hour. The gels were imaged as described above.
Statistical analyses
Statistical analyses were performed using Student t test and the Mann-Whitney U test. Survival curves were generated Kaplan-Meier method. The log-rank statistic was used to compare the distributions of survival times. A P value of < 0.05 was considered statistically significant.
Supplementary Material
Footnotes
Supplementary material for this article is available on the Genes & Cancer website at http://ganc.sagepub.com/supplemental.
Declaration of Conflicting Interests: The author(s) declared no potential conflicts of interest with respect to the research, authorship, and/or publication of this article.
Funding: The author(s) disclosed receipt of the following financial support for the research, authorship, and/or publication of this article: This work was supported by the Canadian Institutes of Health Grant MOP-74610, Brainchild, the Wiley Fund, and the Laurie Berman Fund for Brain Tumour Research
References
- 1. Burger PC. The “ideal” classification of pediatric central nervous system neoplasms. Cancer. 1985;56(7 Suppl):1865-8 [DOI] [PubMed] [Google Scholar]
- 2. Giese A. Glioma invasion—pattern of dissemination by mechanisms of invasion and surgical intervention, pattern of gene expression and its regulatory control by tumorsuppressor p53 and proto-oncogene ETS-1. Acta Neurochir Suppl. 2003;88:153-62 [DOI] [PubMed] [Google Scholar]
- 3. Lauffenburger DA. Cell motility: making connections count. Nature. 1996;383(6599):390-1 [DOI] [PubMed] [Google Scholar]
- 4. Ohta Y, Hartwig JH, Stossel TP. FilGAP, a Rho- and ROCK-regulated GAP for Rac binds filamin A to control actin remodelling. Nat Cell Biol. 2006;8(8):803-14 [DOI] [PubMed] [Google Scholar]
- 5. Sahai E, Marshall CJ. Differing modes of tumour cell invasion have distinct requirements for Rho/ROCK signalling and extracellular proteolysis. Nat Cell Biol. 2003;5(8):711-9 [DOI] [PubMed] [Google Scholar]
- 6. Sanz-Moreno V, Gadea G, Ahn J, et al. Rac activation and inactivation control plasticity of tumor cell movement. Cell. 2008;135(3):510-23 [DOI] [PubMed] [Google Scholar]
- 7. Demuth T, Berens ME. Molecular mechanisms of glioma cell migration and invasion. J Neurooncol. 2004;70(2):217-28 [DOI] [PubMed] [Google Scholar]
- 8. Mitchison TJ, Cramer LP. Actin-based cell motility and cell locomotion. Cell. 1996;84(3):371-9 [DOI] [PubMed] [Google Scholar]
- 9. Persson O, Krogh M, Saal LH, et al. Microarray analysis of gliomas reveals chromosomal position-associated gene expression patterns and identifies potential immunotherapy targets. J Neurooncol. 2007;85(1):11-24 [DOI] [PubMed] [Google Scholar]
- 10. Levy R, Dilley J, Fox RI, Warnke R. A human thymus-leukemia antigen defined by hybridoma monoclonal antibodies. Proc Natl Acad Sci U S A. 1979;76(12):6552-6 [DOI] [PMC free article] [PubMed] [Google Scholar]
- 11. Hamilton G, Fellinger EJ, Schratter I, Fritsch A. Characterization of a human endocrine tissue and tumor-associated Ewing’s sarcoma antigen. Cancer Res. 1988;48(21):6127-31 [PubMed] [Google Scholar]
- 12. Kovar H, Dworzak M, Strehl S, et al. Overexpression of the pseudoautosomal gene MIC2 in Ewing’s sarcoma and peripheral primitive neuroectodermal tumor. Oncogene. 1990;5(7):1067-70 [PubMed] [Google Scholar]
- 13. Gelin C, Aubrit F, Phalipon A, et al. The E2 antigen, a 32 kd glycoprotein involved in T-cell adhesion processes, is the MIC2 gene product. EMBO J. 1989;8(11):3253-9 [DOI] [PMC free article] [PubMed] [Google Scholar]
- 14. Weidner N, Tjoe J. Immunohistochemical profile of monoclonal antibody O13: antibody that recognizes glycoprotein p30/32MIC2 and is useful in diagnosing Ewing’s sarcoma and peripheral neuroepithelioma. Am J Surg Pathol. 1994;18(5):486-94 [PubMed] [Google Scholar]
- 15. Byun HJ, Hong IK, Kim E, et al. A splice variant of CD99 increases motility and MMP-9 expression of human breast cancer cells through the AKT-, ERK-, and JNK-dependent AP-1 activation signaling pathways. J Biol Chem. 2006;281(46):34833-47 [DOI] [PubMed] [Google Scholar]
- 16. Scotlandi K, Baldini N, Cerisano V, et al. CD99 engagement: an effective therapeutic strategy for Ewing tumors. Cancer Res. 2000;60(18):5134-42 [PubMed] [Google Scholar]
- 17. Scotlandi K, Zuntini M, Manara MC, et al. CD99 isoforms dictate opposite functions in tumour malignancy and metastases by activating or repressing c-Src kinase activity. Oncogene. 2007;26(46):6604-18 [DOI] [PubMed] [Google Scholar]
- 18. Manara MC, Bernard G, Lollini PL, et al. CD99 acts as an oncosuppressor in osteosarcoma. Mol Biol Cell. 2006;17(4):1910-21 [DOI] [PMC free article] [PubMed] [Google Scholar]
- 19. Kreppel M, Aryee DN, Schaefer KL, et al. Suppression of KCMF1 by constitutive high CD99 expression is involved in the migratory ability of Ewing’s sarcoma cells. Oncogene. 2006;25(19):2795-800 [DOI] [PubMed] [Google Scholar]
- 20. Hahn JH, Kim MK, Choi EY, et al. CD99 (MIC2) regulates the LFA-1/ICAM-1-mediated adhesion of lymphocytes, and its gene encodes both positive and negative regulators of cellular adhesion. J Immunol. 1997;159(5):2250-8 [PubMed] [Google Scholar]
- 21. Dworzak MN, Froschl G, Printz D, et al. CD99 expression in T-lineage ALL: implications for flow cytometric detection of minimal residual disease. Leukemia. 2004;18(4):703-8 [DOI] [PubMed] [Google Scholar]
- 22. Fisher C. Synovial sarcoma. Ann Diagn Pathol. 1998;2(6):401-21 [DOI] [PubMed] [Google Scholar]
- 23. Brown RE, Boyle JL. Mesenchymal chondrosarcoma: molecular characterization by a proteomic approach, with morphogenic and therapeutic implications. Ann Clin Lab Sci. 2003;33(2):131-41 [PubMed] [Google Scholar]
- 24. Ramani P, Rampling D, Link M. Immunocytochemical study of 12E7 in small round-cell tumours of childhood: an assessment of its sensitivity and specificity. Histopathology. 1993;23(6):557-61 [DOI] [PubMed] [Google Scholar]
- 25. Pelosi G, Fraggetta F, Sonzogni A, Fazio N, Cavallon A, Viale G. CD99 immunoreactivity in gastrointestinal and pulmonary neuroendocrine tumours. Virchows Arch. 2000;437(3):270-4 [DOI] [PubMed] [Google Scholar]
- 26. Maitra A, Hansel DE, Argani P, et al. Global expression analysis of well-differentiated pancreatic endocrine neoplasms using oligonucleotide microarrays. Clin Cancer Res. 2003;9(16 Pt 1):5988-95 [PubMed] [Google Scholar]
- 27. Jung KC, Park WS, Bae YM, et al. Immunoreactivity of CD99 in stomach cancer. J Korean Med Sci. 2002;17(4):483-9 [DOI] [PMC free article] [PubMed] [Google Scholar]
- 28. Milanezi F, Pereira EM, Ferreira FV, Leitao D, Schmitt FC. CD99/MIC-2 surface protein expression in breast carcinomas. Histopathology. 2001;39(6):578-83 [DOI] [PubMed] [Google Scholar]
- 29. Wolf RM, Draghi N, Liang X, et al. p190RhoGAP can act to inhibit PDGF-induced gliomas in mice: a putative tumor suppressor encoded on human chromosome 19q13.3. Genes Dev. 2003;17(4):476-87 [DOI] [PMC free article] [PubMed] [Google Scholar]
- 30. Kakinuma N, Roy BC, Zhu Y, Wang Y, Kiyama R. Kank regulates RhoA-dependent formation of actin stress fibers and cell migration via 14-3-3 in PI3K-Akt signaling. J Cell Biol. 2008;181(3):537-49 [DOI] [PMC free article] [PubMed] [Google Scholar]
- 31. Nishioka T, Nakayama M, Amano M, Kaibuchi K. Proteomic screening for Rho-kinase substrates by combining kinase and phosphatase inhibitors with 14-3-3zeta affinity chromatography. Cell Struct Funct. 2012;37(1):39-48 [DOI] [PubMed] [Google Scholar]
- 32. Kurokawa K, Matsuda M. Localized RhoA activation as a requirement for the induction of membrane ruffling. Mol Biol Cell. 2005;16(9):4294-303 [DOI] [PMC free article] [PubMed] [Google Scholar]
- 33. Wang HR, Zhang Y, Ozdamar B, et al. Regulation of cell polarity and protrusion formation by targeting RhoA for degradation. Science. 2003;302(5651):1775-9 [DOI] [PubMed] [Google Scholar]
- 34. Hwang JH, Smith CA, Salhia B, Rutka JT. The role of fascin in the migration and invasiveness of malignant glioma cells. Neoplasia. 2008;10(2):149-59 [DOI] [PMC free article] [PubMed] [Google Scholar]
- 35. Salhia B, Rutten F, Nakada M, et al. Inhibition of Rho-kinase affects astrocytoma morphology, motility, and invasion through activation of Rac1. Cancer Res. 2005;65(19):8792-800 [DOI] [PubMed] [Google Scholar]
- 36. Valster A, Tran NL, Nakada M, Berens ME, Chan AY, Symons M. Cell migration and invasion assays. Methods. 2005;37(2):208-15 [DOI] [PubMed] [Google Scholar]
Associated Data
This section collects any data citations, data availability statements, or supplementary materials included in this article.


