Abstract
The Poisson ratio (PR) is a fundamental mechanical parameter that approximates the ratio of relative change in cross sectional area to tensile elongation. However, the PR of extraocular muscle (EOM) is almost never measured because of experimental constraints. The problem was overcome by determining changes in EOM dimensions using computed X-ray tomography (CT) at microscopic resolution during tensile elongation to determine transverse strain indicated by the change in cross-section. Fresh bovine EOM specimens were prepared. Specimens were clamped in a tensile fixture within a CT scanner (SkyScan, Belgium) with temperature and humidity control and stretched up to 35% of initial length. Sets of 500–800 contiguous CT images were obtained at 10-micron resolution before and after tensile loading. Digital 3D models were then built and discretized into 6–8-micron-thick elements. Changes in longitudinal thickness of each microscopic element were determined to calculate strain. Green's theorem was used to calculate areal strain in transverse directions orthogonal to the stretching direction. The mean PR from discretized 3D models for every microscopic element in 14 EOM specimens averaged 0.457 ± 0.004 (SD). The measured PR of bovine EOM is thus near the limit of incompressibility.
1. Introduction
Since extraocular muscles (EOMs) are manipulated mechanically during strabismus surgery to correct binocular misalignment, the mechanical properties of the EOMs should be understood in order to optimize surgical results. With increasing demand for accuracy in simulation of orbital mechanics, finite element analysis (FEA) is becoming increasingly attractive. However, casual estimation of mechanical parameters in FEA can lead to serious errors in simulation. In order to accurately determine the biomechanical properties of orbital tissues, scientists in the field have employed a variety of experimental techniques. While conventional tensile elongation tests have been performed to investigate the uniaxial force and length relationship for EOMs [1–5], micro/nano indentation has permitted measurement of the compressive modulus of other orbital tissues [6, 7]. Despite such efforts [1, 5–11], many material parameters of orbital tissues have yet to be defined. Experimental technique and the theoretical constitutive framework should be appropriate for each tested orbital tissue. For instance, triborheometry, which treats a solid from rheometric perspective, was employed for characterizing amorphous specimens such as orbital connective and fatty tissue [10]. A variety of other biomechanical methods [12] have been employed to characterize more comprehensive constitutive models for EOMs that capture their time-dependent relationships between stress and strain [1, 5, 8].
The Poisson ratio (PR) is a critical mechanical parameter required to define comprehensively the elastic behavior of a material. The PR is the ratio of the transverse contraction strain to the axial extension strain, which can be obtained during simple tensile elongation. Normally, the PR of a material ranges between 0 and 0.5, depending on the material's compressibility. However, the PR can be higher than 0.5 or lower than 0 for materials having complex matrices and inner structures [13, 14]. Most soft tissues are considered to be elastomeric materials with high bulk modulus relative to Young's modulus, so the PR is expected to approximate 0.5 [15].
In general, the PR can be measured by static or dynamic methods. Static methods, such as classical tensile or compressive testing, are most widely used in solid mechanics [15, 16]. In static determinations, the PR is calculated from transverse and axial deformations due to uniaxial stress. For dynamic determination, the PR is determined from the natural frequency of the transverse and axial waves in the material [17–19], most commonly elicited by ultrasound perturbation.
The PR has been typically assumed to be between 0.35 and 0.49 for soft tissues [20–22]. However, it has been estimated that a 20% error in the PR would result in errors of 3.8% and 4.4% in the biaxial flexural strength and the indentation modulus of a material, respectively [15]. Such errors could propagate and compound during the iterative computations in FEA. Clearly, there is a need to minimize errors by accurate experimental determination of the PR. By employing a novel X-ray computed tomographic (CT) imaging method for precise determination of strain, we aimed to extract accurate static PR for EOMs.
2. Materials and Methods
2.1. Specimen Preparation
Fresh heads of adult cows were obtained from a nearby abattoir. In the laboratory, orbits were carefully dissected for extraction of EOM and connective tissue. Transport time from abattoir to laboratory was approximately 30 min; the additional time elapsed to dissect the EOMs averaged 3 hrs. After extraction, EOMs were maintained in lactated Ringer's solution at 37°C. To minimize axial damage to EOM fibers, each specimen was initially prepared in the shape of an approximately 7 mm long prism with a 4 mm × 2 mm cross-section. For consistency, samples were prepared from the transverse center of each EOM. Given that clamping of both ends was necessary, the actual tested length was the 10 mm of middle portion of each specimen and in every case avoided the terminal tendon. Specimen preparation time was approximately 45 min.
2.2. Experiment
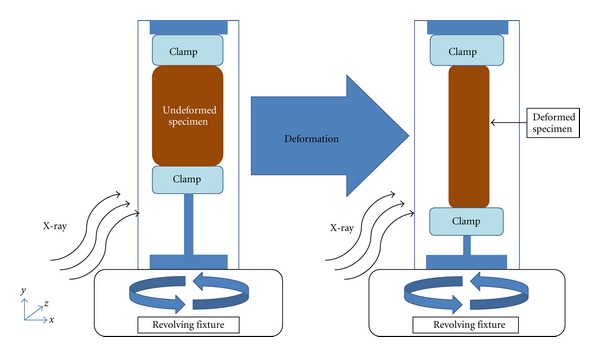
A high-resolution micro-CT scanner (Model 1172, SkyScan, Belgium) incorporating a tensile loading fixture was used to image deformed and undeformed states of 14 freshly prepared bovine EOM specimens. Scanning was accomplished by revolving and longitudinally translating the specimen and tensile fixture between a fixed, collimated X-ray source and a fixed detector (Figure 1). Once loaded in the tensile fixture, the undeformed specimen was first imaged at 10 micron spatial resolution. After the specimen was elongated 30%–35%, which is well within the linear elastic region [1], the deformed specimen was again imaged. In order to prevent dehydration, corn oil was applied on each specimen before placement into the tensile fixture. Figure 1 shows schematics of undeformed and deformed states of the specimen in the tensile fixture.
Figure 1.

Both undeformed and deformed states of EOM specimens were imaged. As shown above, the X-ray direction was orthogonal to the revolving specimen fixture.
2.3. 3D Reconstruction of EOMs
After EOM specimens were scanned, 500 cross-sectional area (CSA) images for undeformed and 800 CSA images for deformed states were used to create 3D reconstruction of the entire length of each EOM specimen using Matlab (Version R2010a, The MathWorks, Inc., Massachusetts) image processing tools and SolidWorks CAD software (version 2011, Dassault Systèmes SolidWorks Corp., Massachusetts). More deformed than undeformed image planes were required since the deformed specimen was elongated. The CSA in each image plane was connected to that in the adjacent planes in order to generate 3D reconstruction by using the loft feature in Solidworks.
2.4. Poisson Ratio
As shown in (1), the PR ν, for materials undergoing deformations exceeding 1% [23], is expressed as the negative ratio of transverse to axial true strain [24, 25]:
| (1) |
where ε T and ε A are the transverse and axial engineering strains, respectively. Equation (1) can be rearranged and can be expressed as shown in (2):
| (2) |
Recognizing the fact that an infinitesimal element in the CSA undergoes a plane deformation when the EOM is subjected to loading, the transverse strain in (2) can be shown as ln(δx/δx ο) and (2) can be rearranged as (3) with δx o and δx being the length of side of the element in undeformed and deformed configuration:
| (3) |
Equation (3) is valid under the assumption of isotropy or transverse isotropy, which is appropriate for an EOM [25]. Hence the CSA of the square in the deformed configuration can be expressed as (4) where δA 0 is the initial CSA:
| (4) |
As reported by Vergari et al. [25], the instantaneous CSA can be expressed as (5) by summation of all the elements in the EOM CSA:
| (5) |
where A and A ο are the instantaneous and initial EOM CSA values, respectively. The CT scanner employed was specifically designed to image CSAs suitable for 3D reconstruction. After 3D reconstruction for both deformed and undeformed states, each model was then uniformly discretized into 8 micron thick elements. The CSA for each element was then computed using Green's theorem as shown in (6):
| (6) |
Finally, the PR for each discretized element was calculated using (7):
| (7) |
For more precise evaluation of PR, the CAD surface reconstruction excluded regions near clamping plates that are influenced by the clamping forces. After the PR was computed for all the elements within each specimen using (7), the average PR was calculated for each of the 14 specimens tested.
3. Results
3.1. 3D Reconstruction
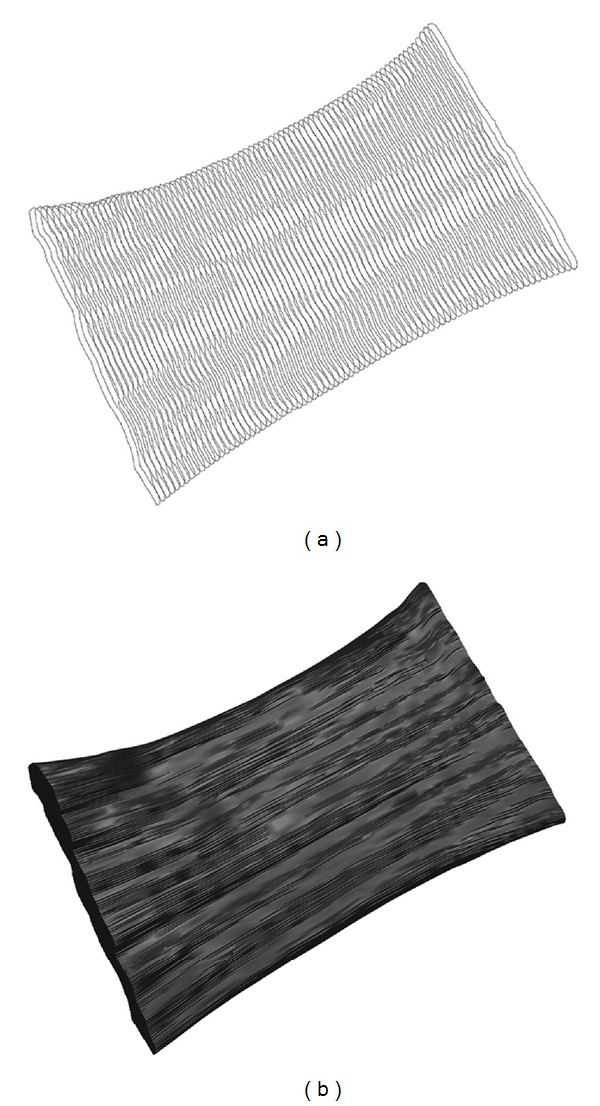
Figure 2 shows the 3D reconstruction from 500 CSAs (Figure 2(a)) used to build the undeformed model of an EOM specimen (Figure 2(b)).
Figure 2.

(a) Decimated set of CSA images for an undeformed EOM specimen. (b) Finished 3D reconstruction from 500 CSAs.
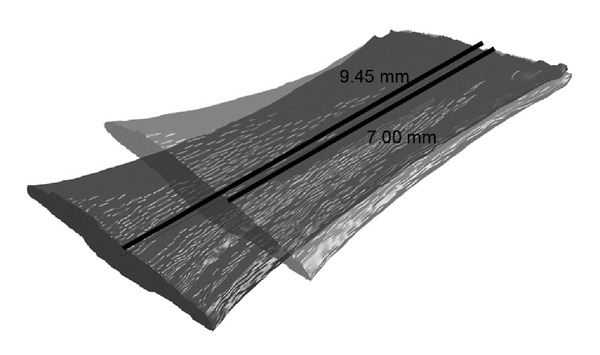
Once 3D reconstruction was completed for each specimen for both undeformed and deformed states, the models were discretized into elements with uniform thickness of 6 microns and 8.1 microns, respectively. During preliminary experiments it was verified that all 6 anatomical EOMs exhibited similar PR values. Thus PR values for 6 EOMs were not differentiated by anatomical EOM. Figure 3 contrasts undeformed and deformed states of the same EOM specimen.
Figure 3.

Finished 3D models for both undeformed and deformed states of an EOM specimen. The original length of the specimen was 7 mm, and the final length of the specimen after the 35% deformation was 9.45 mm.
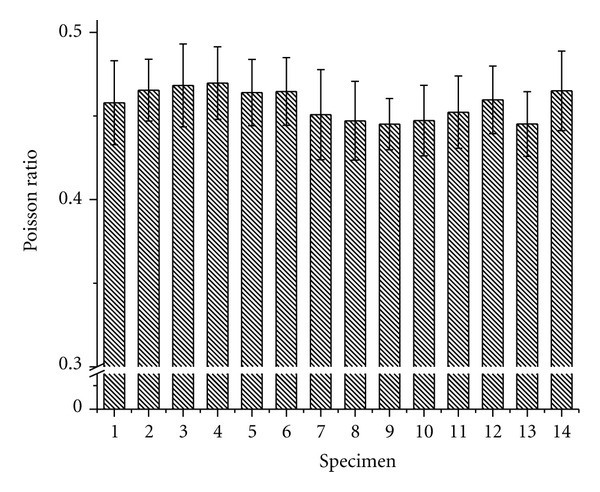
Assuming uniform stretch throughout each specimen, the PR for each element within each EOM specimen was computed from the CSAs and actual elongated length. Figure 4 shows the average PR values for each of the 14 specimens.
Figure 4.

PR values for all 14 specimens. Error bars indicate SD.
The PR over all 14 specimens averaged 0.457 ± 0.004 (standard deviation (SD)) was highly significantly different by Student's t-test from the ideal incompressible value 0.5 (P < 10−9).
4. Discussion
Micro-CT imaging of EOM specimens effectively characterized the PR for bovine EOM during tensile elongation, which is a critical mechanical parameter. The present investigation is the first to evaluate bovine EOM PR directly from CSA measurements by noncontact imaging during large deformation. Prior studies were based on measurement of small, linear transverse deformations [26, 27]. In the present investigation, mean PR of 14 bovine EOM was computed to be 0.457 ± 0.004 (SD). While isotropic media cannot have PRs exceeding 0.5, orthotropic or transversely isotropic materials (such as tendons) sometimes have PRs exceeding 1 [25]. A PR value approximating 0.5 has interesting implications for tendon behavior: assuming conservation of mass, a PR value smaller than 0.5 implies an increase in volume during loading leading to a decrease in density. On the other hand, a PR exceeding 0.5 implies a volume reduction and an increase in density. Still, the mean PR for all EOM specimens tested in the present study was 0.457, so EOM under axial loading can be considered to a good approximation to behave as an incompressible material. The small volume variations measured might be caused by water loss, as suggested by Lynch et al. [27]. However, since in the present experiment corn oil was employed to coat the specimen to avoid dehydration, measured small volume variations are probably due to internal rearrangements of the fiber structures [25]. The precise PR value for EOM reported in the present study should facilitate quantitative modeling of ocular motor biomechanics and is represented in a theoretical framework practical for graphical simulation of quasistatic ocular motility using FEM.
The present paper introduces micro-CT imaging as a noncontacting approach to compute the PR from specimen geometry. As it has been presented, micro-CT imaging technology coupled with 3D reconstruction based on the volumetric specimen changes allows more accurate evaluation of Poisson's ratio for bovine EOM specimens.
5. Conclusion
The current investigation describes a method to determine the PR for bovine EOM based upon CSAs from discretized deformed and undeformed specimens obtained from micro-CT imaging during quasistatic loading. The study also demonstrated that 3D reconstruction of micro CT imaging can be successfully performed for both deformed and undeformed EOM specimens. In the present study, the PR, a critical parameter for quantitative mechanical characterization of soft tissues that is necessary for modeling and simulation, was determined for bovine EOM specimens to be near the criterion for incompressibility.
Conflict of Interests
The authors declare that none of them has any financial or personal relationships with people of organization that can inappropriately influence his work or the conclusions drawn from this investigation.
Acknowledgments
The authors acknowledge Manning Beef, LLC, Pico Rivera, CA, for their generous contribution of bovine specimens. They also thank Jose Martinez, Claudia Tamayo, and Ramiro Carlos of Manning Beef for assistance with specimen preparation. This paper is supported by U.S. Public Health Service, National Eye Institute: Grants EY08313 and EY00331, and Research to Prevent Blindness. J. L. Demer is Leonard Apt Professor of ophthalmology.
References
- 1.Yoo L, Kim H, Gupta V, Demer JL. Quasilinear viscoelastic behavior of bovine extraocular muscle tissue. Investigative Ophthalmology and Visual Science. 2009;50(8):3721–3728. doi: 10.1167/iovs.08-3245. [DOI] [PMC free article] [PubMed] [Google Scholar]
- 2.Robinson DA, O’Meara DM, Scott AB, Collins CC. Mechanical components of human eye movements. Journal of Applied Physiology. 1969;26(5):548–553. doi: 10.1152/jappl.1969.26.5.548. [DOI] [PubMed] [Google Scholar]
- 3.Collins CC, Carlson MR, Scott AB, Jampolsky A. Extraocular muscle forces in normal human subjects. Investigative Ophthalmology and Visual Science. 1981;20(5):652–664. [PubMed] [Google Scholar]
- 4.Simonsz HJ. Force-length recording of eye muscles during local anesthesia surgery in 32 strabismus patients. Strabismus. 1994;2:197–218. doi: 10.3109/09273979409035475. [DOI] [PubMed] [Google Scholar]
- 5.Quaia C, Ying HS, Nichols AM, Optican LM. The viscoelastic properties of passive eye muscle in primates: I: static and step responses. PLoS ONE. 2009;4(4) doi: 10.1371/journal.pone.0004850.e4850 [DOI] [PMC free article] [PubMed] [Google Scholar]
- 6.Yoo L, Reed J, Gimzewski JK, Demer JL. Mechanical interferometry imaging for creep modeling of the cornea. Investigative Ophthalmology and Visual Science. 2011;52(11):8420–8424. doi: 10.1167/iovs.11-7911. [DOI] [PMC free article] [PubMed] [Google Scholar]
- 7.Yoo L, Reed J, Shin A, et al. Characterization of ocular tissues using microindentation and Hertzian viscoelastic models. Investigative Ophthalmology and Visual Science. 2011;52(6):3475–3482. doi: 10.1167/iovs.10-6867. [DOI] [PMC free article] [PubMed] [Google Scholar]
- 8.Quaia C, Ying HS, Optican LM. The viscoelastic properties of passive eye muscle in primates. II: testing the quasi-linear theory. PLoS ONE. 2009;4(8) doi: 10.1371/journal.pone.0006480.e6480 [DOI] [PMC free article] [PubMed] [Google Scholar]
- 9.Yoo L, Kim H, Shin A, Gupta V, Demer JL. Creep behavior of passive bovine extraocular muscle. Journal of Biomedicine and Biotechnology. 2011;2011 doi: 10.1155/2011/526705.526705 [DOI] [PMC free article] [PubMed] [Google Scholar]
- 10.Yoo L, Gupta V, Lee C, Kavehpore P, Demer JL. Viscoelastic properties of bovine orbital connective tissue and fat: constitutive models. Biomechanics and Modeling in Mechanobiology. 2011;10(6):901–914. doi: 10.1007/s10237-010-0281-z. [DOI] [PMC free article] [PubMed] [Google Scholar]
- 11.Boyce BL, Jones RE, Nguyen TD, Grazier JM. Stress-controlled viscoelastic tensile response of bovine cornea. Journal of Biomechanics. 2007;40(11):2367–2376. doi: 10.1016/j.jbiomech.2006.12.001. [DOI] [PubMed] [Google Scholar]
- 12.Fung YC. Biomechanics: Mechanical Properties of Living Tissues. New York, NY, USA: Springer; 1993. [Google Scholar]
- 13.Lakes R. Advances in negative poisson’s ratio materials. Advanced Materials. 1993;5(4):293–296. [Google Scholar]
- 14.Larsen UD, Sigmund O, Bouwstra S. Design and fabrication of compliant micromechanisms and structures with negative Poisson’s ratio. Proceedings of the 9th Annual International Workshop on Micro Electro Mechanical Systems (MEMS '96); February 1996; pp. 365–371. [Google Scholar]
- 15.Chung SM, Yap AUJ, Koh WK, Tsai KT, Lim CT. Measurement of Poisson’s ratio of dental composite restorative materials. Biomaterials. 2004;25(13):2455–2460. doi: 10.1016/j.biomaterials.2003.09.029. [DOI] [PubMed] [Google Scholar]
- 16.Wu W, Sadeghipour K, Boberick K, Baran G. Predictive modeling of elastic properties of particulate-reinforced composites. Materials Science and Engineering A. 2002;332(1-2):362–370. [Google Scholar]
- 17.Pamenius M, Ohlson NG. The determination of elastic constants by dynamic experiments. Dental Materials. 1986;2(6):246–250. doi: 10.1016/s0109-5641(86)80036-7. [DOI] [PubMed] [Google Scholar]
- 18.Spinner SAM. Elastic moduli of glasses at elevated temperatures by a dynamic method. Journal of the American Ceramic Society. 1956;39:113–118. [Google Scholar]
- 19.D’Evelyn MP, Taniguchi T. Elastic properties of translucent polycrystalline cubic boron nitride as characterized by the dynamic resonance method. Diamond and Related Materials. 1999;8(8-9):1522–1526. [Google Scholar]
- 20.Zhang M, Zheng YP, Mak AFT. Estimating the effective Young’s modulus of soft tissues from indentation tests—nonlinear finite element analysis of effects of friction and large deformation. Medical Engineering and Physics. 1997;19(6):512–517. doi: 10.1016/s1350-4533(97)00017-9. [DOI] [PubMed] [Google Scholar]
- 21.Van Den Bedem SPW, Schutte S, Van Der Helm FCT, Simonsz HJ. Mechanical properties and functional importance of pulley bands or “faisseaux tendineux”. Vision Research. 2005;45(20):2710–2714. doi: 10.1016/j.visres.2005.04.016. [DOI] [PubMed] [Google Scholar]
- 22.Sumi C, Suzuki A, Nakayama K. Estimation of shear modulus distribution in soft tissue from strain distribution. IEEE Transactions on Biomedical Engineering. 1995;42(2):193–202. doi: 10.1109/10.341832. [DOI] [PubMed] [Google Scholar]
- 23.Reese SP, Maas SA, Weiss JA. Micromechanical models of helical superstructures in ligament and tendon fibers predict large Poisson’s ratios. Journal of Biomechanics. 2010;43(7):1394–1400. doi: 10.1016/j.jbiomech.2010.01.004. [DOI] [PMC free article] [PubMed] [Google Scholar]
- 24.Smith CW, Wootton RJ, Evans KE. Interpretation of experimental data for Poisson’s ratio of highly nonlinear materials. Experimental Mechanics. 1999;39(4):356–362. [Google Scholar]
- 25.Vergari C, Pourcelot P, Holden L, et al. True stress and Poisson’s ratio of tendons during loading. Journal of Biomechanics. 2011;44(4):719–724. doi: 10.1016/j.jbiomech.2010.10.038. [DOI] [PubMed] [Google Scholar]
- 26.Cheng VWT, Screen HRC. The micro-structural strain response of tendon. Journal of Materials Science. 2007;42(21):8957–8965. [Google Scholar]
- 27.Lynch HA, Johannessen W, Wu JP, Jawa A, Elliott DM. Effect of fiber orientation and strain rate on the nonlinear uniaxial tensile material Properties of Tendon. Journal of Biomechanical Engineering. 2003;125(5):726–731. doi: 10.1115/1.1614819. [DOI] [PubMed] [Google Scholar]


