Abstract
The complex metabolic makeup of a biological system, such as a cell, is a key determinant of its biological state providing unique insights into its function. Here we characterize the metabolome of a cell by a novel homonuclear 13C 2D NMR approach applied to a non-fractionated uniformly 13C-enriched lysate of E. coli cells and determine de novo their carbon backbone topologies that constitute the ‘topolome’. A protocol was developed, which first identifies traces in a constant-time 13C-13C TOCSY NMR spectrum that are unique for individual mixture components and then assembles for each trace the corresponding carbon-bond topology network by consensus clustering. This led to the determination of 112 topologies of unique metabolites from a single sample. The topolome is dominated by carbon topologies of carbohydrates (34.8%) and amino acids (45.5%) that can constitute building blocks of more complex structures.
INTRODUCTION
A distinctive feature of biological systems is their high level of chemical complexity. A multitude of metabolites serve diverse cellular functions, such as messengers, enzymatic substrates, energy source, and molecular and structural building blocks. The metabolic characterization of biological samples either uses potentially elaborate chromatographic separation procedures prior to analysis or it applies NMR or mass spectroscopic methods directly to the non-fractionated samples.1 The latter approach is commonly used for the identification of biomarkers by statistical analysis of 1D NMR spectra from different samples and for the identification of metabolites by databank screening. Many biological samples, however, contain a significant number of unknown metabolites that are not catalogued in databanks. Their systematic identification and structural characterization is therefore an important target. Although more time-consuming than 1D NMR, the achievable gain in resolution makes 2D NMR an attractive method for this task. For sensitivity reasons, so far, a majority of applications has been based on 2D 1H NMR experiments taking advantage of the high natural abundance of proton spins and their relatively large magnetic moment.2 The strong conformation-dependence of vicinal 3J(1H,1H)-couplings, however, can cause uneven magnetization transfer in TOCSY and COSY spectra, thereby impeding the assignment of cross-peaks to individual spin systems or entire molecules. Furthermore, the spectral information of protons may not be sufficient for the complete reconstruction of the carbon backbone of metabolites and their bonding topology, which is a prerequiste for structure determination.
Here we present a comprehensive approach for the characterization of the metabolic content of uniformly 13C-enriched cells based on homonuclear 2D 13C NMR. The large one-bond scalar couplings (1J(13C,13C) > 30 Hz) make the efficient transfer of spin magnetization during 13C-TOCSY mixing possible.3 On the other hand, the same 1J(13C,13C)-couplings lead to broad multiplet structures4 resulting in increased cross-peak overlap. They can be mitigated along the indirect ω1 dimension by 13C-13C constant-time (CT) TOCSY spectroscopy.5
RESULTS
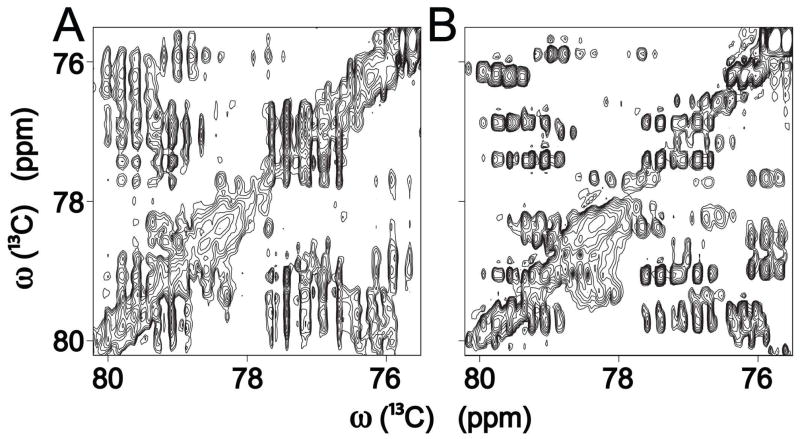
Figure 1 compares a spectral region of E. coli cell lysate of a 2D 13C-13C CT TOCSY with a regular 2D 13C-13C TOCSY (Figure S1 shows the full CT-TOCSY spectrum). The presence of homonuclear 1J(13C,13C)-couplings leads to prominent peak splittings with average multiplet widths ~75 Hz, which substantially exceed the intrinsic line widths. In the regular 2D TOCSY these splittings appear along both frequency dimensions leading to severely congested cross-peak regions (Figure 1A). By contrast, the CT-TOCSY (Figure 1B) is decoupled along the ω1 dimension with respect to the dominant 1J(13C,13C)-couplings and therefore displays significantly reduced cross-peak overlap. The resolution enhancement along ω1 over the standard 2D 13C-13C TOCSY amounts on average to a factor >4, improving the average multiplet width from >70 Hz to ~15 Hz, which turned out to be critical for the analysis of a spectrum of the complexity of a cell lysate. The favorable resolution achieved in this way is not a limiting factor any longer, except for the analysis of highly complex carbohydrate mixtures, which could benefit from partial fractionation prior to the NMR experiments.
Figure 1.
Selected region of (A) 13C-13C 2D TOCSY and (B) 13C-13C 2D constant-time (CT) TOCSY of uniformly 13C-labeled E. coli cell lysate. The large resolution improvement along ω1 in the CT-TOCSY experiment enables the extraction of unique traces for their assignment to individual metabolites.
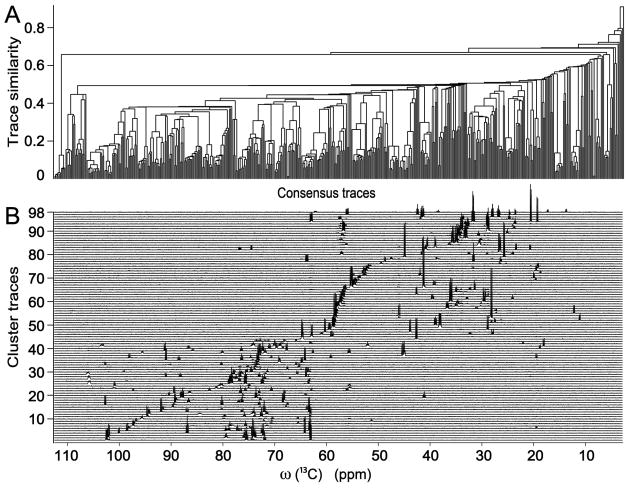
The TOCSY spectrum with a sufficiently long mixing time correlates 13C spins within the same spin system with each other. For linear spin systems, the transfer efficiency over ~10 13C spins is quite efficient for the mixing time of 47 ms used here (see Figure S5). In principle, a cross-section through a cross-peak along ω2 (ω1) represents the homonuclear (de)coupled 13C 1D spectrum of the corresponding spin system.6 However, full or partial peak overlap along one of the frequency domains produces traces that contain additional peaks, which stem from nearby cross-peaks of other mixture components. For more complex mixtures the extraction of ‘pure’ traces is increasingly hard because of the higher likelihood of peak overlaps. To minimize spurious peaks in CT-TOCSY cross sections, a filtering procedure (DeCoDeC) was applied, which generates from a pair of TOCSY traces a consensus trace that contains only peaks that appear in both original traces.7 The consensus trace is notably more robust with respect to partial or complete peak overlaps than either one of the input traces (see Supporting Information for details). The two input traces were taken as cross sections along ω2 through cross-peaks symmetrically placed with respect to the diagonal. The resulting set of consensus traces was then subjected to hierarchical clustering as visualized by the dendrogram in Figure 2A. It permits the straightforward extraction of cluster centers that represent unique spin systems. In this way, 98 spin systems were identified, whose 1D traces are depicted in Figure 2B. Cluster traces with a signal-to-noise ratio as low as ~10:1 were recognized with high fidelity benefitting from the remarkably flat base plane of the 13C-13C CT-TOCSY spectrum, which, unlike 1H-detected NMR spectra, does not suffer from the presence of a strong solvent peak. Remaining peaks with low signal-to-noise (due to low concentration of the corresponding compound) were manually analyzed as discussed below.
Figure 2.
(A) Dendrogram representation of the consensus trace clustering result of 2D CT-TOCSY traces (cross sections) along ω2 of 13C-labeled cell lysate. The x-axis corresponds to the consensus trace indices. (B) 98 semi-automatically determined 13C NMR cluster center traces that represent the clusters of Panel A.
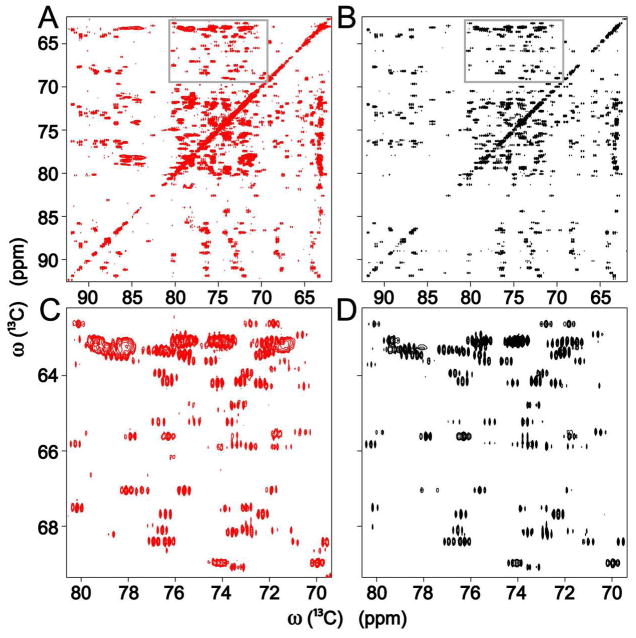
In a next step, from each cluster center trace j of Figure 2B a correlation spectrum Sj was reconstructed containing all 13C-13C cross-peaks expected from its cluster trace as described in the Methods section. The cross-peaks of the original CT-TOCSY T could then be assigned to individual cluster center traces by direct comparison with Sj. Figure 3 depicts selected regions of the CT-TOCSY spectrum (Panels A,C) for comparison with the superposition of all spectra Sj (Panels B,D). Very close agreement in peak positions and multiplet structure between the original and the back-calculated spectrum attest to the high degree of completeness achieved for the assignment of cross-peaks to specific spin systems. This is further illustrated in Figures S3,S4, which depict the connections between 13C-13C cross-peaks for the ribose of adenosine and leucine, respectively, derived from the back-calculated spectra of these 2 metabolites. The cross-peaks that could not be assigned in this way have on average a signal-to-noise S/N ~5, which is a factor 5 lower than the median S/N of the assigned peaks. Based on manual inspection of unassigned cross-peaks an additional 14 spin systems were uncovered, bringing the total number of spin systems identified in the E. coli cell lysate sample to 112.
Figure 3.
13C-13C 2D CT-TOCSY spectrum (A, red) in comparison with spectrum S (B, black), which was back-calculated from the cluster center traces of Figure 2B. Panels C and D show the zoomed regions (gray boxes) of the spectra of Panels A and B, respectively, resolving details of the multiplet patterns.
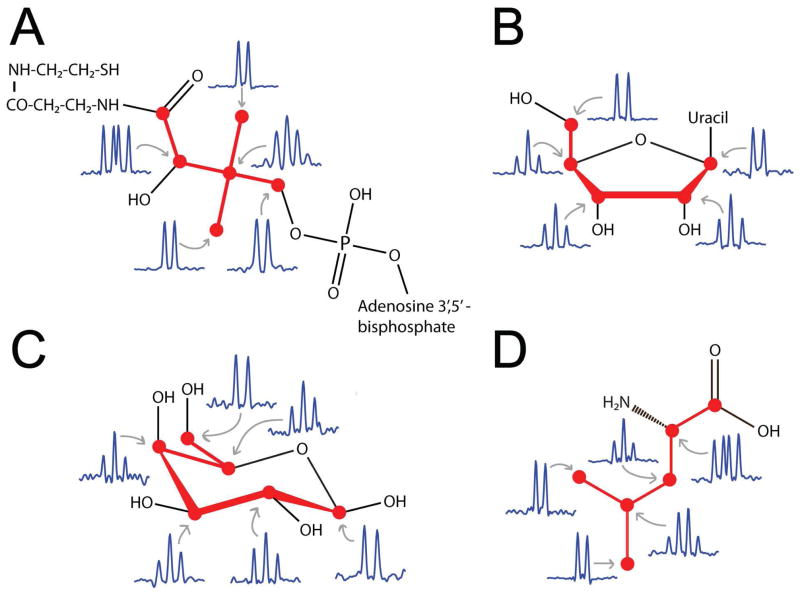
The connectivity information of 13C-13C TOCSY spectra directly reports about covalent carbon-carbon bonds. For this purpose, we used the short-mixing time (4.7 ms) 13C-13C CT-TOCSY spectrum (Tshort) in order to reconstruct the full carbon backbone structures (molecular topologies) of each metabolite. Because the one-bond 1J(13C,13C)-couplings dominate the 2J(13C,13C) and 3J(13C,13C) couplings, a cross-peak in Tshort is direct evidence for the presence of a chemical bond between two carbon atoms. When superimposing a correlation spectrum Sj, reconstructed from cluster center trace j on Tshort, the cross-peaks of Sj that coincide with a cross-peak in Tshort represent a carbon-carbon chemical bond, while 13C pairs that do not show a cross-peak in Tshort do not have a chemical bond between each other. Since the TOCSY spectrum did not cover the carbonyl and carboxyl 13C resonances (~176 ppm) due to 13C radio-frequency offset effects, we used the 13C-13C COSY to establish connectivities to those carbon moieties. From the chemical bond information derived from the Sj spectra, a bond connectivity matrix was derived for each consensus trace, which was then converted into the topology network by graph theory (Figure 4). To independently validate the topologies obtained in this way, the multiplet structure of each TOCSY cross-peak was examined. Carbons that are bonded to one, two, three, or four other carbons show the characteristic multiplet patterns with intensity ratios 1:1, 1:2:1 (or 1:1:1:1), 1:3:3:1, and 1:4:6:4:1, respectively. As is demonstrated in Figure 4 for coenzyme A, the ribose of uridine, β-galactose and leucine, the multiplet patterns provide a rigorous consistency test of the topologies without requiring any additional experiment.
Figure 4.
Backbone carbon topologies of (A) coenzyme A, (B) ribose of uridine, (C) β-galactose, (D) leucine from 13C-13C cross-peak connectivities of 2D CT-TOCSY at short mixing time (τm = 4.7 ms) and from 13C-multiplet patterns along the ω2 dimension in CT-TOCSY.
All 112 identified metabolite topology networks were tested for consistency in this manner. The sum of all topologies, termed the metabolite ‘topolome’, is depicted in Figure 5A. It consists of 10 different topology types (Figure 5B), which include up to 7 carbons (note that topologies with a single carbon are not included here because they do not give rise to a 13C TOCSY or COSY cross-peak). The observed occurrences of each topology, listed in Figure 5B, range between 1 (topologies b,c,d) and 31 (topology g). It should be noted that these topologies refer to the carbon spin systems only. For example, the carbon spin system of ribose is linear while its chemical structure is cyclic whereby the ether linkage prevents magnetization transfer between oxygen-linked carbons. Secondary carbons are encountered most often with a relative occurrence of 54%, followed by primary carbons (topological end groups) (45%), tertiary carbons (0.8%), and quarternary carbons (0.2%). The most frequent topology consists of 5 linearly arranged carbons (topology g), whereas the ‘average’ topology has 4.5 linearly arranged carbon atoms. The topolome was then linked to known molecules by screening each cluster center trace against the 1D 13C spectral metabolomics library of the BioMagResDatabank8 using the COLMAR web server.9 This yielded unique molecular assignments of 29 cluster traces (spin systems) belonging to 27 metabolites listed in Figure 5B, which include 12 unliganded amino acids, 6 riboses of larger nucleic-acid containing molecules, and 3 monosaccharides containing six carbons. The majority of these 27 metabolites were also observed in E. coli cell extracts by mass spectrometry.10 The largest discrepancy between the mass spectrometry and NMR results concerns carbohydrates, since the number of hexoses and other 6-carbon sugars detected by NMR (23 compounds) significantly exceeds the one observed by mass spectrometry (11 compounds). Some of these carbohydrate units may be part of as yet uncharacterized or uncatalogued structures, while others may represent isobaric isomers, whose distinction by mass spectrometry is a challenge.11 13C-13C TOCSY traces of carbohydrates provide straightforward access to their carbon topologies, while chemical shift changes uniquely identify the carbon modification sites. For example, all 4 glucosamine-like topologies observed here have the nitrogens attached at their C2 positions, which is the same as for glucosamine. These differences underline the complementarity of these two experimental methods.
Figure 5.
Backbone carbon topolome of E. coli. (A) Display of the backbone carbon topologies of the 112 spin systems of E. coli identified in this study. (B) List of the different topologies identified together with their occurrences (Occ.). Compounds with specific names matched BMRB database compounds, whereas compounds referred to as “others”, “amino-acid like”, or “saccharides” were not contained in the database.
DISCUSSION
High-resolution solution NMR of biological mixtures typically detect hundreds to thousands of peaks of both known and unknown compounds, which can be used for a wide range of applications, including compound identification, quantification, and de novo characterization of unknown species, that cross the boundaries between traditional natural products research and metabolomics.12 While database searching can dramatically accelerate the verification of the presence of known compounds, the characterization of unknown compounds remains a major challenge. The classical approach, which is the method of choice in natural products research, uses chromatographic separation until individual compounds are isolated so that they can be further characterized individually. Because this approach is too time-consuming for metabolomics-type applications, methods are needed that do not require extensive fractionation. Here, we introduced a multidimensional NMR-based approach for both types of analysis of metabolite mixtures of uniformly 13C-labeled organisms. The favorable spectral resolution and baseline properties of the 13C-13C TOCSY correlation spectra allow a rigorous, semi-automated analysis of the mixture in terms of the carbon-backbone topologies of the underlying components with concentrations in the sub-mM to hundreds of mM range. This permitted the reconstruction of the full topolome consisting of 112 spin systems or chemical species detectable by NMR. From the cluster center traces, each representing a metabolite 13C spin system, a remarkably complete reconstruction of the CT-TOCSY could be achieved (Figure 3), which accounts for over 94% of all observable CT-TOCSY cross-peaks. Resonances that are not accounted for either have very low signal-to-noise or they fall into the few highly crowded regions, such as the ones around 70–72 ppm and 84–86 ppm (Figures 3 and S1). In addition, analysis of the multiplet pattern of each 13C resonance permitted independent validation of each topology. Together, these methods enable the rapid and reliable identification of the very large number of topologies reported here. This approach represents a significant advance over alternative methods of chemical structure determination in complex mixture.13 An additional advantage of direct 13C detection is that non-protonated carbons can be directly detected, including carbonyl and carboxyl carbons whose correlations with other carbons are obtained from the 13C-13C COSY. Since carbonyl and carboxyl carbons possess significantly larger 1J(13C,13C)-couplings (~55 Hz) than most other C-C bonds (~35 Hz), multiplet patterns observed in CT-TOCSY independently validate the carbonyl and carboxyl substituents observed in the 13C-13C COSY experiment. For example, in Figure 4D the resonances of leucine Cα and Cβ, which are both secondary carbons, show the distinct multiplet patterns 1:1:1:1 and 1:2:1, respectively, consistent with the attached carboxyl group to Cα.
The topolome detected for E. coli reveals that the most frequent topology with 31 occurrences is linear containing 5 sequentially bonded carbons (topology g in Figure 5). This topology comprises glutamate and 8 glutamate-like compounds or spin systems. It also includes 13 riboses and only 1 deoxyribose, reflecting the larger structural and functional diversity of ribose-containing molecules over deoxyribose-containing molecules. The method differentiates between isomers that slowly interconvert on the NMR chemical shift timescale. The second most frequent topology with 27 occurrences is topology e (6 linearly arranged carbons). Topology e includes 12 aldohexoses, comprising the common monosaccharides glucose and galactose, serving both as energy sources and structural building blocks in the cell. An advantage of NMR-based topology analysis is that quantitative chemical shift information at each carbon site is available. Aldohexoses detected here generally exhibit a 5–10 ppm 13C chemical shift increase in the 1C or 4C positions (or both) compared to monosaccharides. Since these positions are the common glycosidic linkage sites with other molecular groups, the unknown aldohexoses might be part of larger chemical structures, such as polysaccharides (whereby the oxygens involved in these linkages divide the carbons into separate spin systems that are not connected by TOCSY cross-peaks). Certain amino sugars, such as N-acetylglucosamine and N-acetylmuramic acid present in the cell lysate in 4 different forms, share the same topology as the aldohexoses (topology e). The third most frequent topology with 24 occurrences is topology i (3 linearly arranged carbons). Topology i is adopted by 7 alanine-like compounds and topology a includes 2 diaminopimelic-acid like topologies. Because the prevalent glutamate, alanine, diaminopimelic acid, N-acetylglucosamine and N-acetylmuramic acid form the basic building blocks of the peptidoglycan cell wall of E. coli, these topologies might belong to cell wall fragments.14 Knowledge of metabolite topologies provides an ideal basis for further characterization. Since NMR 13C chemical shifts with their high sensitivity to substituents are obtained simultaneously with the topologies, they should assist further chemical structure determination of selected mixture components. The presence of substituents predicted from 13C chemical shifts can be corroborated by additional NMR experiments that display additional correlations, for example, to 31P, 15N, and 1H nuclei.
The resolution power resulting from the combination of consensus trace clustering with homonuclear 13C CT-TOCSY spectroscopy produces a unique and exhaustive set of carbon topologies of components of a mixture of ultra high complexity as demonstrated here for a uniformly 13C-labeled cell lysate. This kind of information should prove powerful for the exploration and establishment of new biochemical pathways and interactions involving 13C-labeled endogenous and exogeneous metabolites. Uniform 13C-labeling of many organisms, such as bacteria, yeast and plants, is now readily available and, hence, this NMR strategy can give broad access to the complex chemical information necessary for a systems biological understanding of their function.
MATERIALS AND METHODS
Sample preparation
BL21(DE3) cells were cultured in M9 minimum medium as previously described7,15 with [U-13C]glucose added as sole carbon source. One liter of overnight BL21(DE3) culture was centrifuged at 5000×g for 20 min at 4 °C, and the cell pellet was resuspended in 50 mL of 50 mM phosphate buffer at pH 7.0. Cell suspension was then subjected to centrifugation for cell pellet collection. The cell pellet was resuspended in 60 mL of ice cold water, and pre-chilled methanol and chloroform were sequentially added under vigorous vortex at H2O:methanol:chloroform ratios of 1:1:1. The mixture was then left at −20 °C overnight for phase separation. Next, it was centrifuged at 4000×g for 20 min at 4 °C, and the clear top hydrophilic phase was collected and subjected to rotary evaporator processing to have the methanol content reduced. Finally the liquid was lyophilized. The NMR sample was prepared by dissolving the lyophilized material in D2O.
NMR experiments
2D 13C-13C CT-TOCSY data sets were collected with 576×2048 (N1xN2) complex points with a long (47 ms) and a short (4.7 ms) mixing time, respectively, using FLOPSY-16 with 22 hours measurement time and a digital resolution of 38 Hz along ω1 prior to zero filling.16 Standard 2D 13C-13C TOCSY data were collected with 512×2048 (N1xN2) complex points using a 46 ms mixing time using DIPSI-2 for mixing.17 Both 2D 13C-13C CT-TOCSY and 2D 13C-13C TOCSY were collected with 110 ppm 13C spectral width. The 2D 13C-13C COSY data set was collected with 1024×1024 (N1xN2) complex data points with 202.5 ppm 13C spectral width. All NMR spectra were collected at 800 MHz proton frequency at 25 °C. The NMR data were zero-filled, Fourier transformed, phase and baseline corrected using NMRPipe,18 and converted to a MATLAB-compatible format for subsequent clustering and analysis.
CT-TOCSY spectrum reconstruction from cluster center traces
For each cluster center trace along ω2, (where superscript r denotes a row vector), the corresponding CT-TOCSY trace along ω1 was selected, which is represented by the column vector (where superscript c denotes a column vector) (see Supporting Information). For each trace pair ( ) a N1xN2 correlation spectrum was reconstructed according to and superimposed on the TOCSY spectrum for cross-peak assignment and validation. Since , but not , is decoupled because of the constant-time TOCSY scheme, Sj is also decoupled along ω1 while it shows the full multiplet fine structure along ω2. Therefore, the peak positions and cross-peak fine structures of Sj are identical to the ones of the experimental CT-TOCSY spectrum. Comparison of the sum of all sub-spectra over all M compounds (spin systems), , with the CT-TOCSY spectrum shows the near completeness of CT-TOCSY cross-peak assignment of the E. coli cell lysate (Figures 3B,D).
Supplementary Material
Acknowledgments
We thank Dr. Timothy Logan for his careful reading of the manuscript. This work was supported by the National Institutes of Health (grant R01 GM066041). The NMR experiments were conducted at the National High Magnetic Field Laboratory supported by cooperative agreement DMR 0654118 between the National Science Foundation and the State of Florida.
Footnotes
The authors declare no competing financial interest.
Flow chart and detailed description of spectral analysis, reconstruction of spectra for the assessment of completeness, display of entire 2D 13C-13C CT-TOCSY and 13C-13C COSY spectra, and display of TOCSY transfer efficiency in linear 13C-spin chain (1 scheme and 5 figures). This material is available free of charge via the Internet at http://pubs.acs.org.
References
- 1.Lindon JC, Nicholson JK, Holmes E. The Handbook of Metabonomics and Metabolomics. Elsevier; 2007. [Google Scholar]; Dettmer K, Aronov PA, Hammock BD. Mass Spectrom Rev. 2007;26:51–78. doi: 10.1002/mas.20108. [DOI] [PMC free article] [PubMed] [Google Scholar]
- 2.Forseth RR, Schroeder FC. Curr Opin Chem Biol. 2011;15:38–47. doi: 10.1016/j.cbpa.2010.10.010. [DOI] [PMC free article] [PubMed] [Google Scholar]
- 3.Braunschweiler L, Ernst RR. J Mag Reson. 1983;53:521–528. [Google Scholar]; Bax A, Davis DGJ. Mag Reson. 1985;65:355–360. [Google Scholar]
- 4.Eisenreich W, Kupfer E, Weber W, Bacher A. J Biol Chem. 1997;272:867–74. doi: 10.1074/jbc.272.2.867. [DOI] [PubMed] [Google Scholar]
- 5.Eletsky A, Moreira O, Kovacs H, Pervushin K. J Biomol NMR. 2003;26:167–79. doi: 10.1023/a:1023572320699. [DOI] [PubMed] [Google Scholar]
- 6.Zhang F, Brüschweiler R. Angew Chem Int Ed. 2007;46:2639–2642. doi: 10.1002/anie.200604599. [DOI] [PubMed] [Google Scholar]
- 7.Bingol K, Brüschweiler R. Anal Chem. 2011;83:7412–7. doi: 10.1021/ac201464y. [DOI] [PMC free article] [PubMed] [Google Scholar]
- 8.Ulrich EL, Akutsu H, Doreleijers JF, Harano Y, Ioannidis YE, Lin J, Livny M, Mading S, Maziuk D, Miller Z, Nakatani E, Schulte CF, Tolmie DE, Wenger RK, Yao HY, Markley JL. Nucl Acids Res. 2008;36:D402–D408. doi: 10.1093/nar/gkm957. [DOI] [PMC free article] [PubMed] [Google Scholar]
- 9.Robinette SL, Zhang F, Bruschweiler-Li L, Brüschweiler R. Anal Chem. 2008;80:3606–3611. doi: 10.1021/ac702530t. [DOI] [PubMed] [Google Scholar]
- 10.Bennett BD, Kimball EH, Gao M, Osterhout R, Van Dien SJ, Rabinowitz JD. Nat Chem Biol. 2009;5:593–9. doi: 10.1038/nchembio.186. [DOI] [PMC free article] [PubMed] [Google Scholar]
- 11.Mutenda KE, Matthiesen R. Methods Mol Biol. 2007;367:289–301. doi: 10.1385/1-59745-275-0:289. [DOI] [PubMed] [Google Scholar]
- 12.Robinette SL, Brüschweiler R, Schroeder FC, Edison AS. Acc Chem Res. 2012;45:288–7. doi: 10.1021/ar2001606. [DOI] [PMC free article] [PubMed] [Google Scholar]
- 13.Zhang F, Bruschweiler-Li L, Brüschweiler R. J Am Chem Soc. 2010;132:16922–7. doi: 10.1021/ja106781r. [DOI] [PMC free article] [PubMed] [Google Scholar]
- 14.Kim BH, Gadd GM. Bacterial physiology and metabolism. Cambridge University Press; 2008. [Google Scholar]
- 15.Hyberts SG, Heffron GJ, Tarragona NG, Solanky K, Edmonds KA, Luithardt H, Fejzo J, Chorev M, Aktas H, Colson K, Falchuk KH, Halperin JA, Wagner G. J Am Chem Soc. 2007;129:5108–5116. doi: 10.1021/ja068541x. [DOI] [PMC free article] [PubMed] [Google Scholar]
- 16.Kadkhodaie M, Rivas O, Tan M, Mohebbi A, Shaka AJ. J Mag Reson. 1991;91:437–443. [Google Scholar]
- 17.Shaka AJ, Lee CJ, Pines A. J Mag Reson. 1988;77:274–293. [Google Scholar]
- 18.Delaglio F, Grzesiek S, Vuister GW, Zhu G, Pfeifer J, Bax A. J Biomol NMR. 1995;6:277–93. doi: 10.1007/BF00197809. [DOI] [PubMed] [Google Scholar]
Associated Data
This section collects any data citations, data availability statements, or supplementary materials included in this article.


