

Abstract
Non-polar solvents like hexane allow ionization of insoluble drugs, peptides, nucleotides and phospholipids as solids from paper. Ambient ionization is achieved simply by application of a high voltage to the wet paper. Transport and ionization mechanisms are discussed, including the possibility of field desorption from dendritic structures formed on the paper.
Polar compounds are traditionally ionized in mass spectrometry as solids using desorption ionization methods, including matrix-assisted laser desorption ionization (MALDI)1 and secondary ion mass spectrometry (SIMS).2 Alternatively, they can be ionized as solutes in polar solvents using electrospray ionization (ESI).3,4 Ambient ionization methods5-7 provide new options for ionizing polar compounds. However, despite the role of charged non-polar (oil) droplets, as in the experiment of Millikan,8 non-polar solvents are not successful in ESI without admixture of polar solvents9,10 or ionic liquids.11 Desorption electrospray ionization (DESI)12 allows a different solvent to be used for ionization from that used to deposit the sample: thus both can be optimized independently.13
Here we report the use of non-polar solvents in the recently-developed ambient ionization method of paper spray mass spectrometry.14 A paper triangle wetted with hexane, toluene or dioxane, produces a spray of non-polar solvent droplets when a relatively low positive or negative voltage (0.8 ≈ 2 kV) is applied. The spray occurs at the tip of the paper, and is presumably due to field-assisted evaporation, while transport of the solvent is the result of capillary action through the micro-channels in the paper substrate. Polar organic compounds are largely insoluble in these solvents, nevertheless, polar or ionic analytes deposited on the paper are transported by the non-polar solvent, released into field-evaporated non-polar droplets and enter the mass spectrometer.
This gentle new method of ionization is applicable to a wide range of biological compounds including peptides, small nucleotides, phospholipids and other compounds. The ions observed are mostly (M + H)+ and (M + Na)+ ions in the positive mode and (M – H)− ions in the negative mode. The spray currents, measured as described elsewhere,14 were usually ~1 nA when the voltage was in the normal range (below 2 kV). The method is characterized by (i) low detection limits (ii) low internal energy deposition (iii) compatibility with prior experiments that require aqueous or polar solvents, including prior chromatographic separations. Examples of these and other characteristics are presented in what follows.
While a solvent can be applied in the batch mode, continuous supply at a controlled speed improves the stability of the paper spray ion signal. A silica capillary touching the center of the paper triangle continuously supplies the solvent, typically at 10 μL min−1. (Fig. 1a). When paper spraying n-hexane, droplets are visible in the spray plume under strong illumination, Fig. 1b. With the more volatile hydrocarbon n-pentane, the droplets are not visible but their presence can be inferred from the formation of dendritic ice crystals resulting from the rapid cooling of water vapor in the air when the pentane droplets vaporize (Fig. 1c, ESI† sec. 3).
Fig. 1.
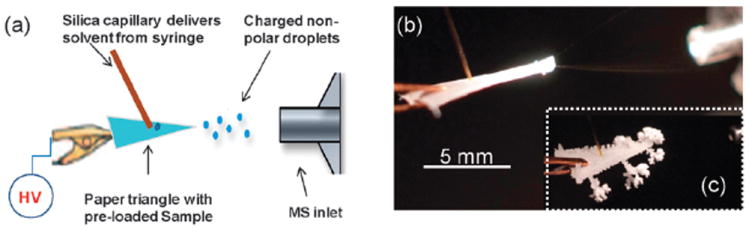
(a) Illustration of experimental set up; (b) paper spray plume under illumination when using hexane as the solvent; (c) rapid pentane evaporation condenses atmospheric water vapor forming ice dendrites.
A typical spectrum using non-polar solvent paper spray is provided by the lipid cholesterol sulfate. A small amount (1 μL) of sample (3 μg mL−1, methanol/water, 1 : 1 v/v) was deposited on a paper triangle and allowed to dry. When a potential of −2 kV was applied and n-hexane added, the negative ion mass spectrum shown in Fig. 2d was recorded. The presence of sulfur is evident from the isotopic distribution in the [M – H]− signal. No fragment ions are observed. A variety of other compounds including the dinucleotides and phospholipids shown in Fig. 2, have been ionized by paper spray in the negative ion mode. Similar data were obtained for pharmaceuticals like ibuprofen (ESI†, Fig. S3). Analogous data were recorded in the positive ion mode.
Fig. 2.
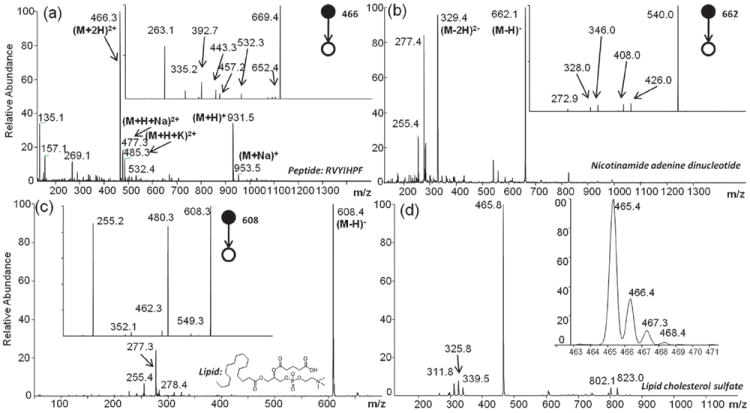
Paper spray mass spectra of analytes deposited on paper wetted with n-hexane. (a) Angiotensin III (500 ng), mass spectrum and MS/MS product ion spectrum of (M + 2H)+ ion. (b) Nicotinamide adenine dinucleotide (500 ng); insets are isotopic distribution of molecular ion and MS/MS spectrum of the (M – H)− ion. (c) 1-Palmitoyl-2-glutaryl-sn-glycero-3-phosphocholine (500 ng); insets are isotopic distribution of molecular ion and MS/MS spectrum of the (M – H)− ion. (See ESI†, Fig. S5 for positive ion mode spectrum.) (d) Cholesterol sulfate (3 ng), insets are isotopic distribution of molecular ion and MS/MS spectrum of the (M – H)− ion.
As shown in the ESI†, Fig. S1, no signal was observed for angiotensin III until the paper was wetted with hexane. The mass spectrum, Fig. 2a, showed (M + H)+ and (M + 2H)2+ ions accompanied by small amounts of sodiated (M + H + Na)2+ and potassiated (M + H + K)2+ species. The MS/MS spectrum of the (M + 2H)+ ions yielded sequence specific fragments (see ESI† sec. 4). Besides peptides, several drugs were also examined; (M + H)+ ions were generated for verapamil and amitriptyline, as shown in ESI†, Fig. S3. The analytical performance of non-polar paper spray is limited by the background peaks generated by species in the paper substrate. Nevertheless, precision is <20% in the ng range and low limits of detection are achieved, e.g. in the MS/MS mode 20 pg (amount loaded on paper) of amitriptyline can be detected.
A variant on this paper spray method was used to characterize analytes that are soluble in non-polar solvents. Instead of depositing the analyte on the paper and analyzing using a non-polar solvent, as just described, these analytes can be analyzed directly from solution. There is no corresponding capability in ESI or nanoESI, as was demonstrated by the analysis of 4,4′-methylene-bis(N,N-dimethylaniline) dissolved in hexane. In this version of experiment, the sample solution was fed continuously onto the blank paper triangle via a silica capillary (used to deliver the pure solvent in the experiment of Fig. 1a). Protonated molecules were generated in the mass spectrum, see ESI†, Fig. S6.
The non-polar spray is also effective in analyzing non-functionalized hydrocarbon samples. A sample of a high boiling pump oil was dissolved in hexane and ionized directly without vaporization (which is difficult to achieve); note that much higher voltages and higher currents (ca. 1 μA) were needed for these non-functionalized analytes. The types of ions observed match those observed in previous APCI experiments15 and in discharge-induced oxidative DESI experiments.16 Discharge under ambient condition produces ions corresponding to [M – H]+, [M – H + nO]+, [M – 3H + nO]+, etc. for this experiment, as verified by exact mass measurements reported in the ESI†, S7.
Non-polar solvents are used extensively in synthesis and separations and this makes it desirable that solution-phase samples be ionized directly from such solutions under ambient conditions. The polar analyte/non-polar solvent experiment provides this capability while avoiding a difficulty with ESI methodologies arising from capillary clogging by the precipitated analyte due to non-ideal solvent choices. As is the case for conventional polar solvent paper spray, TLC-separated components can be identified by ionization of the separated spots (shown for three drugs in ESI†, sec.7).
It is interesting to compare the non-polar solvent paper spray experiments just described, with other methods of soft ionization reported in the recent literature.17-19 Of particular interest is the ultrasound ionization method, in which interfacial physical and chemical changes initiate the ionization and desorption of various analytes, including insoluble compounds.
In the paper spray experiment using non-polar solvents, one assumes that the electric field gradient is strongest at the paper tip (ESI†, sec. 8). The voltage drop at the paper tip plays a role in charged droplet formation with non-polar solvents just it does with polar solvents. To maintain a constant electrospray from the liquid surface, the electric field at the liquid–air interface is assumed to generate charged droplets by the usual mechanism in which the field in the liquid balances its surface tension,20
Here, ρ is the surface tension of the liquid, ε0 is the permittivity of air, r0 is the capillary radius and θ0 is the cone half-angle assumed by Taylor.21 In the case of paper spray, the electrode (i.e. the paper tip) is close to the air–liquid interface so we can assume similar θ0 and r0 for all types of solvents. However, the non-polar solvents (pentane, hexane and heptane) have surface tensions in the range 15 to 20 mN m−1, somewhat smaller than the values of most polar solvents (water 72mN m−1, methanol 22 mN m−1). The lower surface tension is believed to be the reason for the lower onset spray voltage. The analyte ionization mechanism is still obscure but likely involves field desorption22,23 from dendrites, perhaps the observed ice crystal dendrites the growth of which may be assisted by the microfibers of the cellulose paper.
The process by which insoluble analytes move through the paper substrate is also of considerable interest. Transport of analyte to the tip may be the result of “inch-worm” or hopping motions between adjacent cellulose platelets, analogous to the hopping motions between chromatography stationary phase components described elsewhere.24 Even though the analytes are insoluble, the interaction energy between analyte and solvent25 could partially compensate for the energy involved in transfer between cellulose sections. The solvent seems to play a supporting role in analyte transport as suggested by the fact that analytes with hydrophobic moieties are preferentially transported and ionized. Evidence for this is seen in the data for several pharmaceutical drugs with similar molecular weights but different hydrophobicities (e.g. doxorubicin vs. amitriptyline, ESI† sec. 4).
In conclusion, these experiments show that non-polar solvents such as hexane can be used to assist in the ionization of (i) solid analytes deposited on paper including pharmaceutical drugs, nucleotides, phospholipids, cholesterol derivatives, small peptides and various hydrocarbons and (ii) solutions of hydrocarbons and many low molecular weight compounds that are soluble in non-polar solvents. Paper spray of non-polar solvents widens the choice of methods for direct, online analysis of synthetic mixtures, including normal phase chromatographic eluents26 and liquid phase extracts. Considering the hydrophobicity, polarity and conductivity of the solvent, the generation of individual ions from non-polar droplets could be significantly different to the process in polar solvents.27-29
Supplementary Material
Footnotes
Electronic supplementary information (ESI) available: General experimental details; formation of ice dendrites during pentane spray; analysis of solution samples; analysis of hydrocarbons and other details mentioned in this communication. See DOI: 10.1039/c0cc05513a
Contributor Information
Zheng Ouyang, Email: ouyang@purdue.edu.
R. Graham Cooks, Email: cooks@purdue.edu.
Notes and references
- 1.Reyzer ML, Caprioli RM. J Proteome Res. 2005;4:1138–1142. doi: 10.1021/pr050095+. [DOI] [PubMed] [Google Scholar]
- 2.Winograd N. Anal Chem. 2005;77:142A–149A. doi: 10.1021/ac051263k. [DOI] [PubMed] [Google Scholar]
- 3.Fenn JB, Mann M, Meng CK, Wong SF, Whitehouse CM. Science. 1989;246:64–71. doi: 10.1126/science.2675315. [DOI] [PubMed] [Google Scholar]
- 4.Cole R. Electrospray and MALDI Mass Spectrometry: Fundamentals, Instrumentation, Practicalities, and Biological Applications. 2. John Wiley & Sons; 2010. [Google Scholar]
- 5.Ifa DR, Wu C, Ouyang Z, Cooks RG. Analyst. 2010;135:669–681. doi: 10.1039/b925257f. [DOI] [PubMed] [Google Scholar]
- 6.Weston DJ. Analyst. 2010;135:661–668. doi: 10.1039/b925579f. [DOI] [PubMed] [Google Scholar]
- 7.Chen HW, Gamez G, Zenobi R. J Am Soc Mass Spectrom. 2009;20:1947–1963. doi: 10.1016/j.jasms.2009.07.025. [DOI] [PubMed] [Google Scholar]
- 8.Millikan RA. Phys Rev. 1913;2:109. [Google Scholar]
- 9.Van Berkel GJ, McLuckey SA, Glish GL. Anal Chem. 1991;63:1098–1109. doi: 10.1021/ac00018a014. [DOI] [PubMed] [Google Scholar]
- 10.Duffin KL, Henion JD, Shieh JJ. Anal Chem. 1991;63:1781–1788. doi: 10.1021/ac00017a023. [DOI] [PubMed] [Google Scholar]
- 11.Henderson MA, McIndoe JS. Chem Commun. 2006:2872–2874. doi: 10.1039/b606938j. [DOI] [PubMed] [Google Scholar]
- 12.Takats Z, Wiseman JM, Gologan B, Cooks RG. Science. 2004;306:471–473. doi: 10.1126/science.1104404. [DOI] [PubMed] [Google Scholar]
- 13.Badu-Tawiah A, Bland C, Campbell DI, Cooks RG. J Am Soc Mass Spectrom. 2010;21:572–579. doi: 10.1016/j.jasms.2009.12.012. [DOI] [PubMed] [Google Scholar]
- 14.Wang H, Liu J, Cooks R, Ouyang Z. Angew Chem. 2010;122:889–892. doi: 10.1002/anie.200906314. [DOI] [PubMed] [Google Scholar]
- 15.Kolakowski BM, Grossert JS, Ramaley L. J Am Soc Mass Spectrom. 2004;15:311–324. doi: 10.1016/j.jasms.2003.10.019. [DOI] [PubMed] [Google Scholar]
- 16.Wu C, Qian K, Nefliu M, Cooks RG. J Am Soc Mass Spectrom. 2009;21:261–267. doi: 10.1016/j.jasms.2009.10.006. [DOI] [PubMed] [Google Scholar]
- 17.Wu C-I, Wang Y-S, Chen NG, Wu C-Y, Chen C-H. Rapid Communications in Mass Spectrometry. 2010;24:2569–2574. doi: 10.1002/rcm.4677. [DOI] [PubMed] [Google Scholar]
- 18.Lin S-Y, Huang M-Z, Chang H-C, Shiea J. Anal Chem. 2007;79:8789–8795. doi: 10.1021/ac070590k. [DOI] [PubMed] [Google Scholar]
- 19.Dixon RB, Sampson JS, Muddiman DC. J Am Soc Mass Spectrom. 2009;20:597–600. doi: 10.1016/j.jasms.2008.11.024. [DOI] [PubMed] [Google Scholar]
- 20.Smith DPH. IEEE Trans Ind Appl. 1986;22:527–535. [Google Scholar]
- 21.Taylor G. Proc R Soc London Ser A. 1964;280:383–397. [Google Scholar]
- 22.Beckey HD, Schulten HR. Angew Chem Int Ed Engl. 1975;14:403–415. [Google Scholar]
- 23.Chan KWS, Cook KD. Anal Chem. 1983;55:1306–1309. [Google Scholar]
- 24.Adamson AW, Slawson V. J Phys Chem. 1981;85:116–119. [Google Scholar]
- 25.Lauterbach M, Engler E, Muzet N, Troxler L, Wipff G. J Phys Chem B. 1998;102:245–256. [Google Scholar]
- 26.Snyder L, Kirkland J, Dolan J. Introduction to Modern Liquid Chromatography. John Wiley & Sons; 2009. [Google Scholar]
- 27.Iribarne JV, Thomson BA. J Chem Phys. 1976;64:2287–2294. [Google Scholar]
- 28.Dole MM, L L, Hines RL, Mobley RC, Ferguson LD, Alice MB. J Chem Phys. 1968;49:2240–2249. [Google Scholar]
- 29.Wang R, Zenobi R. J Am Soc Mass Spectrom. 2010;21:378–385. doi: 10.1016/j.jasms.2009.10.022. [DOI] [PubMed] [Google Scholar]
Associated Data
This section collects any data citations, data availability statements, or supplementary materials included in this article.