Background: Myosin cross-bridges containing phosphorylated and dephosphorylated regulatory light chain may be different.
Results: Relaxed cross-bridges, but not active ones, are better ordered in muscle containing dephosphorylated RLC than phosphorylated RLC; they both rotate equally slowly. During contraction phosphorylated cross-bridges rotate faster.
Conclusion: Both types of cross-bridges are functionally different.
Significance: Phosphorylation of skeletal myosin RLC plays a role in regulation of skeletal muscle contraction.
Keywords: Confocal Microscopy, Contractile Protein, Mechanotransduction, Muscle, Myosin, Phosphorylation, Fluorescence Correlation Spectroscopy, Phosphorylation of the RLC, Fluorescence Polarization, Skeletal Myosin Cross-bridge
Abstract
Calcium binding to thin filaments is a major element controlling active force generation in striated muscles. Recent evidence suggests that processes other than Ca2+ binding, such as phosphorylation of myosin regulatory light chain (RLC) also controls contraction of vertebrate striated muscle (Cooke, R. (2011) Biophys. Rev. 3, 33–45). Electron paramagnetic resonance (EPR) studies using nucleotide analog spin label probes showed that dephosphorylated myosin heads are highly ordered in the relaxed fibers and have very low ATPase activity. This ordered structure of myosin cross-bridges disappears with the phosphorylation of RLC (Stewart, M. (2010) Proc. Natl. Acad. Sci. U.S.A. 107, 430–435). The slower ATPase activity in the dephosporylated moiety has been defined as a new super-relaxed state (SRX). It can be observed in both skeletal and cardiac muscle fibers (Hooijman, P., Stewart, M. A., and Cooke, R. (2011) Biophys. J. 100, 1969–1976). Given the importance of the finding that suggests a novel pathway of regulation of skeletal muscle, we aim to examine the effects of phosphorylation on cross-bridge orientation and rotational motion. We find that: (i) relaxed cross-bridges, but not active ones, are statistically better ordered in muscle where the RLC is dephosporylated compared with phosphorylated RLC; (ii) relaxed phosphorylated and dephosphorylated cross-bridges rotate equally slowly; and (iii) active phosphorylated cross-bridges rotate considerably faster than dephosphorylated ones during isometric contraction but the duty cycle remained the same, suggesting that both phosphorylated and dephosphorylated muscles develop the same isometric tension at full Ca2+ saturation. A simple theory was developed to account for this fact.
Introduction
Ca2+ binding to thin filament is a major element controlling active force in skeletal muscle. The amount of generated force is regulated by the amount of Ca2+ released into the muscle cell and state of phosphorylation of RLC2 (1, 2). Skeletal myosin RLC is phosphorylated by Ca2+-calmodulin-myosin light chain kinase but this produces little change in phosphorylation during a single twitch or short tetanus (3). In inactive muscle, a phosphatase dephosphorylates the RLC, and the extent of dephosphorylation depends on the time of incubation (3). Thus, the level of myosin phosphorylation depends on the recent history of muscle activation and increases dramatically during heavy use and fatigue (3, 4). The endogenous level of RLC phosphorylation also appears crucial for determining the degree of changes in Ca2+ sensitivity of force generation (2). A similar phenomenon was observed in cardiac muscle when basal phosphorylation of RLC played a role in the kinetics of force development and its sensitivity to Ca2+ (5).
Recent evidence points to the fact that contraction of vertebrate striated muscles, such as used in this study, is in addition to Ca2+ binding to thin filaments, directly controlled by the phosphorylation of RLC. The first clue came from the work of Ferenczi et al. (6) who observed that ATPase of purified frog myosin was several times higher than the rate of oxygen consumption of living, relaxed muscle. Craig et al. (7) and Cooke (8) first suggested that the discrepancy between ATPase activity of purified myosin and the metabolic rate in intact skeletal muscle may be controlled by phosphorylation of RLC, which is associated with the degree of order of cross-bridges. Electron microscopy demonstrated that the helically ordered arrangement of myosin heads, characteristic of the relaxed state, is lost upon phosphorylation of RLC (RLC-P) in thick filaments isolated from striated muscles of tarantula (9), limulus (10), and rabbit psoas muscle (11). Recent x-ray diffraction work showed that phosphorylation of RLC caused a net change in cross-bridge mass distribution as they moved away from the surface of thick filaments and closer to the thin filament (12). CryoEM work using the three-dimensional reconstruction of tarantula myosin filaments demonstrated the mechanism by which phosphorylation can regulate myosin activity (13). Electron paramagnetic resonance (EPR) work using nucleotide-analog spin label probes showed highly ordered myosin heads in relaxed fibers, when all the heads are dephosphorylated. This ordered structure of myosin cross-bridges disappeared with RLC phosphorylation (14). A new super-relaxed state (SRX) was defined in skinned skeletal (15) and cardiac muscle fibers (16) where myosin has a very low ATP turnover rate. This SRX state corresponds to the highly ordered array of myosin heads in the absence of RLC-P that can be switched to a disordered array of myosin heads by RLC-P (8).
In this article we examine whether dephosphorylated RLCs form ordered cross-bridges, whether phosphorylation destroys this array, and whether rotational motion of phosphorylated and dephosphorylated cross-bridges is different. We used a more discerning method than the conventional measurements of orientation carried out using wide-field fluorescence microscopy (17–24) or EPR (25, 26). The conventional methods report the average orientation and distribution of 109–1012 myosin cross-bridges. Here, we monitor the orientation and rotational mobility of a few myosin cross-bridges in a single half-sarcomere.
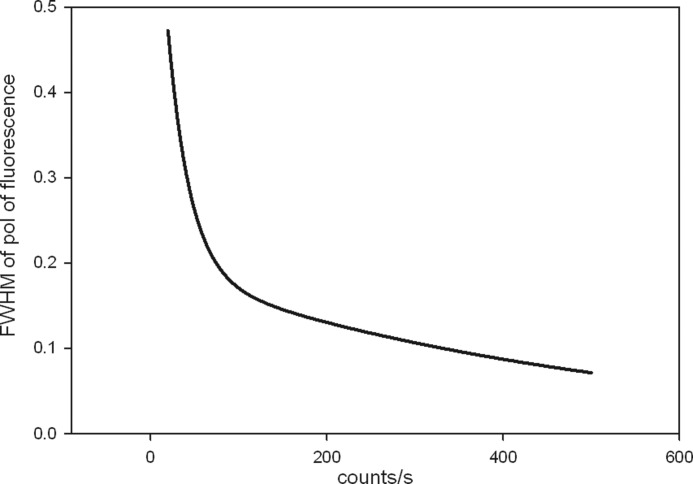
There are three fundamental reasons why working with few (<50) cross-bridges in a single half-sarcomere is the correct way to approach this problem. (I) It is only possible to determine the average orientation from a large population of cross-bridges when all the cross-bridges are immobile and assume the same orientation, e.g. in well oriented skeletal muscle in rigor (21–24, 26). However, cross-bridges in relaxed or active muscle are mobile and arranged with a certain probability distribution, around some unknown average. The relative width of this average, defined as full width at half-maximum (FWHM),3 is sharply dependent on the strength of a signal. This is due to the stochastic nature of the signal. FWHM is relatively narrow for strong signals and relatively broad for weak signals. We calculate the effect of signal strength on FWHM in the next paragraph (Fig. 1 and supplemental Fig. S1). The bottom line of these calculations is that the differences between FWHMs are too small to be resolved when the number of cross-bridges is large. (II) The kinetics of the process can be obtained from fluctuations only when a population is small. These fluctuations are large only when the number of molecules is sufficiently small (27). This is called the “mesoscopic” approach, first applied to biological problems by Elson and co-workers (28, 29). Observing too many cross-bridges averages the signal and destroys the kinetic information. For example, only 10−4 % (√N/N) of a signal from muscle fiber containing n = 1012 randomly oriented cross-bridges carries kinetic information. The rest is an average and carries no kinetic information. It is impossible to detect 10−4 % of the signal. On the other hand, if the number of cross-bridges is n = 102, 10% of the signal carries kinetic information. In the mesoscopic regime, dynamic and steady-state behavior can be examined in great detail because averaging is minimized. Although it is possible to obtain kinetic information by imposing transients (30–32), it is non-steady-state information. (III) The final reason why it is important that the measurements be carried out on a small number of cross-bridges confined to the single half-sarcomere is that possible in-homogeneities between different sarcomeres are minimized.
FIGURE 1.
The dependence of FWHM of polarized fluorescence on the strength of a random Gaussian signal. The FWHM depends only on the total amount of signal. The exact dependence is: y = 0.63333exp(−0.0398×) + 0.1942exp(−0.002×).
Our first task is to compare the width of the population distribution of phosphorylated cross-bridges to the width of the population distribution of dephosphorylated ones. As mentioned before, the problem with this kind of comparison is that the uncertainty in measurements of a random variable depends on the number of cross-bridges contributing to the signal. When comparing distribution of two random Gaussian series (such as photon counts from phosphorylated and dephosphorylated muscle) it is crucial that the average signal (number of cross-bridges) in each series be the same. If not, one can get it wrong because the relative error (FWHM) is small for large signals and large for small signals. If, for example, photon counts of phosphorylated and dephosphorylated muscle are large and small, respectively, then the relative FWHM will be small and large, respectively. This gives an impression that the signals are different, but this is simply a result of statistical nature of the signals. This point is more fully explained in supplemental Fig. S1. Fig. 1 summarizes this phenomenon quantitatively. It shows the dependence of FWHM of the polarization of fluorescence on the strength of the signal. Weak signals have relatively large FWHM, and conversely, large signals have relatively small FWHM. To summarize, comparison between two samples containing very different numbers of cross-bridges is impossible because a statistical error, not phosphorylation, cause major differences in FWHM.
To take this into account we ensure that the average photon counts in each series of experiments are similar. The photon rate is kept constant by adjusting the power of illuminating laser. The optimal is ∼10,000 counts/s. If a signal is much below this value, the polarization signal becomes noisy. If it is much above, there are too many molecules in the detection volume. The differences between FWHMs then become relatively small and measurements are no longer mesoscopic making it impossible to discover the kinetic behavior of cross-bridges.
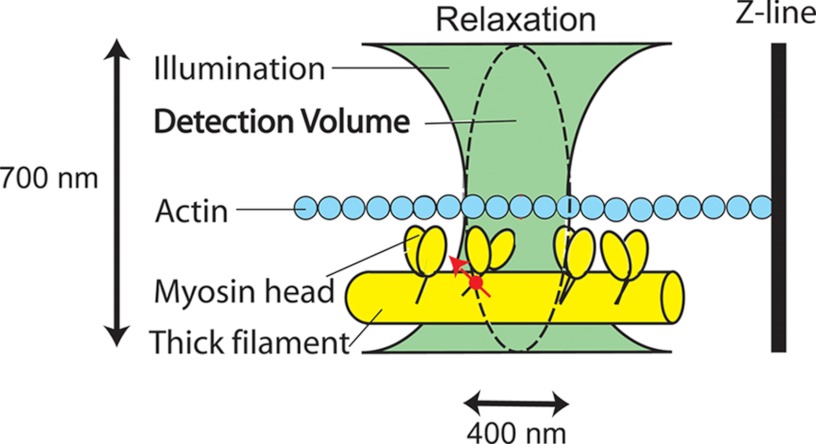
Fig. 2 illustrates how we ensured that only a few cross-bridges contributed to a signal. A small fraction of myosin light chain 1 (LC1) (located on the lever arm) in a myofibril was labeled with a fluorescent dye. LC1 was used to ensure that the phosphorylation site was not disturbed by the dye and to forestall a possibility that RLC, under certain conditions, may bind to the filament core (33, 34). We record parallel (‖) and perpendicular (⊥) components of fluorescent light. The normalized ratio of the difference between these components, called polarized fluorescence (PF), is a sensitive indicator of the orientation of the transition dipole of the fluorophore (19, 20, 23, 35–39). We apply elementary statistical analysis to estimate the degree of order by measuring FWHM of PF. We estimate kinetics of motion by applying elementary model of cross-bridge motion.
FIGURE 2.
Testing the SRX hypothesis. Myosin light chain 1 is labeled with fluorescent dye (red). A small volume of a myofibril is illuminated through a high numerical aperture objective (with the green light) to excite the fluorophore. The detector sees only the confocal volume (∼1 μm3) equivalent to the ellipsoid of revolution indicated by the dashed line (see ”Materials and Methods“).
We report that the width of the distribution of orientations of relaxed, but not active, phosphorylated cross-bridges is statistically significantly greater than that of dephosphorylated cross-bridges. This is consistent with the SRX hypothesis. During relaxation, phosphorylated cross-bridges rotated as slowly as dephosphorylated cross-bridges, whereas during isometric contraction, phosphorylated cross-bridges rotated considerably faster.
MATERIALS AND METHODS
Chemicals and Solutions
SeTau-647-monomaleimide was purchased from SETA BioMedicals (Urbana, IL) and all other chemicals were from Sigma. The following solutions were used: EDTA-rigor solution, 50 mm KCl, 5 mm EDTA, 10 mm Tris-HCl (pH 7.5); Mg-rigor solution, 50 mm KCl, 2 mm MgCl2, 10 mm Tris-HCl (pH 7.5); Ca-rigor solution, 50 mm KCl, 0.1 mm CaCl2, 10 mm Tris-HCl (pH 7.5). The contracting solution was the same as Ca-rigor plus 5 mm Mg+ and 5 mm ATP; relaxing solution was the same as Ca-rigor except that 0.1 mm Ca2+ was replaced with 2 mm EGTA. The contracting solution contained an ATP regenerating system (Ca-rigor + 100 μm ATP + 20 mm creatine phosphate + 10 units/ml of 1 mg/ml of creatine kinase).
Preparation of Myofibrils
Rabbit psoas muscle bundles were first washed with ice-cold EDTA-rigor solution for 30 min followed by an extensive wash with Mg-rigor solution and then with Ca-rigor solution. The fiber bundle was then homogenized using a Heidolph Silent Crusher S homogenizer for 20 s (with a break to cool after 10 s) in Mg-rigor solution.
Preparation of Phosphorylated and Dephosphorylated Muscle
Fresh rabbit psoas skeletal muscle was harvested and bundles of muscle fibers were prepared. Muscle fibers were dephosphorylated by storing in glycerinating solution containing 150 mm KCl, 10 mm MgCl2, 5 mm EGTA, 10 mm Tris-HCl (pH 7.5), 1 mm DTT, 5 mm ATP, 0.1% β-mercaptoethanol, and 50% glycerol. Phosphorylated muscle was prepared by inhibiting the activity of phosphatase enzyme with the addition of 20 mm sodium fluoride and 20 mm phosphate to the muscle fibers in glycerinating solution (15) and incubated for 1 week at 4 °C while rocking.
Isoelectric Focusing
The extent of myosin phosphorylation was analyzed by isoelectric focusing. The protocol for separating myofibrillar lysate and the staining procedure was similar to the one employed by Cooke and co-workers (14, 15). Phosphorylated and dephosphorylated muscle fibers were homogenized in 8 m urea and the total protein concentration was analyzed by the Bradford assay. The homogenates were diluted to obtain a final concentration of 2.5 mg/ml in sample buffer (9 m urea, 130 mm DTT, 20% glycerol, 250 μl of 40% carrier ampholines pH 4–6 (Bio-Rad), 10% Triton X-100). Denaturing isoelectric focusing gel (10 m urea, 18% acrylamide/bisacrylamide, 20% glycerol, 10% Triton X-100, 1 ml of 40% ampholines, 60 μl of 10% Ammonium Persulfate, and 30 μl of TEMED) was run overnight at constant 350 V and fixed (7% TCA, 50% methanol) for 2 h. The gel was then washed with ddH2O for 10 min, stained with Diamond Pro-Q phosphoprotein gel stain (Invitrogen) for 3 h in the dark, and destained (50 mm sodium acetate, 20% acetonitrile) by shaking at room temperature for 30 min. The gel was imaged at 530 nm using a Chemi Doc XRS+ imaging system (Bio-Rad). The result (supplemental Fig. S4), shows that the band corresponding to phosphorylated RLC in lane 2 is 4.8 times stronger than the dephosphorylated RLC shown in lane 1.
Myosin ATPase Activity
The activity was determined using a Sensolyte MG Phosphate assay kit (Anaspec). This involves using malachite green reagent that reacts with free phosphate after ATP hydrolysis to form a bluish-green end product. The amount of free phosphate generated can be quantified by measuring the absorbance at 620 nm and compared with the phosphate standard provided in the kit. The ATPase activity of myofibrils (5 mg/ml) from phosphorylated and dephosphorylated muscle containing 100 μm ATP was assessed. The initial slope (during the first min of incubation) of phosphate/time curve had a slope of 34.7 and 16.6 μm Pi/min/μm head for phosphorylated and dephosphorylated myofibrils, respectively.
Myosin LC1
The procedure for making LC1 was the same as previously described (40). Briefly, a pQE60 vector containing recombinant LC1 with a single cysteine residue (Cys-178) was donated by Dr. Susan Lowey (University of Vermont). The plasmid DNA was transformed into Escherichia coli M15 competent cells and recombinant clones were selected by ampicillin resistance. Sequencing of the LC-cDNA insert of the clones was confirmed for both strands (Iowa State University of Science and Technology). LC1 was overexpressed in Luria broth containing 100 μg/ml of ampicillin by induction with isopropyl 1-thio-β-d-galactopyranoside. His-tagged LC1 was affinity purified on a nickel-nitrilotriacetic acid column following the manufacturer's protocol. The imidazole-eluted fractions were run on SDS-PAGE followed by Western analysis with anti-LCN1 antibodies (Abcam). Fractions containing LC1 were pooled and dialyzed (50 mm KCl and 10 mm phosphate buffer, pH 7.0). The dialyzed protein showed a single ∼25-kDa band on SDS-PAGE after Coomassie staining. The protein concentration was determined using the Bradford assay. In some experiments, commercial skeletal human LC1 was used (Prospec, Ness Ziona, Israel).
Myosin LC1 Labeling
Myofibrils were labeled at myosin LC1 with SeTau-647-monomaleimide (SeTau) dye. SeTau has several important advantages over a single isomer of TRITC dihydroiodide used earlier (41). Most importantly, SeTau is excited in the red and thus reduces the contribution of autofluorescence (42). Furthermore, it is well suited for excitation with 635 nm diode lasers, has a large Stokes shift (44 nm), has a much higher photostability than Cy5 or Alexa 647, has a high extinction coefficient (230,000), and has several times longer fluorescent lifetime than Cy5, Alexa 647, or SETA dyes. Long fluorescence lifetime implies a relatively high polarization so any changes should readily be observed. SeTau is a unique dye with high excitation in red and a relatively long lifetime, two properties that are usually mutually exclusive. Purified LC1 was dialyzed (50 mm KCl, 10 mm phosphate buffer, pH 7.0) and fluorescently labeled by incubating with 5 m excess SeTau overnight on ice. Unbound dye was eliminated by passing through a Sephadex G-50 LP column. The degree of labeling was determined by comparing the concentrations of LC1 protein and bound SeTau. The protein concentration was determined by the Bradford assay and SeTau concentration was determined from the peak absorbance (ϵ = 230,000 m−1 cm−1 at 635 nm measured on a Varian Eclipse spectrometer (Palo Alto, CA)). The dye and protein were complexed in a 1:1 ratio.
Cross-linking
Some myofibrils still shorten during LC1 exchange in the presence of ATP and EGTA at 30 °C. Cross-linking abolishes myofibril shortening in relaxation and contraction making it possible to record polarized intensities. The myofibrils were treated with a water-soluble cross-linker EDC (43–45). After cross-linking cross-bridges cycle and myofibrils retain normal ATPase activity (46). 1 mg/ml of myofibrils in Ca-rigor solution containing 20 mm EDC were incubated for 20 min at room temperature. The reaction was stopped by adding 20 mm DTT. The pH of the solution (7.4) remained unchanged throughout the 20-min reaction. Cross-linking had no effect on the probability distribution or ATPase rate (46). Although the pH of the incubating solution was higher than ideal (6.4), myofibrils did not shorten after cross-linking. The absence of shortening was verified by imaging myofibrils with differential contrast microscopy and fluorescence microscopy after labeling the myofibrils with 10 nm rhodamine-phalloidin (46) (see “Discussion”).
Myosin LC1 Exchange into Myofibrils
A low exchange ratio is necessary for mesoscopic experiments. This was achieved by incubating myofibrils for 20 min at 30 °C (47) with a very low SeTau-LC1 concentration (5–10 nm). The exchange procedure was the same as in Ref. 48 except that fluorescently tagged LC1 was incubated with 1 mg/ml of freshly prepared myofibrils in a light chain exchange solution containing 15 mm KCl, 5 mm EDTA, 5 mm DTT, 10 mm KH2PO4, 5 mm ATP, 1 mm trifluoperazine, and 10 mm imidazole (pH 7).
Data Collection
The exciting light beam is focused to the diffraction limit on the overlap band of a myofibril that is inefficiently exchanged with SeTau-LC1. The axial and lateral dimensions of the elliptical confocal volume (Fig. 2, dashed line) are estimated by measuring the FWHM of an image of 20-nm fluorescent beads at 700 and 400 nm, respectively. Elliptical confocal volume is equal to (π/2)3/2 · (0.400 μm)2 · (0.700 μm) = 0.6 μm3. The actual detection volume is 2.8 times greater = 1.7 μm3 (49). The concentration of myosin in muscle is 0.1 mm (50), and therefore there are 105 myosin molecules in the detection volume. We show under “Results” (the number of observed myosin molecules) that the number of fluorescently labeled cross-bridges in this volume is 26. Therefore the labeling procedure labels only 0.026% of the cross-bridges.
A PicoQuant MT 200 confocal system (PicoQuant, Berlin, Germany) coupled to an Olympus IX71 microscope is used to acquire the fluorescence data. This instrument operates in the time-resolved mode and is capable of lifetime imaging with single molecule detection sensitivity. Each photon is recorded individually by the time-correlated single photon counting electronics in time-tagged time-resolved mode. A 635-nm pulsed laser provides linearly polarized excitation parallel to the myofibrillar axis. Fluorescence is collected by an Olympus ×60, 1.2 NA water immersion objective, next it passes through a 650-nm long pass interference filter and a 30-μm pinhole, and it is split by a 50–50 birefringent prism, which separates the vertically and horizontally polarized emission. Avalanche Photodiodes detect the separated light beams through analyzers oriented ‖ and ⊥ to myofibrillar axis. Calibration is done so that for an isotropic solution of dye with long fluorescence lifetime (50 nm rhodamine 700), the detectors give identical readings. Time-tagged time-resolved collection makes the time resolution of this system on the order of picoseconds. This allowed us to bin the data so that the overall time resolution is 10 ms.
The polarization of fluorescence is a measure of orientation of a cross-bridge. It is defined by: PF = P‖ = (‖I‖ − ‖I⊥)/(‖I‖ + ‖I⊥), where the subscript left of the fluorescent intensity (I) signifies orientation of excited light (e.g. ‖I). The subscript to the right of I signifies orientation of emitted light (e.g. I⊥). Myofibrils were always excited with light ‖ to its axis (‖I). Channels 2 and 1 were used to detect ‖I⊥ and ‖I‖, respectively.
A typical experiment involves placing a diffraction-limited laser beam on the A-band and measuring polarization of fluorescence 2000 times (one every 10 ms for 20 s). A convenient way to represent these data is to construct histograms, the frequency plots of polarization of fluorescence. The laser beam is next redirected to a neighboring half-sarcomere adjusting the laser power to make sure that each sarcomere provides a similar photon rate where the differences in FWHM become statistically interpretable. The process is repeated 20–30 times, i.e. we obtain 40,000–60,000 data points from each myofibril.
Time Resolved Anisotropy and Lifetime Measurements
The lifetime and fluorescence anisotropy of SeTau were measured by the time-domain technique (51) using a FluoTime 200 fluorometer (PicoQuant, Inc.) at room temperature. The excitation was provided by a 635-nm pulsed diode laser, and the observation was conducted through a 670-nm monochromator with a supporting 650-nm long pass filter. The FWHM of the pulse response function was less than 100 ps and time resolution was <10 ps. The intensity decays were analyzed by a multiexponential model using FluoFit software (PicoQuant, Inc.). To ascertain whether the myosin LC1 probe is immobilized so that the transition dipole of the fluorophore reflects the orientation of the protein, we measured the decay of anisotropy of SeTau-LC1 exchanged into myofibrils. Anisotropy is defined as r = (I‖ − I⊥)/(I‖ + 2I⊥). The decay of anisotropy of free SeTau was best fit by a single exponential curve, r(t) = RINF + R1 · exp(−t/θ), where RINF = 0 is the anisotropy at infinite time, R1 = 0.301 is the initial anisotropy, and θ is the rotational correlation time = 0.776 ns. The anisotropy decay comprised only the fast decay. The lifetime of free SeTau was 2.449 ns. The decay of anisotropy of SeTau-LC1, on the other hand, was best fit by a single exponential curve r(t) = RINF + R1 · exp(−t/θ), where RINF = 0 is the anisotropy at infinite time, R1 = 0.335 is the initial anisotropy, and θ is the rotational correlation time = 0.784 ns. The lifetime of SeTau bound to LC1 was 2.474 ns. The anisotropy decay was composed entirely of the fast decay suggesting that the dye was not immobilized by myosin LC1. Finally, we measured the decay of SeTau-LC1 bound to myofibrillar myosin. The best fit was the exponential curves r(t) = RINF + R1 · exp(−t/θ1) + R2 · exp(−t/θ2) with RINF = 0.050, R1 = 0.047, R2 = 0.106, θ1 = 223 ns, θ2 = 1.268 ns. The fast decay comprised 47% of the positive anisotropy components. The lifetime of SeTau-LC1 bound to myofibrillar myosin consisted of fast (0.513 ns) and slow (2.695 ns) components.
In conclusion, 53% of the dye was immobilized by myosin. The mobile fraction decayed with the correlation time characteristic of the dye alone.
Statistical Analysis
Analysis was carried out using Origin version 8.5 (Northampton, MA) and SigmaPlot 11 (Systat Software, San Jose, CA). Nonlinear curve fitting was performed using the Levenberg-Marquardt algorithm for χ-square minimization. χ-Square minimization optimizes a parameterized fitting function with respect to a particular set of data by iteratively adjusting the parameter values of the fitting function to minimize residuals. Residuals are the point-wise deviations between the fitting function (i.e. the theoretical curve) and the experimental data. For the current data a Gaussian (normal) fitting function was used. We saw no difference in the results when the Voigt or Lorentzian models were used. Goodness of fit was assessed by the reduced χ2. The code for generating the “velocity plots” (available on request) was written with Labview 2010. Velocities were calculated by taking the difference in consecutive polarization data points and dividing it by the difference in the time stamps associated with each data point. The plot is the array of velocity data points versus the array of polarization points on an x-y plot. The front panel of the Labview program is a view graph, buttons for initializing the process, storing the data as an Excel file, and exporting a graph of the data as a .jpg file. The program was compiled using Labview's compiler into a standalone executable.
RESULTS
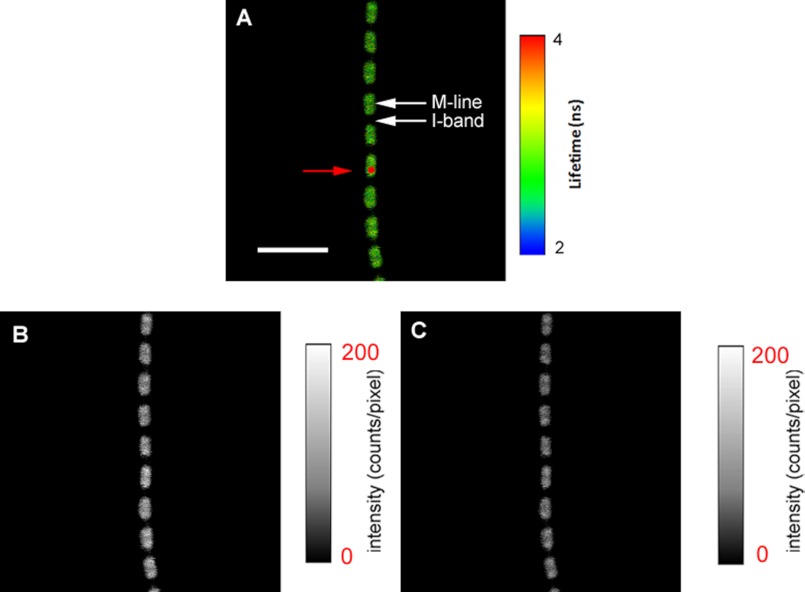
Fig. 3 shows an example of the implementation of the scheme in skeletal muscle. The laser is focused to a diffraction limited spot on the A-band of a half-sarcomere. The projection of this spot on the image plane is a shown as a red circle. As expected, image B is more intense than C indicating the fluorescence is polarized as expected from the anisotropic sample.
FIGURE 3.
A, fluorescence lifetime image of a relaxed myofibril. The red circle is a projection of the confocal aperture on the sample plane (diameter 0.5 μm). The lifetime scale is at the right. B, intensity image obtained with the direction of polarization of emitted light parallel (‖I‖) to the myofibrillar axis. C, intensity image obtained from the emission of fluorescence polarized perpendicular (‖I⊥) to the myofibrillar axis. The intensity scales are in counts per pixel. Native myofibrillar LC1 was exchanged with 10 nm SeTau-LC1. Scale bar = 5 μm, sarcomere length = 2.1 μm. Images were acquired by a PicoQuant Micro Time 200 single molecule confocal lifetime microscope. The sample was excited with a 635-nm pulsed laser and observed through a LP 650-nm filter.
The Number of Observed Myosin Molecules
The number was determined experimentally by fluorescence lifetime correlation spectroscopy from the number of fluctuations of the free SeTau dye. This is a more accurate method than fluorescence intensity correlation spectroscopy used earlier (40). The method separates autocorrelation functions of components with different lifetimes, and is thus able to reject contributions from scattered light and from after-pulsing (52). The number of molecules (n) contributing to the autocorrelation function of these fluctuations is equal to the inverse of the value of the autocorrelation function at delay time 0 [G(0)], n = 1/G(0) (53–55). The autocorrelation functions were obtained from solutions of fluorophore in the range 1.29–77.3 nm. An example of autocorrelation function obtained at 9.8 nm SeTau is shown in supplemental Fig. S2. In this case we observed on average 3.6 molecules. The intensity of the laser was fixed at 0.2 μW. Extrapolation of the 1/G(0) plot revealed that the contribution by one molecule of the dye illuminated with 0.2 μW of laser power corresponded to ∼75 counts per channel, i.e. the total fluorescence (Itotal = I‖ + 2 × I⊥) from one molecule of SeTau at 0.2 μW laser power was 225 counts/s.
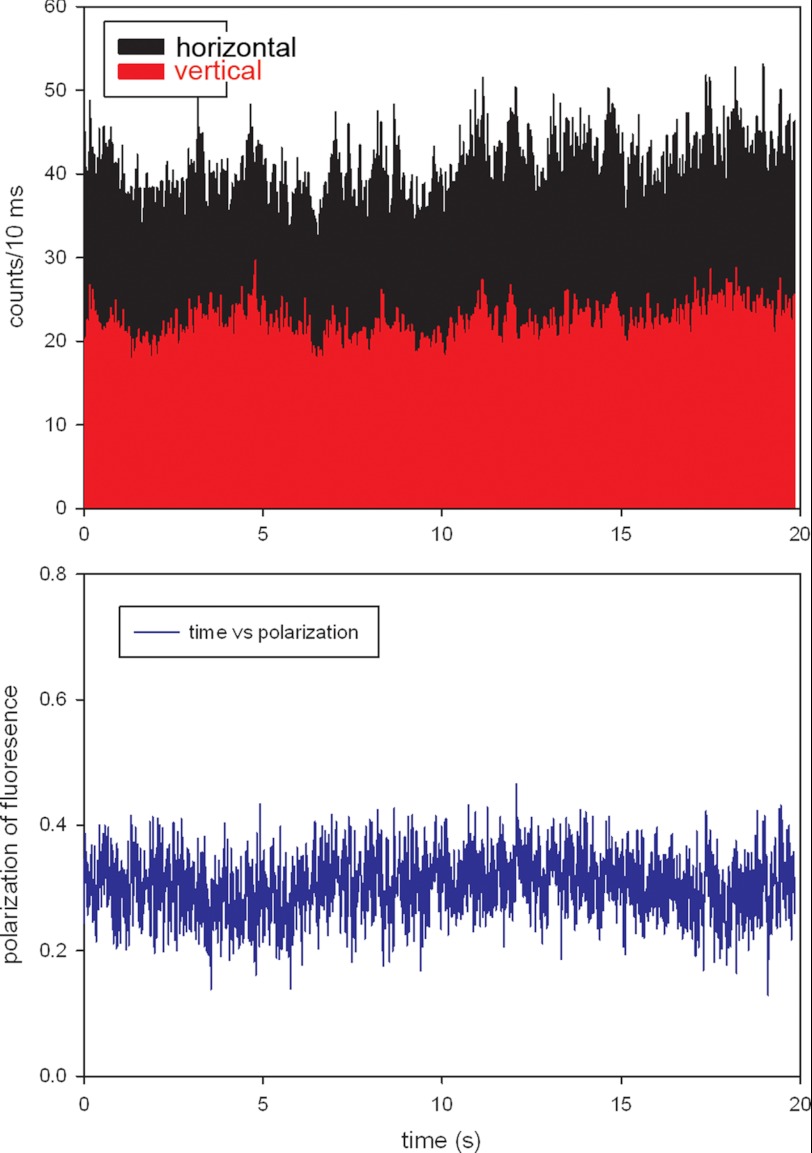
It is now possible to estimate the number of molecules contributing to the actual signal. Fig. 4, top panel, shows the intensities of perpendicular and parallel channels of a typical relaxed myofibril. The polarized intensities in ‖ and ⊥ channels were 4000 and 1,500 counts/s, respectively, giving total intensity Itotal = I‖ + 2 × I⊥ = 7,000 counts/s. The background was 1,200 counts/s indicating that the number of myosin molecules in the detection volume was ∼26. As noted before, it is essential to keep the fluorescence intensities emanating from each half-sarcomere very close. Within the range of laser powers used in our experiments (0.2–0.4 μW), the fluorescent intensity was a linear function of laser power. Therefore the actual number of molecules in each half-sarcomere varied between 26 and 52. However, it should be emphasized that as long as the number of cross-bridges is mesoscopic, i.e. the exact number does not matter, i.e. 26 molecules should give the same result as 52 molecules etc.
FIGURE 4.
Typical time course of polarized light of relaxed phosphorylated psoas muscle myofibril. The bar plot shows that the vertical scale is the number of counts during 10 ms. Ch2 (black, horizontal polarization) and Ch3 (red, vertical polarization) are fluorescence intensities polarized parallel (I‖) and perpendicular (I⊥) and to the myofibrillar axes, respectively. The direction of the excitation polarization is ‖ to the myofibrillar axis. The bottom panel shows corresponding polarization of fluorescence. Laser power = 0.3 μW.
The Degree of Order of Relaxed Cross-bridges
The upper and lower panels of Fig. 5 show representative histograms of relaxed myofibrils, which contained phosphorylated and dephosphorylated RLCs, respectively. The FWHM values for these and 19 other half-sarcomeres are summarized in Table 1.
FIGURE 5.
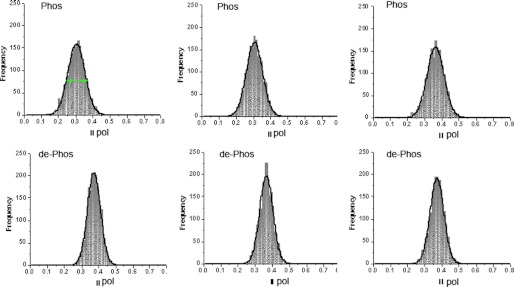
Upper panels, representative histograms of relaxed half-sarcomeres containing phosphorylated RLCs. Lower panels, representative histograms of a half-sarcomeres containing dephosphorylated RLCs. Frequency (vertical scale) is the number of times a given polarization of fluorescence (horizontal scale) occurs in a given experiment. The green arrows in the first histogram indicate FWHM.
TABLE 1.
Difference between the mean ± S.D. of the distributions (FWHM), total fluorescence intensities, and average polarizations of labeled myosin RCLs in relaxed half-sarcomeres containing phosphorylated and dephosphorylated (de-P) RLCs
Averages of 20 experiments.
| RLC-P |
RLC de-P |
||||
|---|---|---|---|---|---|
| FWHM | Total intensity | Average polarization | FWHM | Total intensity | Average polarization |
| 0.117 ± 0.007 | 85.946 ± 9.949 | 0.315 ± 0.024 | 0.098 ± 0.016 | 88.128 ± 20.529 | 0.382 ± 0.013 |
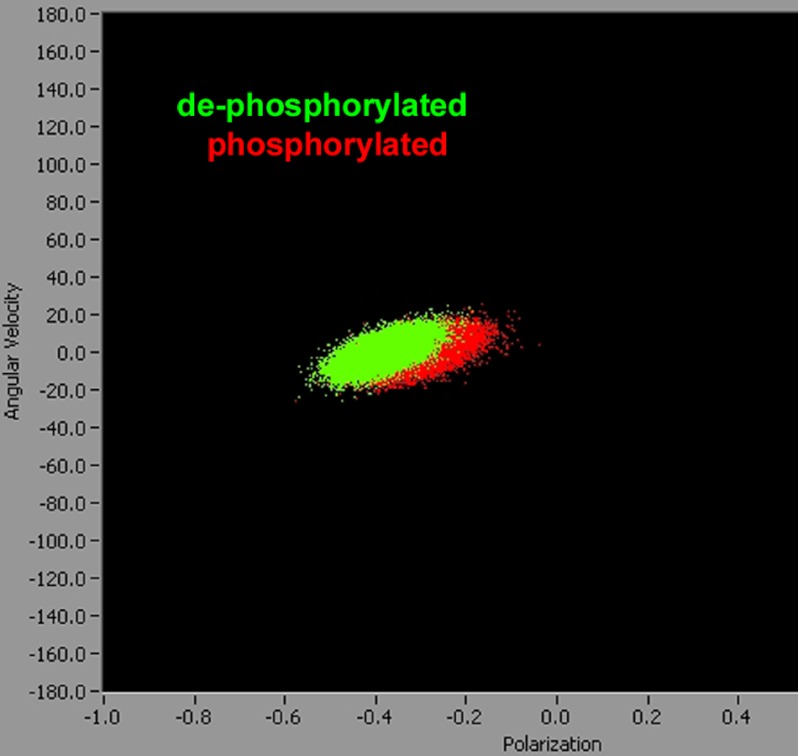
An alternative way to demonstrate differences in FWHM and the average polarizations of phosphorylated and dephosphorylated cross-bridges is to plot instantaneous angular velocity v of a cross-bridge (defined as change of polarization in 10 ms) versus polarization of fluorescence. The overall velocity in isometric contraction is, of course 0, but plotting the data in two-dimension (i.e. v versus PF) allows presenting the information contained in all 20 experiments on a single plot. Each experiment on phosphorylated or dephosphorylated muscle consists of 2000 measurements of PF, so Fig. 6, which is a plot of 20 experiments on phosphorylated and 20 experiments on dephosphorylated cross-bridges of relaxed myofibril contains 80,000 points. It is impossible to show so many data points in one-dimensional plots. It can be seen that the points from dephosphorylated muscle (green) are more narrowly distributed than points from phosphorylated muscle (red), and that phosphorylation decreases mean polarization.
FIGURE 6.
The change of PF in 10 ms plotted versus the entire 80,000 values of PF obtained from relaxed dephosphorylated (green) and phosphorylated (red) muscle. It can be seen that the points from the dephosphorylated muscle are more narrowly distributed than points from phosphorylated muscle, and that phosphorylation decreases the mean polarization. Note that the horizontal scale shows −PF.
The difference between FWHMs for phosphorylated and dephosphorylated half-sarcomeres was statistically significant. A difference of 0.0188 had a t value of 4.646 with 37 degrees of freedom, 0.95% confidence interval for difference of means was 0.0106 to 0.0271. Because the difference in the mean values of the two groups is greater than would be expected by chance, there is a statistically significant difference between the input groups (p < 0.001). The difference between the average values of polarization were also statistically significant. The two-tailed p value was less than 0.0001, t = 10.9169 with 37 degrees of freedom. 95% confidence interval of this difference ranged from −0.07944 to −0.05456. By conventional criteria, the difference is considered to be extremely statistically significant. Differences in total fluorescence intensities were not significant.
The Degree of Order of Active Cross-bridges
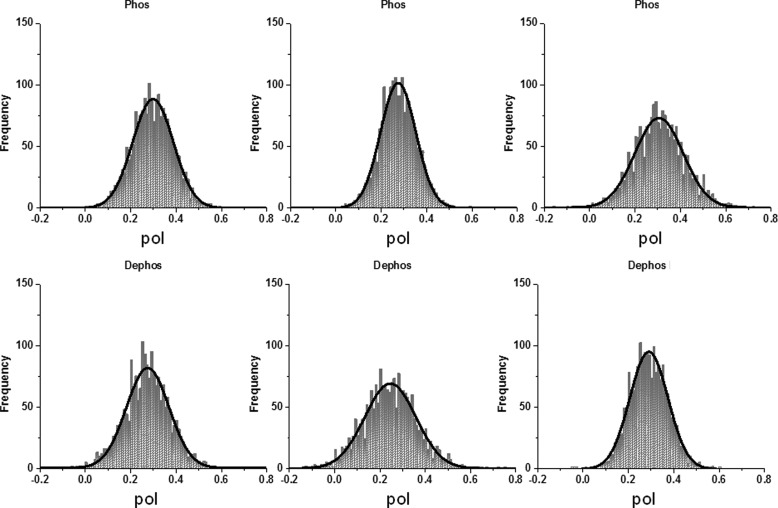
In contrast to relaxed muscle, isometrically contracting one muscle showed no statistically significant difference in FWHM. The upper and lower panels of Fig. 7 show representative histograms of contracting myofibrils, which contained dephosphorylated and phosphorylated RLCs, respectively. The FWHM values for these and 20 other half-sarcomeres are shown in Table 2. The difference of 0.0258 had t = 1.972, p = 0.056 with 38 degrees of freedom. 95% confidence interval for difference of means was −0.000680 to 0.0523. The difference in the mean values of the two groups was not great enough to reject the possibility that the difference was due to random sampling variability. The differences in total fluorescence intensities were also not significant.
FIGURE 7.
Upper panels, representative histograms of contracting half-sarcomeres containing-phosphorylated RLCs. Lower panels, representative histograms of a half-sarcomeres containing phosphorylated RLCs.
TABLE 2.
Difference between the mean ± S.D. of the distributions (FWHM) and total fluorescence intensities of labeled myosin RLCs in contracting half-sarcomeres containing phosphorylated and dephosphorylated (de-P) RLCs
Averages of 20 experiments.
| RLC-P |
RLC de-P |
||
|---|---|---|---|
| FWHM | Total intensity | FWHM | Total intensity |
| 0.200 ± 0.039 | 40.4 ± 14.3 | 0.226 ± 0.043 | 36.5 ± 18.3 |
The Rotation of Relaxed Cross-bridges
The cross-bridges in relaxation execute random motions, powered by random temperature fluctuations. The question we asked was whether the movement of cross-bridges in the dephosphorylated state differ from phosphorylated ones. We took advantage of the fact that the number of cross-bridges in every half-sarcomere was mesoscopic and so we were able to measure the autocorrelation function of polarized fluorescence. The autocorrelation function of PFs is the time average of PFs multiplied by the value after a time delay. Its decay characterizes the rapidity of rotational motions of the myosin lever arm. Fig. 8 shows representative autocorrelation functions of traces of phosphorylated (top panels) and dephosphorylated (bottom panels) relaxed myofibrils.
FIGURE 8.
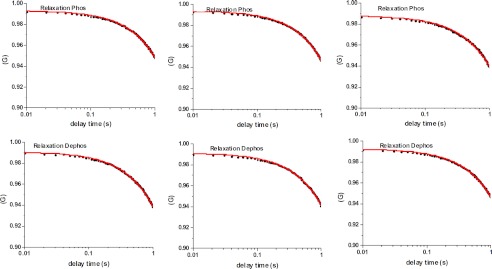
Autocorrelation functions of the rotational motion of relaxed cross-bridges containing phosphorylated (top panels) and dephosphorylated (bottom panels) myosin RLCs.
It is possible to relate the decay of the correlation function to cross-bridge kinetics (56). For a simple two-state model of cross-bridge cycle, where each can assume only two orientations (attached in rigor and detached from actin in relaxed), the decay parameters are related in a simple way to the rate of power stroke and the rate of cross-bridge dissociation from actin,
 |
where k1, a1 and k2, and a2 are the forward and reverse rate constants and fluorescence intensities associated with conformational change. There was no statistical difference between rates of cross-bridge attachment or detachment between phosphorylated and dephosphorylated cross-bridges. Table 3 summarizes the results.
TABLE 3.
No difference is seen between the forward and reverse rates of rotational motion of relaxed cross-bridges in half-sarcomeres containing phosphorylated and dephosphorylated (de-P) RLC
The errors are standard deviations. a1 is assumed to be 0 and a2 is assumed to be 1. Averages of 21 experiments.
| RLC-P |
RLC de-P |
||
|---|---|---|---|
| k1 | k2 | k1 | k2 |
| s−1 | s−1 | ||
| 0.17 ± 0.10 | 0.03 ± 0.00 | 0.14 ± 0.08 | 0.03 ± 0.00 |
The Rotation of Contracting Cross-bridges
The cross-bridges in contraction execute random motions, powered by hydrolysis of ATP. As with relaxation, we sought to determine whether the cross-bridges in contraction execute random motions, powered by hydrolysis of ATP. The question we asked was whether dephosphorylated cross-bridges move differently than phosphorylated ones. As before, we took advantage of the fact that the number of cross-bridges in every half-sarcomere was mesoscopic and so we were able to measure the autocorrelation function of polarized fluorescence. Myofibrils did not shorten during contraction because of cross-linking (supplemental Fig. S3). The rate of decay of autocorrelation function characterizes rapidity of rotational motions of the lever arm.
As before, we define constants k1 and k2 as forward and reverse rate constants associated with conformational change. Fig. 9 shows representative autocorrelation functions of traces of phosphorylated (top panels) and dephosphorylated (bottom panels) relaxed myofibrils. There was significant statistical difference between rates of cross-bridge attachment or detachment between two phosphorylated and dephosphorylated cross-bridges. Table 4 summarizes the results.
FIGURE 9.
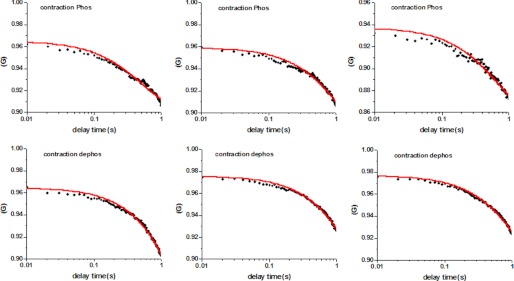
Autocorrelation functions of the rotational motion of contracting cross-bridges containing phosphorylated (top panels) and dephosphorylated (bottom panels) RLC.
TABLE 4.
Differences between rates of rotational motion of contracting cross-bridges in half-sarcomeres containing phosphorylated and dephosporylated (de-P) RLC
The errors are standard deviations. a1 is assumed to be 0 and and a2 is assumed to be 1. Averages of 21 experiments.
| RLC-P |
RLC de-P |
||
|---|---|---|---|
| k1 | k2 | k1 | k2 |
| s−1 | s−1 | ||
| 1.28 ± 0.46 | 0.10 ± 0.04 | 0.64 ± 0.31 | 0.05 ± 0.01 |
DISCUSSION
As mentioned before, the reasons we limit the number of molecules is to emphasize the differences between FWHMs, to be able to study the kinetics of the rotational motion of cross-bridges, and to minimize possible inhomogenitites existing between different sarcomeres. In our experiments this condition was satisfied by using a confocal microscope with single molecule sensitivity focused to the diffraction limit on a single half-sarcomere and by labeling myosin very sparsely (Fig. 2). In a typical experiment we observed between 26 and 52 (Figs. 4) cross-bridges.
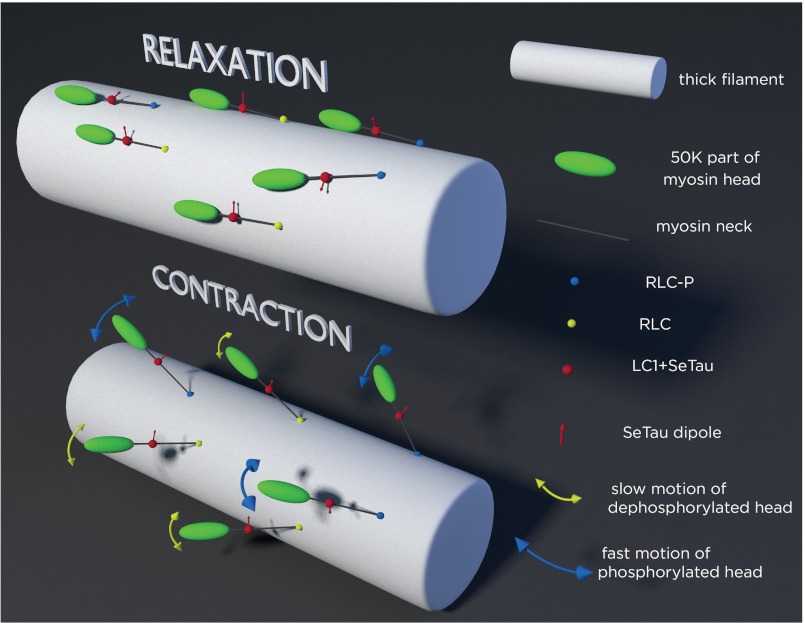
We found that relaxed cross-bridges of muscle in which RLCs were dephosphorylated were organized more tightly than cross-bridges of muscle in which RLCs were phosphorylated (Table 1, Fig. 10). This work confirms the original SRX finding by suggesting that the SRX state corresponds to a highly ordered array of myosin heads in relaxed muscle in the absence of RLC phosphorylation, and that phosphorylation of RLC can switch to a disordered array of myosin heads (8). It is possible that the increase in organization was due to the fact that the dephosphorylated cross-bridges were lying close to the core of the thick filament, as suggested in Ref. 8. However, although the distribution of part of the neck containing LC1 was relatively compact (Table 1, Fig. 10), it was not completely immobilized. The proximal end was able to rotate, albeit slowly (Table 3). Interestingly, the proximal part of the phosphorylated heads, although more disorganized, was just as mobile in relaxation as the dephosphorylated head (Table 3).
FIGURE 10.
Schematics of the arrangement of cross-bridges on the surface of thick filament (white cylinder). Phosphorylated and dephosphorylated RLC are indicated by blue and yellow spheres, respectively. Red sphere is the LC1 containing rhodamine; its transition dipole is indicated by red arrows. Top panel, relaxation, dephosphorylated myosins are well oriented, the transition dipoles point approximately in the same direction. Dephosphorylated myosins are in the SRX state. In contrast, phosphorylated myosins are not well oriented. Both phosphorylated and dephosphorylated myosins are largely immobilized by thick filament core. Bottom panel, contraction, now cross-bridges leave the surface of thick filaments to be able to interact with thin filaments (not shown). Both types of myosins are equally disorganized and rotate slow during relaxation, but phosphorylated myosins are more mobile during contraction. Blue and yellow arrows imply rotation. Rotation occurs in both the polar and azimuthal planes. Thickness of the yellow and blue arrowheads indicates the speed of rotation. Dephosphorylated heads (yellow arrows) move slower than phosphorylated heads (blue arrows).
During contraction, however, there was a significant difference between the on and off rates of rotation of phosphorylated and dephosphorylated heads (Fig. 10). However, the ratio between on and off rates (and the duty cycle = 7.2%) remained exactly the same, suggesting that the isometric force was not changed by phosphorylation of RLC. This was indeed observed at saturating Ca2+ concentrations as observed in skeletal (2) and cardiac (57) muscle.
A second pathway that may influence the population of the SRX is the phosphorylation of myosin-binding protein-C (MBP-C), the role of MBP-C was not addressed in this study. MBP-C binds to the thick filament and has been shown to affect both thick filament structure and myosin function. MBP-C binds to the S2 portion of myosin adjacent to the head region, and it is thought to stabilize the binding of the head back to the core of the thick filament. The cardiac MBP-C has three sites for phosphorylation and can be phosphorylated by a variety of kinases, including protein kinase A, protein kinase C, and calcium-calmodulin-dependent kinase. Phosphorylation at some of these sites causes myosin heads to be released from the core of the thick filament and become disordered, leading to multiple consequences for cardiac myosin function. It is possible that protein C acts as a signaling molecule, reporting changes in cross-bridges to actin. It binds to both actin and myosin heads through the N-terminal region (containing domains C0, C1, and C2) (58). Indeed, recent data suggests that MBP-C may alter interaction between cross-bridges and actin (12).
Acknowledgment
We thank Dr. N. Naber for help with isoelectric focusing gels.
This work was supported, in whole or in part, by National Institutes of Health Grants R01AR048622 (to J. B.) and R01HL090786 (to J. B. and Dr. D. Szczesna).

This article contains supplemental Figs. S1–S4.
Because the distribution is normal, FWHM = 2 square root (2ln2) = 2.355 S.D.
- RLC
- regulatory light chain of myosin
- SRX
- super-relaxed state of muscle
- FWHM
- full width at half-maximum
- EDC
- 1-ethyl-3-(3-(dimethylamino)propyl)carbodiimide
- PF
- polarization of fluorescence
- LC1
- essential light chain of myosin
- TEMED
- N,N,N′,N′-tetramethylethylenediamine
- TRITC
- tetramethylrhodamine 5-iodoacetamide
- MBP-C
- myosin-binding protein-C
- μW
- microwatt.
REFERENCES
- 1. Stull J. T., Bowman B. F., Gallagher P. J., Herring B. P., Hsu L. C., Kamm K. E., Kubota Y., Leachman S. A., Sweeney H. L., Tansey M. G. (1990) Myosin phosphorylation in smooth and skeletal muscles. Regulation and function. Prog. Clin. Biol. Res. 327, 107–126 [PubMed] [Google Scholar]
- 2. Szczesna D., Zhao J., Jones M., Zhi G., Stull J., Potter J. D. (2002) Phosphorylation of the regulatory light chains of myosin affects Ca2+ sensitivity of skeletal muscle contraction. J. Appl. Physiol. 92, 1661–1670 [DOI] [PubMed] [Google Scholar]
- 3. Cooke R. (2007) Modulation of the actomyosin interaction during fatigue of skeletal muscle. Muscle Nerve 36, 756–777 [DOI] [PubMed] [Google Scholar]
- 4. Greenberg M. J., Mealy T. R., Jones M., Szczesna-Cordary D., Moore J. R. (2010) The direct molecular effects of fatigue and myosin regulatory light chain phosphorylation on the actomyosin contractile apparatus. Am. J. Physiol. Regul. Integr. Comp. Physiol. 298, R989–996 [DOI] [PMC free article] [PubMed] [Google Scholar]
- 5. Olsson M. C., Patel J. R., Fitzsimons D. P., Walker J. W., Moss R. L. (2004) Basal myosin light chain phosphorylation is a determinant of Ca2+ sensitivity of force and activation dependence of the kinetics of myocardial force development. Am. J. Physiol. Heart Circ. Physiol. 287, H2712–2718 [DOI] [PubMed] [Google Scholar]
- 6. Ferenczi M. A., Homsher E., Simmons R. M., Trentham D. R. (1978) Reaction mechanism of the magnesium ion-dependent adenosine triphosphatase of frog muscle myosin and subfragment 1. Biochem. J. 171, 165–175 [DOI] [PMC free article] [PubMed] [Google Scholar]
- 7. Craig R., Alamo L., Padrón R. (1992) Structure of myosin filaments of relaxed and rigor vertebrate muscle studied by rapid freezing electron microscopy. J. Mol. Biol. 228, 474–487 [DOI] [PubMed] [Google Scholar]
- 8. Cooke R. (2011) The role of the myosin ATPase activity in adaptive thermogenesis by skeletal muscle. Biophys. Rev. 3, 33–45 [DOI] [PMC free article] [PubMed] [Google Scholar]
- 9. Craig R., Padrón R., Kendrick-Jones J. (1987) Structural changes accompanying phosphorylation of tarantula muscle myosin filaments. J. Cell Biol. 105, 1319–1327 [DOI] [PMC free article] [PubMed] [Google Scholar]
- 10. Levine R. J., Chantler P. D., Kensler R. W., Woodhead J. L. (1991) Effects of phosphorylation by myosin light chain kinase on the structure of Limulus thick filaments. J. Cell Biol. 113, 563–572 [DOI] [PMC free article] [PubMed] [Google Scholar]
- 11. Levine R. J., Kensler R. W., Yang Z., Sweeney H. L. (1995) Myosin regulatory light chain phosphorylation and the production of functionally significant changes in myosin head arrangement on striated muscle thick filaments. Biophys. J. 68, 224S. [PMC free article] [PubMed] [Google Scholar]
- 12. Colson B. A., Locher M. R., Bekyarova T., Patel J. R., Fitzsimons D. P., Irving T. C., Moss R. L. (2010) Differential roles of regulatory light chain and myosin binding protein-C phosphorylations in the modulation of cardiac force development. J. Physiol. 588, 981–993 [DOI] [PMC free article] [PubMed] [Google Scholar]
- 13. Alamo L., Wriggers W., Pinto A., Bártoli F., Salazar L., Zhao F. Q., Craig R., Padrón R. (2008) Three-dimensional reconstruction of tarantula myosin filaments suggests how phosphorylation may regulate myosin activity. J. Mol. Biol. 384, 780–797 [DOI] [PMC free article] [PubMed] [Google Scholar]
- 14. Naber N., Cooke R., Pate E. (2011) 55th Annual Meeting of the Biophysical Society, March 5–9, 2011, Abstract 702-POS, p. 37, Baltimore, MD [Google Scholar]
- 15. Stewart M. A., Franks-Skiba K., Chen S., Cooke R. (2010) Myosin ATP turnover rate is a mechanism involved in thermogenesis in resting skeletal muscle fibers. Proc. Natl. Acad. Sci. U.S.A. 107, 430–435 [DOI] [PMC free article] [PubMed] [Google Scholar]
- 16. Hooijman P., Stewart M. A., Cooke R. (2011) A new state of cardiac Myosin with very slow ATP turnover. A potential cardioprotective mechanism in the heart. Biophys. J. 100, 1969–1976 [DOI] [PMC free article] [PubMed] [Google Scholar]
- 17. Aronson J. F., Morales M. F. (1969) Polarization of tryptophan fluorescence in muscle. Biochemistry 8, 4517–4522 [DOI] [PubMed] [Google Scholar]
- 18. Borejdo J., Putnam S., Morales M. F. (1979) Fluctuations in polarized fluorescence. Evidence that muscle cross-bridges rotate repetitively during contraction. Proc. Natl. Acad. Sci. U.S.A. 76, 6345–6350 [DOI] [PMC free article] [PubMed] [Google Scholar]
- 19. Dos Remedios C. G., Millikan R. G., Morales M. F. (1972) Polarization of tryptophan fluorescence from single striated muscle fibers. A molecular probe of contractile state. J. Gen. Physiol. 59, 103–120 [DOI] [PMC free article] [PubMed] [Google Scholar]
- 20. Dos Remedios C. G., Yount R. G., Morales M. F. (1972) Individual states in the cycle of muscle contraction. Proc. Natl. Acad. Sci. U.S.A. 69, 2542–2546 [DOI] [PMC free article] [PubMed] [Google Scholar]
- 21. Borejdo J., Assulin O., Ando T., Putnam S. (1982) Cross-bridge orientation in skeletal muscle measured by linear dichroism of an extrinsic chromophore. J. Mol. Biol. 158, 391–414 [DOI] [PubMed] [Google Scholar]
- 22. Berger C. L., Craik J. S., Trentham D. R., Corrie J. E., Goldman Y. E. (1996) Fluorescence polarization of skeletal muscle fibers labeled with rhodamine isomers on the myosin heavy chain. Biophys. J. 71, 3330–3343 [DOI] [PMC free article] [PubMed] [Google Scholar]
- 23. Hopkins S. C., Sabido-David C., van der Heide U. A., Ferguson R. E., Brandmeier B. D., Dale R. E., Kendrick-Jones J., Corrie J. E., Trentham D. R., Irving M., Goldman Y. E. (2002) Orientation changes of the myosin light chain domain during filament sliding in active and rigor muscle. J. Mol. Biol. 318, 1275–1291 [DOI] [PubMed] [Google Scholar]
- 24. Sabido-David C., Brandmeier B., Craik J. S., Corrie J. E., Trentham D. R., Irving M. (1998) Steady-state fluorescence polarization studies of the orientation of myosin regulatory light chains in single skeletal muscle fibers using pure isomers of iodoacetamido tetramethylrhodamine. Biophys. J. 74, 3083–3092 [DOI] [PMC free article] [PubMed] [Google Scholar]
- 25. Cooke R., Crowder M. S., Thomas D. D. (1982) Orientation of spin labels attached to cross-bridges in contracting muscle fibres. Nature 300, 776–778 [DOI] [PubMed] [Google Scholar]
- 26. Thomas D. D., Cooke R. (1980) Orientation of spin-labeled myosin heads in glycerinated muscle fibers. Biophys. J. 32, 891–906 [DOI] [PMC free article] [PubMed] [Google Scholar]
- 27. Qian H., Saffarian S., Elson E. L. (2002) Concentration fluctuations in a mesoscopic oscillating chemical reaction system. Proc. Natl. Acad. Sci. U.S.A. 99, 10376–10381 [DOI] [PMC free article] [PubMed] [Google Scholar]
- 28. Elson E. L., Magde D. (1974) Fluorescence correlation spectroscopy. Coceptual basis and theory. Biopolymers 13, 1–28 [DOI] [PubMed] [Google Scholar]
- 29. Elson E. L., Webb W. W. (1975) Concentration correlation spectroscopy. A new biophysical probe based on occupation number fluctuations. Annu. Rev. Biophys. Bioeng. 4, 311–334 [DOI] [PubMed] [Google Scholar]
- 30. Huxley A. F., Simmons R. M. (1971) Proposed mechanism of force generation in striated muscle. Nature 233, 533–538 [DOI] [PubMed] [Google Scholar]
- 31. Goldman Y. E., Hibberd M. G., Trentham D. R. (1984) Relaxation of rabbit psoas muscle fibres from rigor by photochemical generation of adenosine 5′-triphosphate. J. Physiol. 354, 577–604 [DOI] [PMC free article] [PubMed] [Google Scholar]
- 32. Goldman Y. E., Hibberd M. G., Trentham D. R. (1984) Initiation of active contraction by photogeneration of adenosine 5′-triphosphate in rabbit psoas muscle fibres. J. Physiol. 354, 605–624 [DOI] [PMC free article] [PubMed] [Google Scholar]
- 33. Harrington W. F., Ueno H., Davis J. S. (1988) Helix-coil melting in rigor and activated cross-bridges of skeletal muscle. Adv. J. Exp. Med. Biol. 226, 307–318 [PubMed] [Google Scholar]
- 34. Reisler E., Burke M., Josephs R., Harrington W. F. (1973) Cross-linking of myosin and myosin filaments. J. Mechanochem. Cell Motil. 2, 163–179 [PubMed] [Google Scholar]
- 35. Nihei T., Mendelson R. A., Botts J. (1974) Use of fluorescence polarization to observe changes in attitude of S1 moieties in muscle fibers. Biophys. J. 14, 236–242 [DOI] [PMC free article] [PubMed] [Google Scholar]
- 36. Tregear R. T., Mendelson R. A. (1975) Polarization from a helix of fluorophores and its relation to that obtained from muscle. Biophys. J. 15, 455–467 [DOI] [PMC free article] [PubMed] [Google Scholar]
- 37. Morales M. F. (1984) Calculation of the polarized fluorescence from a labeled muscle fiber. Proc. Natl. Acad. Sci. U.S.A. 81, 145–149 [DOI] [PMC free article] [PubMed] [Google Scholar]
- 38. Sabido-David C., Hopkins S. C., Saraswat L. D., Lowey S., Goldman Y. E., Irving M. (1998) Orientation changes of fluorescent probes at five sites on the myosin regulatory light chain during contraction of single skeletal muscle fibres. J. Mol. Biol. 279, 387–402 [DOI] [PubMed] [Google Scholar]
- 39. Hopkins S. C., Sabido-David C., Corrie J. E., Irving M., Goldman Y. E. (1998) Fluorescence polarization transients from rhodamine isomers on the myosin regulatory light chain in skeletal muscle fibers. Biophys. J. 74, 3093–3110 [DOI] [PMC free article] [PubMed] [Google Scholar]
- 40. Borejdo J., Rich R., Midde K. (2012) Mesoscopic analysis of motion and conformation of cross-bridges. Biophys. Rev., in press [DOI] [PMC free article] [PubMed] [Google Scholar]
- 41. Midde K., Luchowski R., Das H. K., Fedorick J., Dumka V., Gryczynski I., Gryczynski Z., Borejdo J. (2011) Evidence for pre- and post-power stroke of cross-bridges of contracting skeletal myofibrils. Biophys. J. 100, 1024–1033 [DOI] [PMC free article] [PubMed] [Google Scholar]
- 42. Lakowicz J. R. (2006) Principles of Fluorescence Spectroscopy, Springer, New York [Google Scholar]
- 43. Herrmann C., Sleep J., Chaussepied P., Travers F., Barman T. (1993) A structural and kinetic study on myofibrils prevented from shortening by chemical cross-linking. Biochemistry 32, 7255–7263 [DOI] [PubMed] [Google Scholar]
- 44. Tsaturyan A. K., Bershitsky S. Y., Burns R., Ferenczi M. A. (1999) Structural changes in the actin-myosin cross-bridges associated with force generation induced by temperature jump in permeabilized frog muscle fibers. Biophys. J. 77, 354–372 [DOI] [PMC free article] [PubMed] [Google Scholar]
- 45. Bershitsky S. Y., Tsaturyan A. K., Bershitskaya O. N., Mashanov G. I., Brown P., Burns R., Ferenczi M. A. (1997) Muscle force is generated by myosin heads stereospecifically attached to actin. Nature 388, 186–190 [DOI] [PubMed] [Google Scholar]
- 46. Barman T., Brune M., Lionne C., Piroddi N., Poggesi C., Stehle R., Tesi C., Travers F., Webb M. R. (1998) ATPase and shortening rates in frog fast skeletal myofibrils by time-resolved measurements of protein-bound and free Pi. Biophys. J. 74, 3120–3130 [DOI] [PMC free article] [PubMed] [Google Scholar]
- 47. Ushakov D. S., Caorsi V., Ibanez-Garcia D., Manning H. B., Konitsiotis A. D., West T. G., Dunsby C., French P. M., Ferenczi M. A. (2011) Response of rigor cross-bridges to stretch detected by fluorescence lifetime imaging microscopy of myosin essential light chain in skeletal muscle fibers. J. Biol. Chem. 286, 842–850 [DOI] [PMC free article] [PubMed] [Google Scholar]
- 48. Ling N., Shrimpton C., Sleep J., Kendrick-Jones J., Irving M. (1996) Fluorescent probes of the orientation of myosin regulatory light chains in relaxed, rigor, and contracting muscle. Biophys. J. 70, 1836–1846 [DOI] [PMC free article] [PubMed] [Google Scholar]
- 49. Buschmann V., Kramer B., Koberlink (2009) Quantitive FCS. Determination of confocal volume by FCS and bead scabnning with MicroTime 200. PicoQuant, Application note Quantitative FCS version 1.1 [Google Scholar]
- 50. Bagshaw C. R. (1982) Muscle Contraction, Chapman & Hall, London [Google Scholar]
- 51. Midde K., Rich R., Hehreiter V., Raut S., Luchowski R., Hinze C., Fudala R., Gryczynski I., Gryczynski Z., Borejdo J. (2012) in Skeletal Muscle: Physiology, Classification and Disease (Willems M., ed) Nova Science Publishers, Chichester, United Kingdom [Google Scholar]
- 52. Kapusta P., Wahl M., Benda A., Hof M., Enderlein J. (2007) Fluorescence lifetime correlation spectroscopy. J. Fluoresc. 17, 43–48 [DOI] [PubMed] [Google Scholar]
- 53. Magde D., Elson E. L., Webb W. W. (1974) Fluorescence correlation spectroscopy. II. An experimental realization. Biopolymers 13, 29–61 [DOI] [PubMed] [Google Scholar]
- 54. Elson E. L. (1985) Fluorescence correlataion spectroscopy and photobleaching recovery. Annu. Rev. Phys. Chem. 36, 379–406 [Google Scholar]
- 55. Elson E. L. (2007) Introduction to FCS, University of North Texas, Fort Worth, TX [Google Scholar]
- 56. Mettikolla P., Calander N., Luchowski R., Gryczynski I., Gryczynski Z., Zhao J., Szczesna-Cordary D., Borejdo J. (2011) Cross-bridge kinetics in myofibrils containing familial hypertrophic cardiomyopathy R58Q mutation in the regulatory light chain of myosin. J. Theor. Biol. 284, 71–81 [DOI] [PMC free article] [PubMed] [Google Scholar]
- 57. Muthu P., Kazmierczak K., Jones M., Szczesna-Cordary D. (2011) The effect of myosin RLC phosphorylation in normal and cardiomyopathic mouse hearts. J. Cell Mol. Med. 10, 1582–4934 [DOI] [PMC free article] [PubMed] [Google Scholar]
- 58. James J., Robbins J. (2011) Signaling and myosin-binding protein C. J. Biol. Chem. 286, 9913–9919 [DOI] [PMC free article] [PubMed] [Google Scholar]


