

Abstract
Through protein degradation, the proteasome plays fundamental roles in different cell compartments. Although the composition of the 20S catalytic core particle (CP) has been well documented, little is known about the composition and dynamics of the regulatory complexes that play a crucial role in its activity, or about how they associate with the CP in different cell compartments, different cell lines, and in response to external stimuli. Because of difficulties performing acceptable cell fractionation while maintaining complex integrity, it has been challenging to characterize proteasome complexes by proteomic approaches. Here, we report an integrated protocol, combining a cross-linking procedure on intact cells with cell fractionation, proteasome immuno-purification, and robust label-free quantitative proteomic analysis by mass spectrometry to determine the distribution and dynamics of cellular proteasome complexes in leukemic cells. Activity profiles of proteasomes were correlated fully with the composition of protein complexes and stoichiometry. Moreover, our results suggest that, at the subcellular level, proteasome function is regulated by dynamic interactions between the 20S CP and its regulatory proteins—which modulate proteasome activity, stability, localization, or substrate uptake—rather than by profound changes in 20S CP composition. Proteasome plasticity was observed both in the 20S CP and in its network of interactions following IFNγ stimulation. The fractionation protocol also revealed specific proteolytic activities and structural features of low-abundance microsomal proteasomes from U937 and KG1a cells. These could be linked to their important roles in the endoplasmic reticulum associated degradation pathway in leukemic cells.
The proteasome is the proteolytic machinery of the ubiquitin-proteasome system (UPS)1, the main pathway responsible for degradation of intracellular proteins. As the major cellular protease, the proteasome is a key player in eukaryotic protein homeostasis and dysregulation of the UPS has been involved in neurodegenerative diseases and cancers. Because of this, proteasomes have been identified as therapeutic targets, especially for some cancers (1). Therefore, understanding the structure and function relationship controlling proteasome activity is of major interest in biology.
Mammalian proteasomes are composed of a central α7β7β7α7 barrel-shaped catalytic core particle (CP), the 20S proteasome, the structure of which has been determined (2). In cells, the 20S proteasome has been found as an isolated complex, and associated with one or two regulatory particles (RPs) of identical or different protein composition (3). Four RPs have been identified: 19S, PA28αβ, PA28γ, and PA200. The 26S proteasome is a particular complex in which the CP is capped by two 19S RPs, forming a 2.5 MDa complex. Because of a high level of heterogeneity and to the dynamics of the complex, the structure of the mammalian 26S proteasome has yet to be fully determined, but major progress has been made, resulting in a suggested spatial arrangement for the yeast 26S proteasome (4, 5). In the 19S complex, some specific subunits have specialized functions: poly-ubiquitinated (polyUb) substrate recognition, ATP-unfolding, and ubiquitin recycling. These allow ubiquitin-dependent protein degradation. In addition to the RPs, other proteasome interacting proteins (PIPs) bind proteasome complexes and affect their efficiency. These include Ecm29, which plays a role in yeast 26S proteasome assembly and stability (6–8).
The CP degrades proteins through three main proteolytic activities, defined as trypsin-like (T-like), chymotrypsin-like (ChT-like), and peptidyl-glutamyl peptide hydrolyzing (PGPH). These activities are exerted by the three beta catalytic subunits, β2, β5, and β1, respectively. An alternative form of the 20S proteasome has been characterized, the immuno-proteasome, where the three standard catalytic subunits are replaced by the so called immuno-subunit counterparts (β2i, β5i, β1i), which can modulate its activity. The proportion of 20S immuno-proteasome varies in different cell types and is increased in cells stimulated by interferon γ (IFNγ) (9, 10). In addition, other 20S proteasome subtypes made up of a mixed assortment of standard catalytic and immuno-subunits were recently described (11). These intermediate 20S proteasome complexes exist in high proportions in many human organs, but also in human tumor cells and dendritic cells. By generating specific antigenic peptides, intermediate 20S proteasome complexes can trigger an immune response (11). Although changes in the CP composition modulate the relative contribution of the cleavage specificity of each catalytic site, overall proteasome activity is drastically increased by association between the CP and RPs.
Cell imaging technologies or subcellular fractionation combined with protein blotting techniques have located proteasome complexes in several cellular compartments, mainly the cytosol, nucleus, and associated with the cytoplasmic face of the ER (12). Unlike these antibody-based techniques, quantitative proteomic approaches provide a global view of the cellular distribution of proteins in all their physiological forms (spliced, post-translationally modified, etc.) (13) and have revealed intracellular proteasome relocalization following DNA damage (14). Given the broad function of proteasomes, in quality control, antigenic peptide generation, or short-lived protein-tuned regulation, the cell is likely to adapt proteasome plasticity and dynamics to meet specific subcellular needs or to respond to stress or other stimuli. However, the precise intracellular subunit composition and distribution of proteasome complexes remains largely undetermined. This could be explained by the highly dynamic state of proteasome complexes, their heterogeneity and instability, which make them inherently difficult to study. To deal with this, efficient strategies are needed to purify and quantify fully assembled, active proteasome complexes in homogeneous cellular fractions. These strategies will help us to understand how cells adapt proteasome activity to their needs.
In vivo formaldehyde cross-linking can be an efficient tool to study protein–protein interactions and cellular networks (15). It has recently been used to stabilize labile proteasome complexes, allowing the study of the proteasome network in yeast (16) and human cells (17) by quantitative proteomic analyses.
In this article, we describe an integrated strategy combining in vivo cross-linking, efficient cell fractionation, affinity purification, and robust label-free quantitative proteomics. We have used this strategy to determine the intracellular distribution of fully assembled active proteasome complexes in human leukemic cells for the first time. Following IFNγ stimulation, our strategy also revealed recruitment of specific PIPs (known to participate in the UPS) to microsomal proteasome complexes. This suggests an important role for these complexes in the endoplasmic reticulum associated degradation (ERAD) pathway.
MATERIALS AND METHODS
Cell Lines and Culture Conditions
The U937 cell line was grown in Roswell Park Memorial Institute 1640 media supplemented with 10% fetal bovine serum, 2 × 10⁻³ m glutamine, 100 units/ml penicillin, 100 μg/ml streptomycin at 37 °C, and 5% CO2. KG1a cell lines were cultured with 20% fetal bovine serum. Cells were treated with interferon-γ (R&D Systems, Minneapolis, MN) at a concentration of 20 ng/ml in fresh medium.
Formaldehyde In Vivo Cross-Linking, Cellular Fractionation and Proteasome Purification
Formaldehyde in vivo cross-linking was performed as previously described (17). For the optimization experiments, several concentrations of the cross-linker were tested (0, 0.1, 0.2, 0.3, and 0.5%). Cross-linked cells were stored at −80 °C.
2 × 10⁸ cells were lysed with 2 ml of buffer A (10 mm Hepes pH 7.9, 10 mm KCl, 5 mm MgCl2, 10% glycerol, 10 mm ATP, protease, and phosphatase inhibitor (Roche)) for 30 min at 4 °C, and centrifuged. Supernatants (cytosolic fraction) were collected and pellets were washed with 10 ml of buffer A and centrifuged. Pellets were resuspended in 2 ml of buffer B (buffer A with 1% Nonidet P-40) for 30min at 4 °C, and centrifuged. Supernatants (microsomal fraction) were collected and pellets were washed with 10 ml of buffer B and centrifuged. Pellets were resuspended in 2 ml of buffer C (10 mm Tris pH 8, 100 mm NaCl, 1 mm EDTA, 0,5 mm EGTA, 10% glycerol, 1% Nonidet P-40, 10 mm ATP, protease, and phosphatase inhibitor) (nuclear fraction). Nonidet P-40 (1% final concentration) was added to the cytosolic fraction and the three fraction were sonicated and centrifuged. Proteasome purification was performed by affinity chromatography with the mouse IgG1 monoclonal antibody MCP21 (European Collection of Cell Cultures) directed against the human α2 subunit of 20S proteasome, as previously described (17). Briefly, each extract sample was incubated with 100 mg of CNBr Sepharose beads (GE Healthcare) coupled with 0.8 mg MCP21 antibody. Supernatants (S1) were collected and beads were washed three times with 40 bed volumes of washing buffer (20 mm Tris-HCl pH 8, 1 mm EDTA, 10% glycerol, 150 mm NaCl, 0.1% Nonidet P-40, and 2 mm ATP and MgCl2) and proteins were eluted with 0.5 ml of elution buffer (20 mm Tris-HCl pH 8, 1 mm EDTA, 10% glycerol, 3 m NaCl, and 2 mm ATP and MgCl2). Beads were washed and incubated with supernatants S1. Two cycles of purification were repeated and the three eluates were finally pooled.
Cellular Fractionation of Noncrosslinked Cells
To fractionate noncrosslinked cells, the same protocol was used except that Nonidet P-40 concentration in buffer B and C was set to 0.1% instead of 1%, the incubation of cells with each buffer was reduced to 15 min.
Western Blot Analysis
Each elution fraction was precipitated with 20% trichloroacetic acid and washed twice with acetone. Samples were heated for 5 min (noncrosslinked) or 30 min (crosslinked) at 95 °C to denature proteins and reverse formaldehyde crosslinks. Proteins were resolved by 4–12% gradient SDS-PAGE (NuPAGE 4–12% Novex BisTris Gels, 1.5 mm; Invitrogen, Carlsbad, CA). After electrophoresis, proteins were transferred to a polyvinylidene difluoride membrane (Hybond-P, Amersham Biosciences, Piscataway, NJ, USA). The membrane was blocked with 10% nonfat milk in PBS-buffer and incubated over night with the anti-GAPDH (FL-335 Santa-Cruz Biotechnology, Santa Cruz, CA), histone H1 (AE-4 Santa-Cruz Biotechnology), calnexin (C5C9 Cell Signaling Technology, Danvers, MA), phosphor-S6 (D68F8, Cell Signaling), S6 (54D2, Cell Signaling), MCP21 (European Collection of Cell Cultures), or 20S proteasome (PW8155 Enzo Life Sciences, Lausen, Switzerland) antibodies at 4 °C. After washing four times with PBST-buffer (PBS with 0.1% Tween-20), the membrane was incubated at room temperature for 1 h with horseradish peroxidase-conjugated secondary antibody (Santa Cruz Biotechnology) diluted in PBST-buffer. The detected protein signals were visualized by an enhanced chemiluminescence reaction system using the Amersham Biosciences ECL kit and exposition to Amersham Biosciences hyperfilm ECL (Amersham Biosciences, Arlington Heights, IL, USA).
Immunofluorescence Analysis of Proteasome Complexes
U937 cells were fixed in 3.7% final concentration of formaldehyde in PBS for 10 min at 37 °C. After washing three times with PBS, cells were then permeabilized with 0.1% Triton X-100 in PBS for 5 min. After washing, cells were labeled with the MCP21 antibody at 3 μg/ml, washed and then incubated with the secondary antibody coupled to Alexa fluor 488 (Molecular Probes, Eugene, OR) and mounted on slides with Vectashield (Vector Laboratories Inc., Burlingame, CA) containing DAPI. Confocal images were obtained by means of a confocal laser microscopy system (Leica, St-Gallen, Switzerland). Images were collected by scanning stained cells sequentially under a 100× objective lens.
20S Proteasome Quantification by ELISA Assay
The sandwich ELISA used here was a combination of a monoclonal antibody (MCP21) recognizing the α2 subunit of human 20S proteasome and a polyclonal rabbit anti-20S antibody (PW 8155), which labels different subunits of the 20S complex. ELISA assays were realized in 96-well plates (IMMULON HBX 4, Thermo Scientific, Milford, MA, USA). The plate was coated with 100 μl MCP21 monoclonal antibody at 5 μg/ml at 4 °C overnight. Wells were then washed three times with PBS/T-buffer. Nonspecific sites were blocked by incubation with 2% BSA in PBS for 1 h at room temperature under slow shaking. The plate was washed three times with PBS/T-buffer. The samples were then deposited in triplicate and incubated for 2 h at room temperature. The plate was washed with PBS/T-buffer and then incubated with the polyclonal 20S antibody for 1 h at room temperature under slow shaking. The plate was washed three times with PBS/T-buffer and antibody binding was detected by using horseradish peroxidase-conjugated anti-rabbit antibody and 2 mg/ml ABTS substrate (2,2-azino-bis(3-ethylbenzthiazoline-6-sulfonic acid)). The reaction was monitored by measurement of the optical density at 416 nm (μQuant; Bio-Tek instruments, Inc., Winooski, VT, USA). The quantity of proteasome in the sample was calculated from the calibration curve obtained with purified 20S proteasome from human erythrocytes (BIOMOL International). A linear dose-response was observed between 0 and 20 ng.
Determination of Oxidative Stress
Oxidized proteins were visualized with the OxyBlot protein oxidation detection kit (Chemicon International, Temecula, CA) via immunodetection of carbonyl groups.
Proteasome Activity Assay
The assay was performed in 96-well black plates (Greiner Bio-One, Frickenhausen, Germany). A 10 μl aliquot of each fraction lysate was added to 40 μl of Tris-HCl 100 mm and 50 μl of Suc-LLVY-AMC (for chymotrypsin-like activity), Boc-LRR-AMC (for trypsin-like activity) and Z-LLE-AMC (for PGPH activity) substrate in 200 mM Tris-HCl, pH 8 (BIOMOL International) at a final concentration of 400 μm/well. The kinetic assays were performed at 37 °C in a FLX-800 spectrofluorimeter (BIOTEK, Winooski, VT, USA) over 90 min with one reading every 5 min, at 360 nm for excitation and 460 nm for emission.
Detailed LC-MS/MS Analysis, Data Search and Validation
Each elution fraction was precipitated with 20% trichloroacetic acid and washed with acetone. Samples were boiled 30 min at 95 °C in Laemmli buffer to reduce and denature proteins and reverse formaldehyde cross-links. Proteins were alkylated with 100 mm chloro-acetamide for 30 min at room temperature in the dark. Proteins were concentrated in a single band on a 12% acrylamide SDS-PAGE gel and visualized by colloidal Coomassie Blue staining. One-shot analysis of the entire mixture was performed. A single band, containing the whole sample, was cut and washed in 50 mm ammonium bicarbonate for 15 min at 37 °C followed by a second wash in 50 mm ammonium bicarbonate, acetonitrile (1:1) for 15 min at 37 °C. Trypsin (Promega, Charbonnières, France) digestion was performed over night at 37 °C. The resulting peptides were extracted from the gel in three steps: a first incubation in 50 mm ammonium bicarbonate for 15 min at 37 °C and two incubations in 10% formic acid, acetonitrile (1:1) for 15 min at 37 °C. The three collected extractions were pooled with the initial digestion supernatant, dried in a SpeedVac, and resuspended with 2% acetonitrile, 0.05% trifluoroacetic acid. The peptides mixtures were analyzed by nano-LC-MS/MS using an Ultimate3000 system (Dionex) coupled to an LTQ-Orbitrap Velos mass spectrometer (Thermo Fisher Scientific, Bremen, Germany). Five microliters of each peptide sample corresponding to an equivalent initial quantity of 20S proteasome (estimated by ELISA) of 2.5 μg were loaded on a C18 precolumn (300-μm inner diameter × 5 mm; Dionex) at 20 μl/min in 5% acetonitrile, 0.05% trifluoroacetic acid. After 5 min of desalting, the precolumn was switched on line with the analytical C18 column (75-μm inner diameter × 15 cm; PepMap C18, Dionex) equilibrated in 95% solvent A (5% acetonitrile, 0.2% formic acid) and 5% solvent B (80% acetonitrile, 0.2% formic acid). Peptides were eluted using a 5–50% gradient of solvent B during 230 min at a 300 nl/min flow rate. The LTQ-Orbitrap was operated in data-dependent acquisition mode with the Xcalibur software. Survey scan MS spectra were acquired in the Orbitrap on the 350–1800 m/z range with the resolution set to a value of 60,000. The 20 most intense ions per survey scan were selected for collision-induced dissociation fragmentation, and the resulting fragments were analyzed in the linear trap (LTQ). Dynamic exclusion was used within 60 s to prevent repetitive selection of the same peptide. The Mascot Daemon software (version 2.3.2; Matrix Science, London, UK) was used to perform database searches, using the Extract_msn.exe macro provided with Xcalibur (version 2.0 SR2; Thermo Fisher Scientific) to generate peaklists. The following parameters were set for creation of the peaklists: parent ions in the mass range 400–4500, no grouping of MS/MS scans, and threshold at 1000. A peaklist was created for each analyzed fraction, and individual Mascot (version 2.3.01) searches were performed for each fraction. The data were searched against Homo sapiens entries in Swiss-Prot TrEMBL database (17,035,495 sequences). This database consists of UniProtKB/Swiss-Prot Protein Knowledgebase human release 2011_09 merged in house with UniProtKB/TrEMBL Protein Database release 2011_09. Carbamidomethylation of cysteines was set as a fixed modification, and oxidation of methionine and protein N-terminal acetylation were set as a variable modifications. Specificity of trypsin digestion was set for cleavage after Lys or Arg, and two missed trypsin cleavage sites were allowed. The mass tolerances in MS and MS/MS were set to 5 ppm and 0.8 Da, respectively, and the instrument setting was specified as “ESI-Trap.” Mascot results were parsed with the in-house developed software Mascot File Parsing and Quantification (MFPaQ) version 4.0 (18), and protein hits were automatically validated if they satisfied one of the following criteria: identification with at least one top ranking peptide of a minimal length of six amino acids and with a Mascot score higher than the identity threshold at p = 0.001 (99.9% probability) or at least two top ranking peptides each of a minimal length of six amino acids and with a Mascot score higher than the identity threshold at p = 0.05 (95% probability). To calculate the false discovery rate (FDR), the search was performed using the “decoy” option in Mascot, and MFPaQ used the same criteria to validate decoy and target hits. The FDR was calculated at the protein level (FDR = number of validated decoy hits/(number of validated target hits + number of validated decoy hits) ×100). Protein hits were further automatically validated using MFPaQ, our in-house developed software, with a FDR of 1% on proteins (minimum peptide length of six amino acids). Proteins identified with exactly the same set of peptides were grouped, and only one member of the protein group was reported (the one that we considered as the most significant according to the functional description given in the UniProtKnowledgebase). Highly homologous protein hits, that is, proteins identified with top ranking MS/MS queries also assigned to another protein hit of higher score (red, nonbold peptides), were detected by the MFPaQ software and were considered as individual hits and included in the final list only if they were additionally assigned a specific top ranking (red and bold) peptide of score higher than 25 (p value <0.05). A second search was performed separately to identify ubiquitination on proteins, especially on ubiquitin. Two other variable modifications were added to the search, GlyGly and LeuArgGlyGly, as trypsin cleavage of each linked ubiquitin moiety leaves a characteristic tag of two glycines, or the peptide LRGG if a tryptic missed cleavage occurs, on the ubiquitin lysine involved in the chain linkage.
Data Quantification
Relative Quantification of Proteins
Quantification of proteins was performed using the label-free module implemented in the MFPaQ v4.0.0 software (http://mfpaq.sourceforge.net/). For each sample, the software uses the validated identification results and extracts ion chromatograms (XIC) of the identified peptide ions in the corresponding raw nanoLC-MS files, based on their experimentally measured retention time (RT) and monoisotopic m/z values. The time value used for this process is retrieved from Mascot result files, based on an MS2 event matching to the peptide ion. If several MS2 events were matched to a given peptide ion, the software checks the intensity of each corresponding precursor peak in the previous MS survey scan. The time of the MS scan, which exhibits the highest precursor ion intensity, is attributed to the peptide ion and then used for XIC extraction as well as for the alignment process. Peptide ions identified in all the samples to be compared were used to build a retention time matrix to align LC-MS runs. If some peptide ions were sequenced by MS/MS and validated only in some of the samples to be compared, their XIC signal was extracted in the nanoLC-MS raw file of the other samples using a predicted RT value calculated from this alignment matrix by a linear interpolation method. Quantification of peptide ions was performed based on calculated XIC area values. To perform protein relative quantification in different samples, a protein abundance index was calculated, defined as the average of XIC area values for the three most intense reference tryptic peptides identified for this protein (the three peptides exhibiting the highest intensities across the different samples were selected as reference peptides, and these same three peptides were used to compute the PAI of the protein in each sample; if only one or two peptides were identified and quantified in the case of low-abundant proteins, the PAI was calculated based on their XIC area values). All PAIs were normalized (Normalized PAIs = NPAIs) with the total amount of 20S proteasome, which was defined as the mean of the PAIs of 20S proteasome noncatalytic subunits (subunits α1 to α7, β3, β4, β6, and β7). Detailed calculations are explained in supplementary Information S1.
Normalized PAI values were used for statistical evaluation of the significance of expression level variations. Equivalence of variances was checked using the Statgraphics software (STATGRAPHICS Centurion XV, STATPOINT, Inc., Herndon, Virginia). Probability values p were determined by one-way analysis of variances (ANOVA) with the Bonferroni multiple comparisons procedure.
Comparison of Three Absolute LC-MS-based Quantification Methods
The knowledge of the stoichiometry of 20S proteasome complex was used to compare three absolute MS-based quantification methods : (1) the protein abundance index (PAI) (19), (2) a method relying on the calculation of the summed peptide intensities normalized by the protein molecular mass (20, 21), and (3) the spectral counting approach (22).
Indeed, theoretically, the sum of the amounts calculated for each standard subunit (β1, β2, or β5) and its immunosubunit counterpart (β1i, β2i, or β5i, respectively) corresponding to the three catalytic subunit types should equal the total level of 20S proteasome, calculated independently with the levels of constitutive subunits (α1 to α7; β3; β4; β7). Importantly, the peptides chosen for the quantification of catalytic immuno and nonimmuno subunits showed no homology at all. Detailed calculations are explained in supplementary Information S1.
So, these independent values were used to compare the accuracy and dispersion of the three absolute quantification methods tested.
Estimation of the Fraction of 20S Proteasome Subtypes by Label-free MS
The proportions of all proteasome subtypes were determined as already reported by Guillaume et al. (11) and explained here after:
As β5i is integrated in all intermediate-type 20S proteasomes, the fraction of its standard counterpart β5 represents the fraction of standard proteasome. The subunit β2i being integrated only in immunoproteasomes, its level corresponds to the fraction of immunoproteasome. The β1i-containing proteasomes (β1i) correspond to immunoproteasomes and intermediate proteasomes β1i-β5i, and the β5i-containing proteasomes (β5i) correspond to immunoproteasomes and both types of intermediate proteasomes. Thus, the absolute amounts of β2i, β5, β5i, and β1i catalytic subunits given by MS-based quantitative method were used to calculate the proportions of all 20S proteasome subtypes (standard, immuno, intermediate β5i, and intermediate β5i –β1i), as explained in more details in supplementary Information S1.
Estimation of the Stoichiometry of the Different Proteasome Complexes by Label-free MS
The stoichiometry of the different proteasome complexes was estimated using the PAIs of their subunits as explained later. Five types of complexes were considered: the free 20S core complex, the 19S-associated, the PA28αβ-associated, the PA28γ-associated, and the PA200-associated proteasomes. The 19S-associated proteasome fraction was obtained by dividing the mean NPAI of the 19S subunits with the total 20S proteasome quantity, which corresponded to the mean NPAI of the noncatalytic subunits of the 20S core divided by two as two constitutive subunits are integrated in each 20S core complex. The fraction of 20S proteasome in association with PA28αβ was calculated from the normalized NPAIs of each PA28α and PA28β subunits, and by taking into account the stoichiometry of both subunits in the final α3β4 heptameric complex (23). This was also the case for the PA28γ-associated 20S proteasome as the PA28γ regulator is a homo-heptameric complex (24). The fraction of the 20S core in interaction with PA200 was obtained directly from the normalized PAI of this large monomeric protein. In the cases of PA28γ and PA200 activators where a unique protein (and therefore only three peptides) was used for the quantification, the variability is expected to be higher than for the 20S, 19S, and PA28αβ hetero multimeric complexes for which the abundances of two to more than 10 proteins were averaged. As each activator can be loaded on the 20S platform in a stoichiometry of one or two activators per 20S core, we approximated the fraction of activator-associated proteasomes by considering that the overall (20S CP/activator) stoichiometry was (1:1.5). So, the fractions obtained were multiplied by a factor of 0.75 to take this stoichiometry into account. The hybrid forms corresponding to a 20S core in interaction with a type of regulator, like 19S, on one side, and another type of regulator, like PA28, on the other side, could not be considered separately. Finally, the free 20S proteasome fraction corresponded to the remaining 20S entities, after the substraction of the different regulator-associated 20S forms from the total 20S complexes. The detailed calculations are given in supplementary Information S1.
Quantification of K48 Polyubiquitin Chains
The two peptides searched to quantify K48 polyubiquitin chains have been identified at least once with a significant score (p < 0.05) in one experiment. So, the knowledge of the precise retention time as well as the high mass accuracy of the orbitrap mass spectrometer allows confident extraction of the LC-MS trace of each peptidic ion in the other experiments (tolerance : ± 5 ppm on m/z and ± 1 min on tR, after realignment).
The area of the following peptide sequences and ionic species were summed to quantify K48 polyUb chains: LIFAGK(GG)QLEDGR (2+, m/z 730.8962, tR 60 ± 1 min; 3+, m/z 487.6001, tR 60 ± 1 min) and LIFAGK(LRGG)QLEDGR (3+, m/z 577.3283, tR 59 ± 1 min; 4+, m/z, 433.2481, tR 59 ± 1 min).
Statistical Analyses
All statistics were performed on three biological replicates. Equivalence of variances was checked using the Statgraphics software (STATGRAPHICS Centurion XV, STATPOINT, Inc., Herndon, Virginia). Probability values p were determined by one-way and two-tailed analysis of variances (ANOVA). We applied a multiple testing correction of p values using the Bonferroni procedure. Differences were considered as statistically significant at a confidence level of 95% (*), 99% (**), or 99.9% (***).
RESULTS AND DISCUSSION
Cell Fractionation and Integrity of In Vivo Cross-Linked Proteasome Complexes
Proteasome complexes have been characterized in the cytoplasm and in the nucleus of eukaryotic cells but few data concerned the distribution and the dynamics of the different associated regulators in each cell compartment. As reviewed recently (25), an interesting approach to purify all PIPs in a single purification scheme is to target one subunit of the 20S CP while maintaining the labile bonds within the entire complex, so that long-distance linkages can be preserved. We have developed an integrated strategy combining in vivo formaldehyde cross-linking for an early stabilization of proteasome complexes, cellular fractionation of cross-linked cells, immunopurification of proteasome complexes, and label-free mass spectrometry quantification of proteins (Fig. 1). Most steps of the protocol, in particular the cross-linking procedure, were optimized not only to allow a reasonably good cell fractionation in cytosolic, microsomal, and nuclear fractions but also to freeze the complexes in a functional state (Fig. 2). The presence of cross-linking agent did not affect the total recovery of 20S proteasome complexes with a purification yield around 90% (Fig. 2A). However, the proteasome activity measured after immunopurification of proteasome complexes using fluorogenic peptides was increased 40 times after using 0.1% formaldehyde (Fig. 2A). At that crosslinker concentration, major cytoplasmic, microsomal, and nuclear protein markers localize in their expected compartments (Fig. 2B, 2C, supplemental Data 3). Further increase in formaldehyde concentration resulted in a decrease in proteasome specific activity (above 0.2%, Fig. 2A), which may be explained by important perturbations at the active sites reducing their accessibility to the substrate, and in a less efficient fractionation of GAPDH and actin (as early as 0.2% formaldehyde, Fig. 2B), which is probably the result of formaldehyde-stabilized networks of cytoskeletal and membrane-bound proteins. Importantly for the determination of proteasome complexes intracellular distribution, we have shown that in vivo cross-linking is a critical step to avoid the leakage of proteasome complexes, in particular from the nuclear to the cytosolic fraction (Fig. 2B). This result seems in accordance with the nucleoplasmic location of proteasomes (12). Proteasomes have indeed been localized both in the cytoplasm and the nucleus of various cell types (12) and immunofluorescence analyses confirmed this observation in U937 cells (Fig. 2D). When analyzing x-ray repair cross-complementing protein 5 (XRCC5, also known as Ku80), an abundant nuclear protein showing both nucleoplasmic and nucleolar localization (26), in the three extracted compartments, we detected a significant fraction, probably the nuclear soluble part, in the cytosolic fraction of the nontreated cells whereas the entire protein pool was retained in the nucleus fraction of formaldehyde cross-linked cells (Fig. 2B). No leakage was noticed for chromatin-associated histone H1 in any case, confirming previous observations that hypotonic buffers in association with nonionic detergents like Triton X-100 or Nonidet P-40 are usually used to extract soluble nuclear proteins without disturbing the overall nuclear structure (27, 28). Furthermore, in addition to retaining proteins efficiently to their original compartments, low formaldehyde concentration could help to dramatically increase the association of all RPs to the CP, as clearly shown by label-free quantitative mass spectrometry data (supplemental Fig. S1 - supplemental Data 2). This RPs stabilization after in vivo formaldehyde cross-linking may then explain the important increase in specific activity measured. Overall, the formaldehyde concentration of 0.1% gave the best compromise regarding cell fractionation efficiency, proteasome specific activity, and associated regulators recovery for both leukemic cell lines studied (U937 and KG1a). Thus, 0.1% formaldehyde was chosen for in vivo cell cross-linking in the following experiments. This low formaldehyde concentration compared with the ones usually used for ChIP assays (15) allowed the optimization of a good quality fractionation protocol (Fig. 2C, supplemental Data 3) and was compatible with the recovery of fully assembled active proteasome complexes in each fraction (Fig. 2A supplemental Figs. S1, S2). The extraction of nuclear proteins usually involves high salt concentrations or detergents and we observed that it is not compatible with maintenance of proteasome integrity without protein–protein interaction stabilization. This probably explains why the very few attempts to isolate the diversity of fully assembled proteasome populations have been performed only from cytoplasmic extracts (29, 30). To our knowledge, this is the first study reporting the purification and characterization of endogenous and functional proteasome complexes after subcellular fractionation of formaldehyde cross-linked cells.
Fig. 1.

Strategy used for the determination of subcellular proteasome complexes distribution in U937 and KG1a cells.
Fig. 2.
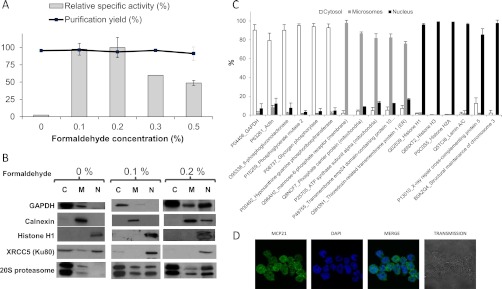
Optimization of cross-linking with formaldehyde and validation of the fractionation protocol. A, Effect of in vivo formaldehyde cross-linking on proteasome ChT-like specific activity and purification yield. U937 cells were in vivo treated with different concentrations of formaldehyde (0%, 0.1%, 0.2%, 0.3%, and 0.5%) to stabilize protein–protein interactions. Results were obtained with three biological replicates. Error bars indicate standard deviation. B, Cross-linking with formadehyde at 0.1% is essential to maintain proteasome in the nucleus during the fractionation protocol and is compatible with subcellular fractionation. U937 cells in vivo-treated (0.1 and 0.2%) or not (0%) with formaldehyde were fractionated and each fraction (C: cytosol, M: Microsomes; N: nucleus) was analyzed by Western blot with antibodies directed against GAPDH (cytoplasm marker), Calnexin (ER marker), Histone H1 (nucleus marker 1), XRCC5 (nucleus marker 2), and 20S proteasome. C, Quantitative Mass Spectrometry analysis of proteins from each cellular compartment validates the fractionation protocol with cells cross-linked with 0.1% formaldehyde. Proteins from cytosolic, microsomal, and nuclear fractions obtained from U937 cells cross-linked with 0.1% of formaldehyde were identified and quantified by label-free LC-MS/MS. Two biological replicates were performed. D, Cytoplasmic and nuclear localization of proteasome in U937 cells observed by immunofluorescence analysis. Error bars indicate standard deviation.
Quantitation and Functional Analyses of Proteasomes in Subcellular Compartments
The amount of 20S proteasome complexes in each subcellular fraction was determined using ELISA (Fig. 3A). These measurements showed that in both cell lines the main pool of 20S proteasome complexes was present in the cytosolic fraction, as already reported in other mammalian cell types (12, 31, 32), and represented more than 80% of the total proteasome content. The precise distribution of 20S proteasomes in the cytosolic, microsomal, and nuclear compartments was accurately quantified and was found to be 82, 7, and 11% for U937 cells and 88, 6, and 6% for KG1a cells, respectively. Thus, the distribution of the 20S catalytic core complex was only slightly different in the two cell lines. The total amount of 20S proteasome, however, was 1.5 higher in KG1a cells than in U937 cells, which confirmed previous measurements (33), and corresponded to 0.6 and 0.9% of the total protein content in U937 and KG1a cells, respectively. Because the cytosolic CP was the most abundant, variations in the nuclear and microsomal CP content could only be determined after rigorous subcellular fractionation in these cell lines.
Fig. 3.

Quantitation and functional analyses of proteasomes. A, The 20S proteasome and total protein distributions in the cellular compartments. Total proteins (lines) and 20S proteasome contents (bars) from 200 × 106 U937 and KG1a formaldehyde-crosslinked and fractionated cells were measured by Bradford and ELISA assays, respectively. The total cell lysate proteasome contents were calculated by adding the values obtained from the three subcellular compartments. B, Proteasome chymotrypsin-like (ChT-like) specific activities in cytosolic, microsomal, nuclear, and total protein lysates from U937 and KG1a fractionated cells. C, Proteasome ChT-like, trypsin-like (T-like) and Post-Glutamyl-Peptide-Hydrolysis (PGPH) specific activities in total protein lysates from U937 and KG1a nonfractionated cells. In A–C results were obtained from three biological replicates. Error bars indicate standard deviation.
The specific proteasome chymotrypsin-like activity (ChT-like) was then measured in each subcellular fraction using the synthetic fluorogenic peptide, Suc-LLVY-AMC, as described in the experimental section. The ChT-like activity could be properly attributed to proteasome by subtracting the residual activity after specific proteasome inhibition using MG132. Results obtained from the three different subcellular compartments (cytosol, microsome, and nucleus) extracts were used to estimate the proteolytic activity of the total cell lysate. The data presented in Fig. 3B were totally unexpected. Indeed, differences in proteasome specific activity were not only observed within the three cell compartments but also, for the same compartment and in particular for the microsomal fraction, between the two cell lines. Here again, the total specific activity was mainly representative of the cytosolic fraction showing 2.5 times more active proteasome complexes in U937 than in KG1a cells, whereas the specific activity of the nuclear proteasome was identical in the two cell lines and the microsomal proteasome was eight times more active in U937 than in KG1a cells (p = 3.10−5). As shown in Fig. 3C, comparison of the other two proteasome specific activities (trypsin-like and PGPH) in the total lysates of the two cell lines gave similar results showing a higher activity in U937 than in KG1a cells (2.8 and 3.0 fold more active, respectively, with p < 0.01).
These results suggest that variations in the 20S subunit composition or in associated activators are expected in the different compartments and in the two cell lines.
Subcellular Distribution of 20S Proteasome Subtypes
The subcellular distribution of proteasome complexes was determined using a label-free quantitative proteomics strategy based on the analysis of MS signals of tryptic peptides prepared by in-gel digestion of proteasome complexes immuno-purified from each subcellular fraction. Conditions were set up to enable a complete reversal of protein cross-links before the digestion step (supplemental Fig. S3). Peptides mixtures from each immuno-purified fraction were then analyzed by LC-MS/MS and protein identification and quantification were performed by bioinformatic data analysis using the in-house developed MFPaQ software (18) (supplemental Data 4).
Four main classes of 20S proteasome subtypes have been previously described with different sets of catalytic subunits: the standard form (β1,β2,β5), the immuno-form (β1i,β2i,β5i) and two immuno intermediary forms called “β5i” (β1,β2,β5i) and “β1i-β5i” (β1i,β2,β5i) (11) (Fig. 4A). To quantify these 20S proteasome subtypes, three label-free MS-based quantitative methods were compared (supplemental Fig. S4A). The protein abundance index strategy (19), which led to the best accuracy and standard deviation, was chosen to compute absolute quantification data for each 20S subunit (supplemental Fig. S4B). As expected, the abundances of catalytic subunits were found lower and more variable than the ones of the non-catalytic subunits. These data were then used to determine the distribution of the four described 20S subtypes in U937 and KG1a cell lines (Figs. 4A– 4B). In these two cell lines the distribution of 20S subtypes was similar in all subcellular compartments with a low proportion of “standard 20S proteasome,” representing less than 20%. A low proportion of standard 20S proteasome has already been observed for other antigen-presenting cells and in immune tissues (10, 11). However, when comparing the two cell lines, substantial differences were observed among the three forms containing at least one immuno-subunit. In KG1a cells, the intermediate β1i-5i was the major 20S subtype, whereas in U937 cells the four 20S subtypes were more equally distributed. Thus, these data give access to the precise distribution of the various 20S catalytic core complexes. This could also be achieved using ELISA but would require the sequential use of highly specific antibodies of each subunit to be measured (11). Besides, these data also demonstrate that the differences in the specific activity of the proteasome observed in different cell compartments, and in particular in U937 microsomal fraction, did not result from differences in the catalytic beta subunit composition of the CP.
Fig. 4.

Determination of 20S proteasome subunits subcellular distribution and stoichiometry. A, Schematic representation of the four main classes of 20S proteasome with different set of catalytic subunits (11). B, The proportions of all 20S proteasome subtypes were determined by label-free absolute quantification as detailed in the experimental section. C, Kinetic of immunoproteasome formation on IFNγ treatment (20 ng/ml) in the microsomal extract (0 h to 24 h). The proportions of all 20S proteasome subtypes at each time point were determined. In B–C results were obtained from three biological replicates. Error bars indicate standard deviation.
The sensitivity of the integrated strategy developed was further evaluated by following the dynamics of proteasome complexes after IFNγ stimulation in the U937 cell line (supplemental Data 5). According to previous results, a decrease in standard 20S proteasome content and a concomitant increase in immuno-proteasome content were expected. However, because the proportion of all immuno-subunit-containing 20S proteasome forms was already high (80%) in untreated cells, the putative variations in 20S core composition were expected to be small and should permit us to evaluate the sensitivity of the method. A 24 h time-course experiment was performed and showed a significant 5% decrease (p = 0.02) in the relative amount of the standard 20S proteasome (Fig. 4C). More interestingly, these data were in agreement with the rules of progressive incorporation of the catalytic immunosubunits in 20S proteasome complexes leading to the immuno-proteasome assembly (34). The intermediate proteasome forms β5i, then β5i-β1i, and finally the immuno-proteasome were successively increased at 4h, 8h, and after 12h, respectively, suggesting that β5i was first incorporated into nascent immature 20S proteasomes already containing β2 and β1 standard subunits, followed by incorporation of β5i and β1i in β2-containing 20S proteasome complexes. Finally de novo formation of full immuno-proteasome complexes occurred after 12 h of IFNγ stimulation to reach a 5% increase at 24 h, whereas intermediary forms tended to decrease again. These data clearly demonstrate that the integrated strategy used combining in vivo cross-linking, cell fractionation, proteasome immuno-purification, and robust label-free quantitative proteomics analyses is a very sensitive approach to determine the precise 20S proteasome composition and to decipher fine regulations of proteasome complexes in cells.
Subcellular Distribution of 20S Proteasome Activators and Inhibitors Correlate with Proteasome Specific Activities in the Two Leukemic Cell Lines
The developed protocol allowed the immuno-purification of endogenous and functional proteasome complexes with a high recovery of labile PIPs thanks to formaldehyde cross-linking. This proteasome interactome was quantified in each cellular compartment by quantitative label-free mass spectrometry. We also followed the dynamics of activator distribution after the treatment of U937 cells by IFNγ. A PIP abundance index, calculated as the ratio of the intensity of a PIP to the one of the 20S CP, was used to estimate the relative abundance of a 20S CP-associated PIP (Fig. 5A–5B and Fig. 6A). Importantly, the average of the signals corresponding to noncatalytic 20S CP subunits (subunits α1 to α7, β3, β4, β6, and β7) was used as an internal standard, allowing more robust quantification. These subunits are found in all proteasome complexes and their abundances were used to normalize the signal intensities of all the other proteins. This quantification workflow allowed us to obtain a median coefficient of variation of 7.6% across the three biological replicates (including all experimental steps: in vivo cross-linking, cell lysis, proteasome purification, sample preparation for MS analysis, and MS analysis itself) (supplemental Fig. S5). Our results showed that the relative spatial distributions of proteasome activators, 19S RP, PA28αβ, PA28γ, and PA200, differed from each other (Figs. 5A–5B). As expected, the PA28γ regulator was found mainly in the nucleus of both U937 and KG1a cells though a fraction of this 20S core activator was detected in the cytoplasmic fraction. In U937 cells, the amount of 20S CP-associated PA28γ complexes was threefold higher in the nucleus than in the cytoplasm (p = 0.001). On the opposite, 70% of the fraction of 20S-associated PA28αβ was found in the cytoplasm of both cell types, with a preferential localization in the cytosol (43 to 44%). The subcellular distribution of 19S RP associated to the 20S CP was mainly nuclear in KG1a cells (p < 0.01) whereas in U937 cells, this regulator was more equally shared between the microsomes and the nucleus, with a lower fraction in the cytosol (p < 0.001). Under IFNγ stimulation of U937 cells, the method was sensitive enough to detect a 30% significant increase of the PA28αβ cytokine-inducible complex in the three compartments after 24 h (p = 0.02; Fig. 6A). It is worthy of note that in the microsomal fraction, a similar bell-shape response was observed for several proteins belonging to the ubiquitination machinery (19S RP and all its major associated proteins).
Fig. 5.
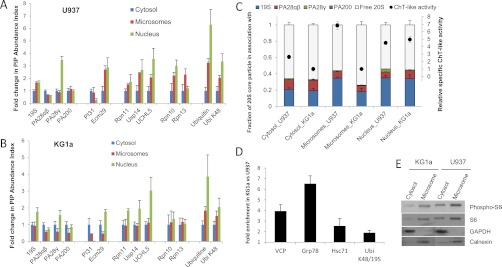
Proteasome Interacting Proteins subcellular distribution and stoichiometry of proteasome complexes in two leukemic cell lines. A, B, Proteasome regulators and major proteasome interacting proteins (PIPs) relative subcellular distribution in U937 (A) and KG1a (B) cells. Immuno-purified proteasome complexes were analyzed by label-free quantitative MS. The relative content of proteasome regulators and major PIPs was obtained by plotting their abundance indexes as a function of the cell compartment. This abundance index was normalized with the one of the cytosolic fractions to obtain a fold change in PIP abundance index. C, Chymotrypsin-like activity and stoichiometry of the different proteasome complexes in the three subcellular compartments of U937 and KG1a. The stoichiometry of the different proteasome complexes was estimated by label-free MS as explained in the experimental section. Four types of complexes were considered: the free 20S core complex, and the 20S proteasome associated to 19S, PA28αβ, PA28γ, and PA200. D, Protein quality control in the microsomes of U937 and KG1a. Calculation of the fold enrichment in KG1a versus in U937 of VCP, GRP78, Hsc71, and K48 polyUb chains per 19S RP was performed using the normalized PAIs. In A to D, results were obtained from three biological replicates. Error bars indicate standard deviation. E, Comparison of translation level and activity between U937 and KG1a. Phosphorylation of the small ribosomal subunit S6 and total S6 levels were indicative of translation activity and translation level, respectively. GAPDH and calnexin served as loading controls in the cytosol and in the microsomes, respectively. Detection was performed by Western blot analysis.
Fig. 6.

Dynamics of proteasome complexes under IFNγ stimulation. A, Proteasome regulators and major proteasome interacting proteins (PIPs) kinetics during IFNγ stimulation in U937 microsomes. The relative content of proteasome regulators and major PIPs was obtained by plotting their abundance indexes as a function of the time of IFNγ treatment. This abundance index was normalized with the one of the initial condition to obtain a fold change in PIP abundance index. B, Chymotrypsin-like activity and stoichiometry of the different proteasome complexes in microsomes of U937 during IFNγ stimulation. The stoichiometry of the different proteasome complexes was estimated by label-free MS as explained in the in the experimental section. Four types of complexes were considered: the free 20S core complex, and the 20S proteasome associated to 19S, PA28αβ, PA28γ, and PA200. Results were obtained from three biological replicates. Error bars indicate standard deviation.
The stoichiometry of the different proteasome complexes was estimated by label free MS as explained in detail in the experimental section. The results obtained are displayed on Fig. 5C. Whatever the compartment and the cell type, the 19S complex was the main 20S proteasome-associated activator, followed by the PA28αβ, PA28γ, and the PA200 complexes. If we consider all the regulator-associated 20S core complexes as what we call “activated 20S proteasome,” the fraction of activated proteasome represented almost half the total 20S proteasome pool in the nucleus (43 to 45% precisely), but a subsequently lower proportion, around 32 to 33%, in the cytosol of both cell types. Although microsomal proteasomes from U937 were highly activated (43%, similar to the nucleus level), only 25% of microsomal 20S complexes were associated with activators in KG1a. Though we cannot exclude other forms of regulation of proteasome activity (inhibitor, cofactor, or post-translational modification), these proteasome compositions must be correlated with the low cytosolic and the high nuclear specific activities of proteasome in both cell types, and also might explain the high proteolytic performance of the proteasome in the microsomal fraction of U937 (Fig. 3B). In the nuclei of the two cell lines, the proteasome activities were identical and so was the amount of activated proteasome. This must reflect proteasome functions directly related with nuclear functions such as DNA repair and transcription. Upon IFNγ stimulation in U937 cells, the only significant change in 20S proteasome activation was observed in the microsomal compartment (p = 0.002) where a proportion of 53% was reached after 8 h of treatment after which it returned to the basal level (Fig. 6B, supplemental Fig. S7A, S7B). Again, the proteasome ChT-like activity followed the same profile as the one of the activated 20S proteasome (Fig. 6B). PI31, an inhibitor of proteasome (35), was also quantified and showed a main cytoplasmic localization in the two leukemic cell lines (Fig. 5A–5B). In KG1a cells, the cytosolic PI31 was three times (p < 0.03) more abundant than in U937 cells (supplemental Fig. S6), which is in agreement with the low proteasome activity (Fig. 3B). Thus, activity profiles of proteasomes could be fully correlated to the association of RPs to the CP and to protein complex composition and stoichiometry. Moreover, our results confirm previous observations (12) that free CP indeed constitutes an important fraction of proteasomes, which might be involved in the ubiquitin-independent degradation of cellular proteins (36). Free 20S proteasome could also serve as a highly dynamic platform for regulator association to respond quickly to specific cellular demand (30). Indeed, the subcellular proteasome activity is, at least in the leukemic cell lines studied, rather regulated by finely tuned interaction of the 20S CP with proteasome activators and inhibitors than by variations in its subunit composition.
Dynamic Interactions with Major PIPs Regulate Proteasome Substrate Uptake and Subcellular Localization
Another level of proteasome activity regulation might be exerted by variable integration of Rpn10 and Rpn13, the two main proteasomal ubiquitin receptors (20). The other known ubiquitin receptors identified, hR23B, ubiquilin 1 and ubiquilin 3, were indeed found in substantial lower abundances (supplemental Fig. S6). Rpn10 and Rpn13 are required for the degradation of UPS substrates regulating important pathways like the cell cycle (37) and NF-kB activation (38), respectively, but several other receptors have also the ability to guide polyUb substrates to the proteasome (37). Rpn13 and to a lesser extent Rpn10 were the only 19S subunits that seemed to be integrated substoichiometrically into proteasomes (supplemental Fig. S6). Both Rpn10 and Rpn13 subunits settle at the apical part of the 19S RP (4, 5, 20). Human Rpn13 interacts dynamically with proteasomes (39) and could not be observed by cryo-electron microscopy (40). Noteworthy, Rpn10 was also the 19S subunit for which the IFNγ-induced increase was the most significant and important (factor 1.7; p = 0.009) and K48- polyUb chains, which are representative of proteasome substrates, were concomitantly increased by a similar factor (factor 1.8; p = 0.0005) (Fig. 6A) (supplemental Data 6). So, the reversible or labile integration of Rpn10 and Rpn13 subunits within the 19S complex might constitute an important mean to regulate polyubiquitinated substrates uptake by the proteasome.
Many other PIPs described in previous studies (25) were quantified. In particular, Usp14 and UCHL5, two major proteasome deubiquitinases (DUBs), are known to associate dynamically with the 19S regulator (39). Our results showed that, in the two human cell lines studied, Usp14 was nearly stoichiometric with the other 19S subunits whereas UCHL5 was more under represented (supplemental Fig. S6). This is in full agreement with the fact that UCHL5, also called UCH37, incorporates into the proteasome through interaction with Rpn13. We observed that the subcellular distribution profiles of these two DUBs were, as expected, similar to the one of the 19S RP, both in U937 and KG1a. A more striking observation was that this was also the case of Ecm29. This PIP known to promote 20S-19S assembly and stability in yeast (6–8) was also described as a molecular adapter recruiting 26S proteasome to specific cell compartments such as nucleus or membrane vesicles (41). Ecm29 indeed predominantly localized in the nucleus and/or the microsomes in U937 and KG1a but was also increased, together with 19S RP, at microsomal proteasomes upon IFNγ stimulation. Notably, Ecm29-mediated dissociation of yeast 20S CP–19S RP interaction was reported in oxidant conditions (42) but high levels of mammalian immunoproteasome were shown to be protective against this stress generated by INFγ-treatment (43). We therefore suspect that the high basal immunoproteasome content of U937 leukemic cells might considerably lower the oxidant effect induced by the cytokine because we did not measure any increase in the oxidation of proteins in the course of INFγ-treatment in U937 cells (supplemental Fig. S7C). Thus, our results strongly emphasize a major role of Ecm29 in 26S proteasome assembly or subcellular localization at particular sites where enhanced proteolysis is required (41).
Significance of Microsomal Proteasome Differences in Activity and Composition Between U937 and KG1a
The fractionation protocol enabled us to unravel important structural differences in the composition of microsomal proteasomes from U937 and KG1a cell lines. These mainly concerned the lower activation of the 20S core with the 19S RP in the KG1a microsomes and the subsequent activity loss generated by such structural feature. ER-associated proteasomes probably constitute the major fraction of these microsomal proteasomes. Indeed, numerous studies report highly abundant localization of the protease at the cytoplasmic face of the endoplasmic reticulum in eukaryotic cells (12, 44) where it is involved in the so-called endoplasmic reticulum associated degradation, a degradation process of abnormal and misfolded proteins extracted from the ER. When this pathway fails to degrade abnormal proteins, the unfolded protein response (UPR) is activated to induce adaptive responses aimed at increasing the levels of protein quality controls (ERAD) and at decreasing global translation (45, 46). In KG1a microsomes, polyUb substrates accumulated more at the 26S proteasome than in U937, as illustrated by the nearly twofold enrichment of K48 polyUb chains at the 19S RP of KG1a (Fig. 5D). This was probably the consequence of a lower proteolytic activity of the proteasome. Interestingly, the level of microsomal proteasome-associated valosin-containing protein (VCP), a marker of ERAD (47), as well as the one of Grp78, a microsomal Hsp70 protein associated to the UPR (45), were found four and six-fold increased in KG1a compared with U937, respectively (p < 0.001 for both proteins) (Fig. 5D), which suggest that the ERAD and UPR pathways are much more activated in KG1a than in U937 cells. Both proteins have been described as PIPs previously (17). Notably, the heat shock cognate 71 kDa protein (Hsc71), a known PIP localizing in cytoplasmic stress granules under proteasome inhibition, was also increased in KG1a microsomes (2.5 – fold, p = 0.005) and we measured that the translation process was much lower in KG1a than in U937 cells (Fig. 5E). Thus a dysfunction in the UPS degradation machinery at the ER membrane might consequently induce an ER stress, possibly activating the UPR and the ERAD processes in KG1a, and further leading to a global decrease in the translation. This unexpected result must be confirmed in other cell lines presenting a low level of microsomal associated translation.
Concluding Remarks
The proposed approach allows an in-depth investigation of the composition of proteasome complexes and a fine description of transitory associated proteins. The acquisition of robust proteomic quantitative data led to the determination of the precise intracellular distribution of regulatory complexes associated to the catalytic 20S core complex, which correlated well with the measured proteasome specific activities. Besides, discrete variations in nuclear and microsomal proteasome composition could only be detected in these cell types after optimized fractionation of cross-linked cell extracts. Thus, the developed strategy appears as a potent and sensitive tool to get an insight on the functions of the proteasome under external cell stimuli and in the different cell compartments, in particular in the microsomes and in the nucleus, where the proteasome is less abundant and its extraction more challenging than in the cytosolic compartment.
Supplementary Material
Acknowledgments
We thank Manuelle Ducoux-Petit, Hugo Mananet, and Victor Laurent for their help regarding the immunofluorescence analysis of proteasome.
Footnotes
* This work was supported by grants from the Région Midi-Pyrénées (fellowship to BF), IBiSA (Infrastructures en Biologie Santé et Agronomie), European funds (FEDER), the French Ministery of Research (Investissements d'avenir, Proteomics French Infrastructure), and the Association pour la Recherche sur le Cancer (ARC) (fellowship to BF).
 This article contains supplemental Figs. S1 to S7 and Supplemental Data 1 to 6.
Competing financial interests. The authors declare no competing financial interests.
1 The abbreviations used are:
- UPS
- ubiquitin-proteasome system
- AMC
- 7-amino-4-methylcoumarin
- ChT-like activity
- chymotrypsin-like activity
- CP
- core particle
- DUB
- DeUBiquitinating enzyme
- ERAD
- endoplasmic reticulum associated degradation
- FDR
- false discovery rate
- IFNγ
- interferon gamma
- MFPaQ
- mascot file parsing and quantification
- PAI
- protein abundance index
- NPAI
- normalized PAI
- PIPs
- proteasome interacting proteins
- PolyUb
- polyubiquitin
- PTM
- post-translational modification
- RP
- regulatory particle
- UPR
- unfolded protein response.
REFERENCES
- 1. Wu W. K., Cho C. H., Lee C. W., Wu K., Fan D., Yu J., Sung J. J. (2010) Proteasome inhibition: a new therapeutic strategy to cancer treatment. Cancer Lett. 293, 15–22 [DOI] [PubMed] [Google Scholar]
- 2. Unno M., Mizushima T., Morimoto Y., Tomisugi Y., Tanaka K., Yasuoka N., Tsukihara T. (2002) The structure of the mammalian 20S proteasome at 2.75 A resolution. Structure 10, 609–618 [DOI] [PubMed] [Google Scholar]
- 3. Cascio P., Call M., Petre B. M., Walz T., Goldberg A. L. (2002) Properties of the hybrid form of the 26S proteasome containing both 19S and PA28 complexes. EMBO J. 21, 2636–2645 [DOI] [PMC free article] [PubMed] [Google Scholar]
- 4. Lander G. C., Estrin E., Matyskiela M. E., Bashore C., Nogales E., Martin A. (2012) Complete subunit architecture of the proteasome regulatory particle. Nature 482, 186–191 [DOI] [PMC free article] [PubMed] [Google Scholar]
- 5. Lasker K., Förster F., Bohn S., Walzthoeni T., Villa E., Unverdorben P., Beck F., Aebersold R., Sali A., Baumeister W. (2012) Molecular architecture of the 26S proteasome holocomplex determined by an integrative approach. Proc. Natl. Acad. Sci. U.S.A. 109, 1380–1387 [DOI] [PMC free article] [PubMed] [Google Scholar]
- 6. Lehmann A., Niewienda A., Jechow K., Janek K., Enenkel C. (2010) Ecm29 fulfils quality control functions in proteasome assembly. Mol. Cell. 38, 879–888 [DOI] [PubMed] [Google Scholar]
- 7. Kleijnen M. F., Roelofs J., Park S., Hathaway N. A., Glickman M., King R. W., Finley D. (2007) Stability of the proteasome can be regulated allosterically through engagement of its proteolytic active sites. Nat. Struct. Mol. Biol. 14, 1180–1188 [DOI] [PubMed] [Google Scholar]
- 8. Leggett D. S., Hanna J., Borodovsky A., Crosas B., Schmidt M., Baker R. T., Walz T., Ploegh H., Finley D. (2002) Multiple associated proteins regulate proteasome structure and function. Mol. Cell. 10, 495–507 [DOI] [PubMed] [Google Scholar]
- 9. Bousquet-Dubouch M. P., Uttenweiler-Joseph S., Ducoux-Petit M., Matondo M., Monsarrat B., Burlet-Schiltz O. (2008) Purification and Proteomic Analysis of 20S Proteasomes from Human Cells. Methods Mol. Biol. 432, 301–320 [DOI] [PubMed] [Google Scholar]
- 10. Krüger E., Kloetzel P. M. (2012) Immunoproteasomes at the interface of innate and adaptive immune responses: two faces of one enzyme. Curr. Opin. Immunol. 24, 77–83 [DOI] [PubMed] [Google Scholar]
- 11. Guillaume B., Chapiro J., Stroobant V., Colau D., Van Holle B., Parvizi G., Bousquet-Dubouch M. P., Théate I., Parmentier N., Van den Eynde B. J. (2010) Two abundant proteasome subtypes that uniquely process some antigens presented by HLA class I molecules. Proc. Natl. Acad. Sci. U.S.A. 107, 18599–18604 [DOI] [PMC free article] [PubMed] [Google Scholar]
- 12. Wöjcik C., DeMartino G. N. (2003) Intracellular localization of proteasomes. Int. J. Biochem. Cell. Biol. 35, 579–589 [DOI] [PubMed] [Google Scholar]
- 13. Yan W., Hwang D., Aebersold R. (2008) Quantitative proteomic analysis to profile dynamic changes in the spatial distribution of cellular proteins. Methods Mol. Biol. 432, 389–401 [DOI] [PubMed] [Google Scholar]
- 14. Boisvert F. M., Lam Y. W., Lamont D., Lamont A. I. (2010) A quantitative proteomic analysis of subcellular proteome localization and changes induced by DNA damage. Mol. Cell. Proteomics 9, 457–470 [DOI] [PMC free article] [PubMed] [Google Scholar]
- 15. Sutherland B. W., Toews J., Kast J. (2008) Utility of formaldehyde cross-linking and mass spectrometry in the study of protein-protein interactions. J. Mass Spectrom. 43, 699–715 [DOI] [PubMed] [Google Scholar]
- 16. Guerrero C., Milenkovic T., Przulj N., Kaiser P., Huang L. (2008) Characterization of the proteasome interaction network using a QTAX-based tag-team strategy and protein interaction network analysis. Proc. Natl. Acad. Sci. U.S.A. 105, 13333–13338 [DOI] [PMC free article] [PubMed] [Google Scholar]
- 17. Bousquet-Dubouch M. P., Baudelet E., Guerin F., Matondo M., Uttenweiler-Joseph S., Burlet-Schiltz O., Monsarrat B. (2009) Affinity purification strategy to capture human endogenous proteasome complexes diversity and to identify proteasome-interacting proteins. Mol. Cell. Proteomics 8, 1150–1164 [DOI] [PMC free article] [PubMed] [Google Scholar]
- 18. Gautier V., Mouton-Barbosa E., Bouyssié D., Delcourt N., Beau M., Girard J. P., Cayrol C., Burlet-Schiltz O., Monsarrat B., Gonzalez de Peredo A. (2012) Label-free quantification and shotgun analysis of complex proteomes by 1D SDS-PAGE/nanoLC-MS: evaluation for the large-scale analysis of inflammatory human endothelial cells. Mol. Cell. Proteomics 11, 527–539 [DOI] [PMC free article] [PubMed] [Google Scholar]
- 19. Silva J. C., Gorenstein M. V., Li G. Z., Vissers J. P., Geromanos S. J. (2006) Absolute quantification of proteins by LCMSE: a virtue of parallel MS acquisition. Mol. Cell. Proteomics 5, 144–156 [DOI] [PubMed] [Google Scholar]
- 20. Sakata E., Bohn S., Mihalache O., Kiss P., Beck F., Nagy I., Nickell S., Tanaka K., Saeki Y., Förster F., Baumeister W. (2012) Localization of the proteasomal ubiquitin receptors Rpn10 and Rpn13 by electron cryomicroscopy. Proc. Natl. Acad. Sci. U.S.A. 109, 1479–1484 [DOI] [PMC free article] [PubMed] [Google Scholar]
- 21. Nickell S., Beck F., Scheres S. H., Korinek A., Förster F., Lasker K., Mihalache O., Sun N., Nagy I., Sali A., Plitzko J. M., Carazo J. M., Mann M., Baumeister W. (2009) Insights into the molecular architecture of the 26S proteasome. Proc. Natl. Acad. Sci. U.S.A. 106, 11943–11947 [DOI] [PMC free article] [PubMed] [Google Scholar]
- 22. Liu H., Sadygov R. G., Yates J. R., 3rd (2004) A model for random sampling and estimation of relative protein abundance in shotgun proteomics. Anal. Chem. 76, 4193–4201 [DOI] [PubMed] [Google Scholar]
- 23. Zhang Z., Krutchinsky A., Endicott S., Realini C., Rechsteiner M., Standing K. G. (1999) Proteasome activator 11S REG or PA28: recombinant REG alpha/REG beta hetero-oligomers are heptamers. Biochemistry 38, 5651–5658 [DOI] [PubMed] [Google Scholar]
- 24. Li J., Rechsteiner M. (2001) Molecular dissection of the 11S REG (PA28) proteasome activators. Biochimie 83, 373–383 [DOI] [PubMed] [Google Scholar]
- 25. Bousquet-Dubouch M. P., Fabre B., Monsarrat B., Burlet-Schiltz O. (2011) Proteomics to study the diversity and dynamics of proteasome complexes: from fundamentals to the clinic. Expert Rev. Proteomics 8, 459–481 [DOI] [PubMed] [Google Scholar]
- 26. Adelmant G., Calkins A. S., Garg B. K., Card J. D., Askenazi M., Miron A., Sobhian B., Zhang Y., Nakatani Y., Silver P. A., Iglehart J. D., Marto J. A., Lazaro J. B. (2012) DNA ends alter the molecular composition and localization of Ku multicomponent complexes. Mol. Cell. Proteomics 11, 411–421 [DOI] [PMC free article] [PubMed] [Google Scholar]
- 27. Djabali K., Christiano A. M. (2004) Hairless contains a novel nuclear matrix targeting signal and associates with histone deacetylase 3 in nuclear speckles. Differentiation 72, 410–418 [DOI] [PubMed] [Google Scholar]
- 28. Nickerson J. A., Krockmalnic G., Wan K. M., Penman S. (1997) The nuclear matrix revealed by eluting chromatin from a cross-linked nucleus. Proc. Natl. Acad. Sci. U.S.A. 94, 4446–4450 [DOI] [PMC free article] [PubMed] [Google Scholar]
- 29. Tanahashi N., Murakami Y., Minami Y., Shimbara N., Hendil K. B., Tanaka K. (2000) Hybrid proteasomes. Induction by interferon-gamma and contribution to ATP-dependent proteolysis. J. Biol. Chem. 275, 14336–14345 [DOI] [PubMed] [Google Scholar]
- 30. Shibatani T., Carlson E. J., Larabee F., McCormack A. L., Früh K., Skach W. R. (2006) Global organization and function of mammalian cytosolic proteasome pools: Implications for PA28 and 19S regulatory complexes. Mol. Biol. Cell 17, 4962–4971 [DOI] [PMC free article] [PubMed] [Google Scholar]
- 31. Brooks P., Fuertes G., Murray R. Z., Bose S., Knecht E., Rechsteiner M. C., Hendil K. B., Tanaka K., Dyson J., Rivett J. (2000) Subcellular localization of proteasomes and their regulatory complexes in mammalian cells. Biochem. J. 346, 155–161 [PMC free article] [PubMed] [Google Scholar]
- 32. Klare N., Seeger M., Janek K., Jungblut P. R., Dahlmann B. (2007) Intermediate-type 20 S proteasomes in HeLa cells: “asymmetric” subunit composition, diversity and adaptation. J. Mol. Biol. 373, 1–10 [DOI] [PubMed] [Google Scholar]
- 33. Matondo M., Bousquet-Dubouch M. P., Gallay N., Uttenweiler-Joseph S., Recher C., Payrastre B., Manenti S., Monsarrat B., Burlet-Schiltz O. (2010) Proteasome inhibitor-induced apoptosis in acute myeloid leukemia: A correlation with the proteasome status. Leuk. Res. 34, 498–506 [DOI] [PubMed] [Google Scholar]
- 34. De M., Jayarapu K., Elenich L., Monaco J. J., Colbert R. A., Griffin T. A. (2003) Beta 2 subunit propeptides influence cooperative proteasome assembly. J. Biol. Chem. 278, 6153–6159 [DOI] [PubMed] [Google Scholar]
- 35. McCutchen-Maloney S. L., Matsuda K., Shimbara N., Binns D. D., Tanaka K., Slaughter C. A., DeMartino G. N. (2000) cDNA cloning, expression, and functional characterization of PI31, a proline-rich inhibitor of the proteasome. J. Biol. Chem. 275, 18557–18565 [DOI] [PubMed] [Google Scholar]
- 36. Baugh J. M., Viktorova E. G., Pilipenko E. V. (2009) Proteasomes can degrade a significant proportion of cellular proteins independent of ubiquitination. J. Mol. Biol. 386, 814–827 [DOI] [PMC free article] [PubMed] [Google Scholar]
- 37. Mayor T., Graumann J., Bryan J., MacCoss M. J., Deshaies R. J. (2007) Quantitative profiling of ubiquitylated proteins reveals proteasome substrates and the substrate repertoire influenced by the Rpn10 receptor pathway. Mol. Cell. Proteomics 6, 1885–1895 [DOI] [PubMed] [Google Scholar]
- 38. Mazumdar T., Gorgun F. M., Sha Y., Tyryshkin A., Zeng S., Hartmann-Petersen R., Jørgensen J. P., Hendil K. B., Eissa N. T. (2010) Regulation of NF-kappaB activity and inducible nitric oxide synthase by regulatory particle non-ATPase subunit 13 (Rpn13). Proc. Natl. Acad. Sci. U.S.A. 107, 13854–13859 [DOI] [PMC free article] [PubMed] [Google Scholar]
- 39. Wang X., Huang L. (2008) Identifying dynamic interactors of protein complexes by quantitative mass spectrometry. Mol. Cell. Proteomics 7, 46–57 [DOI] [PubMed] [Google Scholar]
- 40. da Fonseca P. C., He J., Morris E. P. (2012) Molecular Model of the Human 26S Proteasome. Mol. Cell 46, 54–66 [DOI] [PubMed] [Google Scholar]
- 41. Gorbea C., Pratt G., Ustrell V., Bell R., Sahasrabudhe S., Hughes R. E., Rechsteiner M. (2010) A protein interaction network for Ecm29 links the 26 S proteasome to molecular motors and endosomal components. J. Biol. Chem. 285, 31616–31633 [DOI] [PMC free article] [PubMed] [Google Scholar]
- 42. Wang X., Yen J., Kaiser P., Huang L. (2010) Regulation of the 26S proteasome complex during oxidative stress. Sci. Signal. 3, ra88. [DOI] [PMC free article] [PubMed] [Google Scholar]
- 43. Seifert U., Bialy L. P., Ebstein F., Bech-Otschir D., Voigt A., Schröter F., Prozorovski T., Lange N., Steffen J., Rieger M., Kuckelkorn U., Aktas O., Kloetzel P. M., Krüger E. (2010) Immunoproteasomes preserve protein homeostasis upon interferon-induced oxidative stress. Cell 142, 613–624 [DOI] [PubMed] [Google Scholar]
- 44. Enenkel C., Lehmann A., Kloetzel P. M. (1998) Subcellular distribution of proteasomes implicates a major location of protein degradation in the nuclear envelope-ER network in yeast. EMBO J. 17, 6144–6154 [DOI] [PMC free article] [PubMed] [Google Scholar]
- 45. Kim R., Emi M., Tanabe K., Murakami S. (2006) Role of the unfolded protein response in cell death. Apoptosis 11, 5–13 [DOI] [PubMed] [Google Scholar]
- 46. Buchberger A., Bukau B., Sommer T. (2010) Protein quality control in the cytosol and the endoplasmic reticulum: brothers in arms. Mol. Cell 40, 238–252 [DOI] [PubMed] [Google Scholar]
- 47. Dai R. M., Li C. C. (2001) Valosin-containing protein is a multi-ubiquitin chain-targeting factor required in ubiquitin-proteasome degradation. Nat. Cell Biol. 3, 740–744 [DOI] [PubMed] [Google Scholar]
Associated Data
This section collects any data citations, data availability statements, or supplementary materials included in this article.