

Abstract
Metabolomics is a powerful new technology that allows the assessment of global low-molecular-weight metabolites in a biological system and which shows great potential in biomarker discovery. Analysis of the key metabolites in body fluids has become an important part of improving the diagnosis, prognosis, and therapy of diseases. Hepatitis C virus (HCV) is a major leading cause of liver disease worldwide and a serious burden on public health. However, the lack of a small-animal model has hampered the analysis of HCV pathogenesis. We hypothesize that an animal model (Tupaia belangeri chinensis) of HCV would produce a unique characterization of metabolic phenotypes. Ultra-performance liquid-chromatography/electrospray ionization-SYNAPT-high-definition mass spectrometry (UPLC/ESI-SYNAPT-HDMS) coupled with pattern recognition methods and system analysis was carried out to obtain comprehensive metabolomics profiling and pathways of large biological data sets. Taurine, hypotaurine, ether lipid, glycerophospholipid, arachidonic acid, tryptophan, and primary bile acid metabolism pathways were acutely perturbed, and 38 differential metabolites were identified. More important, five metabolite markers were selected via the “significance analysis for microarrays” method as the most discriminant and interesting biomarkers that were effective for the diagnosis of HCV. Network construction has led to the integration of metabolites associated with the multiple perturbation pathways. Integrated network analysis of the key metabolites yields highly related signaling pathways associated with the differentially expressed proteins, which suggests that the creation of new treatment paradigms targeting and activating these networks in their entirety, rather than single proteins, might be necessary for controlling and treating HCV efficiently.
Human hepatitis C virus (HCV)1 is a major pathogen that causes acute and chronic hepatitis, liver cirrhosis, and hepatocellular carcinoma (1). An estimated total of 170 million individuals worldwide are believed to be infected with HCV and at risk of developing cirrhosis and hepatocellular carcinoma (2). Recently, a growing amount of evidence has shown that HCV-infection-induced alterations accumulate (3, 4). Although detailed analysis of the viral genetic organization has led to the identification of various elements, the study of HCV infection has been hampered by the inability to propagate the virus efficiently and the limited animal model of the virus. Fortunately, the tree shrew, Tupaia belangeri chinensis, a species closely related to primates, has been shown to be susceptible to a variety of human HCV (5). It has been reported that tree shrews can be infected with HCV (6–8).
Deciphering the ways in which HCV can disrupt metabolic pathways for viral replication represents an important area for future therapeutic intervention. However, comprehensive metabolomics studies have not yet been reported. In recent years, there has been increasing interest in metabolomics technology, which offers the capability of associating changes in the global profile of low-molecular-weight metabolites (<1 kDa) in biofluids (9). The metabolome can directly influence the phenotype, more than transcripts or proteins, and thus metabolomic analyses could offer a distinct advantage when trying to decipher disease pathogenesis. Metabolomics attempts to capture global changes and overall physiological status in biochemical networks and pathways in order to elucidate sites of perturbations, and it has shown great promise as a means to identify biomarkers of disease (10–13). It enables the parallel assessment of a broad range of endogenous metabolites and has a great impact in the investigation of physiological status, the discovery of biomarkers, disease diagnosis, and the identification of perturbed pathways due to disease or treatment (14, 15). Traditional markers of conventional clinical chemistry and histopathology methods are not region specific and increase significantly only after substantial disease injury. Therefore, more sensitive markers of disease are needed. Metabolomics has become a promising player in the disease arena, and its benefits have been demonstrated in diverse clinical areas (16–18).
Aiming to gain better insight into HCV metabolism and identify biomarkers with potential diagnostic values for predicting HCV, we have developed a method based on metabolic networks to identify potential targets that might become an effective strategy for the discovery of new drugs for HCV. Metabolite data were analyzed to detect the enriched clusters, determine the perturbation pathways, and infer the biological processes. The specific and unique biochemical pathways can be identified when the approach is coupled with multivariate data analysis techniques and a machine learning algorithm. Thus, the present study was meant to identify the low-molecular-weight metabolites and pathways of HCV infection in tree shrews via the use of multivariate statistical data reduction tools.
EXPERIMENTAL PROCEDURES
Chemicals and Reagents
Acetonitrile and methanol (HPLC grade) were purchased from Merck (Darmstadt, Germany) and TEDIA (Tedia Company Inc, Ohio, USA), respectively. Distilled water was produced using a Milli-Q Ultra-pure water system (Millipore, Billerica, MA). Formic acid of HPLC grade was obtained from Honeywell Company (Morristown, NJ). Leucine enkephalin was purchased from Sigma-Aldrich (St. Louis, MO). All other reagents were of analytical grade.
Animals
Adult male tree shrews (T. belangeri chinensis, n = 14) were supplied by Zhongkaitao Biotechnology Co., Ltd. (Guangzhou, China). Animals were housed individually in air-conditioned facilities. The room temperature was regulated at 25 °C ± 1 °C with 50% ± 5% humidity. A 12-h light/dark cycle was set, and all animals had free access to standard diet and water. All animals were allowed to acclimatize in metabolism cages for 1 week prior to treatment. The studies were approved by the Animal Experimental Ethical Committee of Heilongjiang University of Chinese Medicine. All efforts were made to ameliorate the suffering of the animals.
Animal Experiments
Animals were divided into two groups, namely, the control group (n = 5) and the model group (n = 9). All animals were supplied with a standard laboratory diet and water ad libitum. The generation of HCV has been described previously (for details, see Ref. 19). Blood was collected from the hepatic portal vein, and serum was separated via centrifugation at 4500 rpm for 5 min at 4 °C, flash frozen in liquid nitrogen, and stored at −80 °C until metabolic experiment use. Proteins were precipitated from the defrosted serum samples (100 μl) via the addition of four volumes of methanol in 1.5-ml microtubes at room temperature. After brief vortex mixing, the samples were kept at 4 °C for 5 min. Supernatants were collected after centrifugation at 13,000 rpm for 15 min and transferred to vials for Ultra-performance liquid-chromatography (UPLC)/MS analysis.
Metabolic Profiling and Metabolite Analysis
Chromatography was performed on a 2.1 mm inner diameter × 100 mm ACQUITY 1.8 μm HSS T3 column (Waters Corp., Milford, MA) using an ACQUITY UPLCTM system (Waters Corp., Milford, MA). A “purge-wash-purge” cycle was employed on the auto-sampler, with 90% aqueous formic acid used for the wash solvent and 0.1% aqueous formic acid used as the purge solvent; this ensured that the carry-over between injections was minimized. The column was maintained at 45 °C, and subsequently a gradient of 0.1% formic acid in acetonitrile (solvent A) and 0.1% formic acid in water (solvent B) was used as follows: a linear gradient of 5%–50% A over 0–2.0 min, 50%–55% A over 2.0–3.0 min, 55%–70% A over 3.0–4.0 min, 70%–80% A over 3.0–7.0 min, and 80%–99% A over 7.0–10.0 min. The flow rate was 0.40 ml/min, and a 5-μl aliquot of each sample was injected onto the column. The eluent was introduced to the mass spectrometry directly (i.e. without a split). Quality control samples were used to minimize the analytical variation, evaluate the compound stability, and monitor the sample preparation process. After every 10 sample injections, a pooled sample followed by a blank were injected in order to ensure consistent performance of the system.
The eluent was introduced into the synapt high-definition mass spectrometer (Waters Corp., Milford, MA) analysis, and the optimal conditions were as follows: desolvation temperature of 350 °C, source temperature of 110 °C, sample cone voltage of 30 V, extraction cone voltage of 3.5 V, collision energy of 4 eV, microchannel plate voltage of 2400 V, cone gas flow of 50 l/h, desolvation gas flow of 600 l/h, and capillary voltage of 3.2 kV for positive ion mode and 2.8 kV for negative ion mode. Centroid data were acquired in the range of m/z 50–1000 using an accumulation time of 0.2 s per spectrum. For accurate mass acquisition, a lock-mass of leucine enkephalin at a concentration of 0.2 ng/ml was used via a lock spray interface at a flow rate of 100 μl · min−1 monitoring for positive ion mode ([M + H]+ = 556.2771) and negative ion mode ([M − H]− = 554.2615) to ensure accuracy during the MS analysis.
The MassFragment™ application manager was used to facilitate the MS/MS fragment ion analysis process by way of chemically intelligent peak-matching algorithms. The identities of the specific metabolites were confirmed via comparison of their mass spectra and chromatographic retention times with those obtained using commercially available reference standards. This information was then submitted for database searching, either in-house or using the online ChemSpider database and MassBank data source.
Multivariate Data Analysis
Centroided and integrated raw mass spectrometric data were processed using MassLynx V4.1 and MarkerLynx software (Waters Corp., Milford, MA). The intensity of each ion was normalized with respect to the total ion count to generate a data matrix that consisted of the retention time, m/z value, and normalized peak area. The multivariate data matrix was analyzed using EZinfo software (Waters Corp., Milford, MA). The unsupervised segregation was checked via principal components analysis (PCA) using pareto-scaled data. PCA data were visualized by plotting the PCA scores such that each point in the score plot represented an individual sample and plotting the PCA loadings such that each point represented one mass/retention time pair. From the loading plots of orthogonal partial least-squares to latent structures discriminant analysis (OPLS-DA), various metabolites could be identified as responsible for the separation between control and model groups, and these were therefore viewed as potential biomarkers. Potential markers of interest were extracted from S-plots constructed following OPLS-DA, and markers were chosen based on their contribution to the variation and correlation within the data set. With the completion of the OPLS-DA, we were able to try computational systems analysis with MetaboAnalyst data annotation approach including a correlation analysis plot of the differential metabolites, VIP projection, and heatmap visualization.
Construction and Analysis of Metabolic Pathway
The construction, interaction, and pathway analysis of potential biomarkers was performed with MetPA based on database sources, including the Kyoto Encyclopedia of Genes and Genomes (http://www.genome.jp/kegg/) and the Human Metabolome Database (http://www.hmdb.ca/), to identify the affected metabolic pathway analysis and visualization. The possible biological roles were evaluated via enrichment analysis using MetaboAnalyst. Subsequently, signaling networks potentially involved in HCV-infected tree shrews were compared and merged using IPA software. In the process of IPA analysis, each network was assigned a P-score (P-score = −log10 (P-value)) reflecting the probability of the network's being generated at random; the p value was calculated as Fisher's exact test.
Statistical Analyses
SPSS 13.0 for Windows was used for the statistical analysis. The data were analyzed using the Wilcoxon Mann–Whitney Test, with p < 0.05 set as the level of statistical significance. A MetaboAnalyst data annotation approach was used for the hierarchical clustering analysis and significance analysis for microarrays (SAM). The SAM method, a well-established statistical method for metabolites, was used to select the most discriminant and interesting biomarkers.
RESULTS
Metabolomic Profling
For UPLC-MS analysis, aliquots were separated using a Waters Acquity UPLC (Waters, Millford, MA) and analyzed using a Q-TOF/MS that consisted of an electrospray ionization source and a linear ion-trap mass analyzer. The UPLC-MS representative Basic Peak Intensity (BPI) profiles of consecutively injected samples of the same aliquot showed stable retention time with no drift in all of the peaks. The stable Basic Peak Intensity (BPI) profiles reflected the stability of UPLC-high-definition mass spectrometry (HDMS) analysis and the reliability of the metabolomic data. Low-molecular-mass metabolites could be separated well in the short time of 10 min because of the minor particles (less than 1.7 μm) of UPLC.
Pattern Recognition Analysis
Multivariate projection approaches such as PCA and OPLS-DA often can be used, because of their ability to cope with highly multivariate, noisy, collinear, and possibly incomplete data. With OPLS-DA, the identification of discriminatory variables proceeds from an analysis of the OPLS weights. The PCA score plots showed that the metabolic profiles of the control and model groups significantly changed as a result of HCV infection (Figs. 1A and 2A). Trajectory analysis of the serum samples in the three-dimensional score plots corresponded to Fig. 1B in positive mode and Fig. 2B in negative mode. With regard to information analysis of PCA, the control and HCV-infected groups were significantly divided into two clusters, indicating that an HCV model was successfully reproduced. The ions that showed significant differences in abundance between the control and treated animals were contributed to the observed separation and selected from the respective S-plots and VIP-plots as potential markers in positive and negative modes (Figs. 1C, 1D, 2C, and 2D). Overall, 9237 retention-time-exact mass pairs were determined in metabolomic profiling of serum samples. The VIP-value threshold cutoff of the metabolites was set at 2.0; above this threshold, metabolites were filtered out as potential biomarkers. Finally, the number of markers making a significant contribution was 25 in positive mode and 13 in negative mode (Table I). Thirty-two differential metabolites were identified and verified via reference standards. Acquired data were subjected to computational systems analysis with MetaboAnalyst's data annotation tools in order to further investigate the HCV-infected metabolite profiles. The correlation analysis plot of the differential metabolites (Fig. 3A) and the heatmap visualization (Fig. 3B) for the HCV showed distinct segregation. These models were capable of distinguishing HCV-infected animals by adjusting multiple metabolic pathways from healthy subjects. The heatmap was constructed based on the potential candidates of importance, implemented in MetaboAnalyst, which is commonly used for unsupervised clustering. From the plots, various metabolites could be identified as responsible for the separation between control and model groups, and these were therefore viewed as potential biomarkers.
Fig. 1.
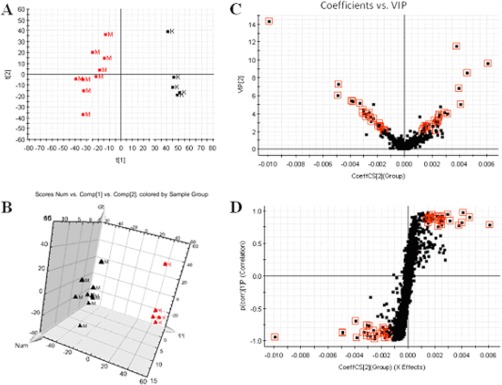
A, PCA model results for control and model groups in positive mode. B, trajectory analysis of PCA score plots (three-dimensional) for the serum samples in positive model. C, VIP-plot of OPLS-DA of samples in positive mode. D, S-plot of OPLS-DA of serum samples in positive mode. M, model group; K, control group.
Fig. 2.
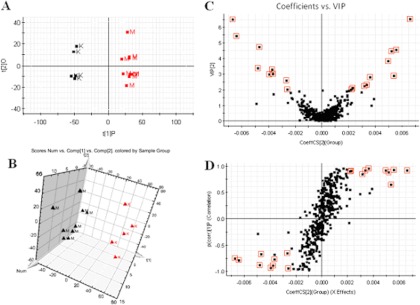
A, PCA model results for control and model groups in negative mode. B, trajectory analysis of PCA score plots (three-dimensional) for the serum samples in negative mode. C, VIP-plot of OPLS-DA of samples in negative mode. D, S-plot of OPLS-DA of serum samples in negative mode. M, model group; K, control group.
Table I. Potential biomarkers identified in HCV-infected tree shrews in positive and negative mode.
| Number | Rate (min) | m/z, determined | m/z, calculated | Error (ppm) | Ion form | Molecular formula | Metabolite name | VIP value | Trend | p value |
|---|---|---|---|---|---|---|---|---|---|---|
| 1 | 4.65 | 520.3392 | 520.3403 | −2.1 | [M+H]+ | C26H50NO7P | LysoPC(18:2(9Z,12Z)/0:0) | 14.3 | ↓ | 0.00 |
| 2 | 4.52 | 520.3390 | 520.3403 | −2.5 | [M+H]+ | C26H50NO7P | LysoPC(0:0/18:2(9Z,12Z)) | 7.3 | ↓ | 0.00 |
| 3 | 4.93 | 991.6738 | 991.6728 | 1.0 | [2 m+H]+ | C24H50NO7P | LysoPC(0:0/16:0) | 11.5 | ↑ | 0.00 |
| 4 | 4.76 | 496.3409 | 496.3403 | 1.2 | [M+H]+ | C24H50NO7P | LysoPC(16:0/0:0) | 8.5 | ↑ | 0.00 |
| 5 | 6.02 | 524.3699 | 524.3716 | −3.2 | [M+H]+ | C26H54NO7P | LysoPC(18:0/0:0) | 9.6 | ↑ | 0.00 |
| 6 | 5.77 | 524.3732 | 524.3716 | 3.1 | [M+H]+ | C26H54NO7P | LysoPC(0:0/18:0) | 6.8 | ↑ | 0.01 |
| 7 | 1.41 | 188.0713 | 118.0712 | 0.5 | [M+H]+ | C11H9NO2 | Indoleacrylic acid | 5.1 | ↓ | 0.01 |
| 8 | 2.15 | 286.2013 | 286.2018 | −1.7 | [M+H]+ | C15H27NO4 | 2-octenoylcarnitine | 5.0 | ↑ | 0.01 |
| 9 | 2.35 | 300.2160 | 300.2175 | −5.0 | [M+H]+ | C16H29NO4 | 2-nonenoylcarnitine | 4.1 | ↑ | 0.01 |
| 10 | 1.94 | 270.0788 | 270.0800 | −4.4 | [M+H]+ | C12H15NO4S | Unknown | 5.4 | ↓ | 0.01 |
| 11 | 5.44 | 508.3661 | 508.3672 | −2.2 | [M+H]+ | C26H54NO6P | LysoPC(P-18:0) | 3.9 | ↑ | 0.01 |
| 12 | 4.88 | 454.2926 | 454.2934 | −1.8 | [M+H]+ | C21H44NO7P | LysoPE(16:0) | 3.9 | ↑ | 0.01 |
| 13 | 5.96 | 482.3231 | 482.3247 | −3.4 | [M+H]+ | C23H48NO7P | LysoPE(18:0) | 3.7 | ↑ | 0.01 |
| 14 | 4.63 | 568.3416 | 568.3403 | 2.2 | [M+H]+ | C30H50NO7P | LysoPC(22:6(4Z,7Z,10Z,13Z,16Z,19Z)) | 3.6 | ↑ | 0.01 |
| 15 | 4.24 | 518.3245 | 518.3247 | −0.4 | [M+H]+ | C26H48NO7P | LysoPC(18:3(9Z,12Z,15Z)) | 3.4 | ↓ | 0.02 |
| 16 | 2.55 | 314.2337 | 314.2331 | 1.9 | [M+H]+ | C17H31NO4 | 9-decenoylcarnitine | 3.0 | ↑ | 0.02 |
| 17 | 2.39 | 312.2161 | 312.2175 | −4.5 | [M+H]+ | C17H29NO4 | 2-trans,4-cis-decadienoylcarnitine | 2.9 | ↑ | 0.02 |
| 18 | 4.61 | 478.2950 | 478.2934 | 3.3 | [M+H]+ | C23H44NO7P | LysoPE(18:2(9Z,12Z)) | 2.6 | ↓ | 0.02 |
| 19 | 3.60 | 358.2963 | 358.2957 | 1.7 | [M+H]+ | C20H39NO4 | Unknown | 2.6 | ↑ | 0.02 |
| 20 | 5.71 | 482.3248 | 482.3247 | 0.2 | [M+H]+ | C23H48NO7P | LysoPE(18:0) | 2.5 | ↑ | 0.02 |
| 21 | 6.42 | 510.3928 | 510.3924 | 0.8 | [M+H]+ | C26H56NO6P | LysoPC(O-18:0) | 2.5 | ↑ | 0.03 |
| 22 | 2.94 | 464.2811 | 464.2801 | 2.2 | [M+H]+ | C29H37NO4 | Unknown | 6.0 | ↓ | 0.03 |
| 23 | 2.28 | 464.2802 | 464.2801 | 0.2 | [M+H]+ | C29H37NO4 | Unknown | 4.2 | ↓ | 0.03 |
| 24 | 4.13 | 468.3113 | 468.3090 | 4.9 | [M+H]+ | C22H46NO7P | LysoPC(14:0) | 2.1 | ↑ | 0.04 |
| 25 | 2.30 | 288.2174 | 288.2175 | −0.3 | [M+H]+ | C15H29NO4 | l-octanoylcarnitine | 2.1 | ↑ | 0.04 |
| 26 | 2.24 | 245.0493 | 245.0484 | 3.7 | [M−H]− | C10H14O5S | Unknown | 6.5 | ↑ | 0.00 |
| 27 | 7.60 | 327.2339 | 327.2324 | 4.6 | [M−H]− | C22H32O2 | Docosahexanoic acid | 2.8 | ↑ | 0.00 |
| 28 | 4.87 | 452.2791 | 452.2777 | 3.1 | [M−H]− | C21H44NO7P | LysoPE(16:0) | 4.5 | ↑ | 0.00 |
| 29 | 7.82 | 303.2310 | 303.2324 | −4.6 | [M−H]− | C20H32O2 | Arachidonic acid | 3.8 | ↑ | 0.01 |
| 30 | 6.00 | 568.3594 | 568.3614 | −3.5 | [M−HCOO]− | C26H54NO7P | LysoPC(18:0) | 2.9 | ↑ | 0.01 |
| 31 | 5.44 | 552.3693 | 552.3670 | 4.2 | [M−HCOO]− | C26H54NO6P | LysoPC(P-18:0) | 2.1 | ↑ | 0.01 |
| 32 | 5.93 | 480.3078 | 480.3090 | −2.5 | [M−H]− | C23H48NO7P | LysoPE(18:0) | 4.5 | ↑ | 0.02 |
| 33 | 4.13 | 512.2972 | 512.2993 | −3.1 | [M−HCOO]− | C22H46NO7P | LysoPC(14:0) | 2.2 | ↑ | 0.02 |
| 34 | 2.28 | 674.3250 | 674.3210 | 5.9 | [M−H]− | C32H53NO12PS | Taurodeoxycholic acid glucuronide | 4.7 | ↓ | 0.02 |
| 35 | 2.94 | 498.2899 | 498.2889 | 2.0 | [M−H]− | C26H45NO6S | Taurodeoxycholic acid | 6.5 | ↓ | 0.02 |
| 36 | 3.09 | 498.2917 | 498.2889 | 5.6 | [M−H]− | C26H45NO6S | Tauroursodeoxycholic acid | 3.0 | ↓ | 0.02 |
| 37 | 2.55 | 514.2844 | 514.2839 | 1.0 | [M−H]− | C26H45NO7S | Taurocholic acid | 5.4 | ↓ | 0.03 |
| 38 | 1.95 | 268.0636 | 268.0644 | −3.0 | [M−H]− | C12H15NO4S | Unknown | 3.3 | ↓ | 0.03 |
Fig. 3.

Computational systems analysis with MetaboAnalyst's data annotation tools. A, correlation analysis plot of the differential metabolites. B, heatmap visualization for the HCV-infected tree shrews. The heatmaps were constructed based on the potential candidates of importance and implemented in MetaboAnalyst, and they are commonly used for unsupervised clustering. Rows: samples; columns: metabolites.
Identification and Selection of Important Differential Metabolites
The robust UPLC-HDMS analysis platform provides the retention time, precise molecular mass, and MS/MS data for the structural identification of biomarkers. The molecular mass was determined within measurement errors via Q-TOF, and the potential elemental composition, degree of unsaturation, and fractional isotope abundance of compounds were also obtained. The presumed molecular formula was searched in Chemspider, the Human Metabolome Database, and other databases in order to identify the possible chemical constitutions, and MS/MS data were screened to determine the potential structures of the ions. According to the protocol detailed above, 38 endogenous metabolites contributing to the separation of the model group and the control group were detected in the samples (Table I). Monitoring changes in these metabolites might aid predictions of the development of HCV. Therefore, these metabolites were selected as candidate markers for further validation. The SAM method was used to select the most discriminant and interesting biomarkers. The results indicated that lysoPC(0:0/16:0), 2-octenoylcarnitine, lysoPE(16:0), arachidonic acid, and taurocholic acid were the most significant differential metabolites for the classification of the HCV model and the controls (Fig. 4).
Fig. 4.

Selection of the most significant metabolites. The significance analysis for microarrays (SAM) method used to select five metabolite markers.
Metabolic Pathway and Function Analysis
More detailed analyses of pathways and networks influenced by HCV infection were performed using MetPA, which is a free web-based tool that combines results from powerful pathway enrichment analysis with the topology analysis. Metabolic pathway analysis with MetPA revealed that metabolites that were identified together were important for the host response to HCV and were responsible for taurine and hypotaurine metabolism, ether lipid metabolism, glycerophospholipid metabolism, primary bile acid, arachidonic acid metabolism, and tryptophan metabolism (supplemental Fig. S1 and supplemental Table S1). Potential biomarkers were also identified from these relevant pathways. Some significantly changed metabolites have been found and used to explain the arachidonic acid metabolism. The detailed construction of the arachidonic acid metabolism pathways with higher scores is shown in Fig. 5. These results suggest that these pathways show marked perturbations over the entire time-course of HCV and could contribute to the development of HCV.
Fig. 5.

Construction of the arachidonic acid metabolism pathways in HCV-infected tree shrews. The map was generated using the reference map by KEGG. The green boxes represent enzymatic activities with putative cases of analogy in HCV-infected tree shrews.
Signaling Networks Associated with the Differentially Expressed Metabolites
In order to reveal signal transduction pathways and/or signaling networks associated with the differentially expressed metabolites in HCV-infected tree shrews, the identified metabolites were imported into the IPA software. According to the IPA knowledge base, major signaling networks, comprising 36 nodes, were associated with this set of proteins (Fig. 6). The integrated network included differentially expressed metabolites and transport-associated major signaling pathways.
Fig. 6.
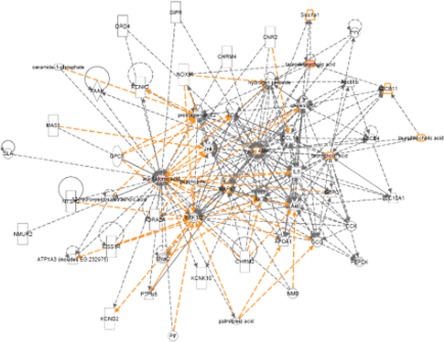
Merged network combining major signaling networks associated with the differentially expressed metabolites in HCV-infected tree shrews identified via ingenuity pathway analysis.
DISCUSSION
HCV infection is a public health problem in both developed and developing countries. Persistent HCV infection, which develops in at least 70% to 80% of infected patients, is strongly correlated with the development of liver diseases (20). Thus, understanding the mechanisms by which HCV induces serious liver diseases is one of the most important global public health issues. Since the discovery of HCV in 1989, one major difficulty—the development of a primate small-animal model—has hampered basic research on HCV. The tree shrew, a small primate mammal indigenous to certain areas of Southeast Asia, is susceptible to infection with a wide range of human pathogenic viruses and appears to be permissive for HCV infection (21). The tree shrew has emerged as the current “gold standard” of small-animal models of HCV infection. However, metabolomics analyses evaluating the pathology development of HCV-infected tree shrews have yet to be undertaken. It is important to note that the progress in metabolomics technology has provided sensitive, fast, and robust tools for analyzing biomarkers in HCV. This study was therefore designed to further elucidate the underlying mechanism of HCV from the metabolic pathways in a global view.
In this study, an animal model of HCV infection was successfully reproduced, and dynamic metabolic profiles were also investigated via UPLC-HDMS combined with multivariate statistical analysis. Interestingly, we have identified 38 specific metabolites relevant for HCV. Six unique metabolic pathways were also indicated to be differentially affected in HCV-infected tree shrews. Of note, we found that HCV infection activated an array of factors involved in taurine and hypotaurine metabolism, ether lipid metabolism, glycerophospholipid metabolism, primary bile acid biosynthesis, arachidonic acid metabolism, and tryptophan metabolism pathways. Significantly down-regulated and up-regulated biomarkers were observed in the model group following HCV infection. These metabolites demonstrated that abnormal metabolism occurred in the HCV-infected animals. Metabolic analyses of HCV infection were inferred from changes in the intermediates during substance metabolism. Given the complexity of HCV, it might not be surprising that a combination, rather than a single metabolite, would be required in order to reliably assess the animal models. Disturbances in metabolism were notable features of HCV infection and might be profoundly involved in the pathogenesis of disease. Additionally, in order to more clearly characterize HCV, changes in the relative concentrations of target metabolites were analyzed. We found that the content of these key markers showed clear segregation from the normal group. In order to examine the effect of HCV infection on different metabolic pathways, global metabolomic profiles were compared between HCV-infected and uninfected animals. In total, 38 metabolites were significantly changed; 13 decreased and 25 increased relative to controls. The most discriminant and interesting biomarkers were selected via the SAM method. It indicated that lysoPC(0:0/16:0), 2-octenoylcarnitine, lysoPE(16:0), arachidonic acid, and taurocholic acid were the most significant differential metabolites for the classification of the HCV model and the controls (Fig. 4). Based on the findings of this study, it would appear that many different metabolic pathways are disrupted as a result of HCV infection. In the present study, we examined the pathology development of HCV-infected tree shrews in the hope that doing so will help us to understand the basic mechanisms of HCV infection. It appears that the candidate factors in HCV infection animals are a combination of more than one metabolite, that is, a “panel” or profile of biomarkers. We followed up with IPA analysis to ascertain major signaling networks potentially associated with these metabolites. Integrated network analysis of the metabolites differentially expressed in HCV-infected tree shrews' associated signatures yielded highly related signaling networks associated with the proteins and/or genes, which strongly suggests that the involvement of these signaling networks could be essential for the development of HCV.
The application of animal models has been of immense value in defining and understanding human disease. The discovery of novel biomarkers for animal diseases has the potential to further enhance clinical care. Conventional analyses target a selection of biochemical or molecular biomarkers that are related to, or associated with, a specific disease state. The biomarkers play a key role in defining animal disease; however, some have poor diagnostic specificity and are not pathognomonic for the disease. The causes of many important diseases in animals are complex and multifactorial, and this presents unique challenges. Biomarkers are indicators of biological processes and pathological states that can reveal a variety of health and disease traits (22). They indicate the presence or extent of a biological process that is directly linked to the clinical manifestations and outcome of a particular disease. Identifying biomarkers or biomarker profiles will be an important step toward disease characterization and management. In particular, the rapid advancement of the post-genomic technology of metabolomics has led to the development of strategies aimed at identifying specific and sensitive biomarkers from the thousands of molecules present in biological fluid. Currently, the diagnosis or screening of HCV recurrence mainly depends on endoscopy and pathological examinations; finding biomarkers that predict the risk of HCV will provide the opportunity to institute a preventive lifestyle and permit timely pharmacological treatment. Novel and specific biomarkers could facilitate and improve the development of disease treatments and benefit public health. The precise identification and accurate quantification of metabolites facilitate downstream pathway and network analysis for the discovery of clinically accessible and minimally invasive biomarkers. Metabolomics offers potential advantages that classical diagnostic approaches do not, based on the discovery of a suite of clinically relevant biomarkers that are simultaneously affected by the disease (23).
Metabolomics for the screening of biomarker patterns and the elucidation of biochemical processes during the post-genomic era has increased contemporaneously with progress in global systems biology (24, 25). It has a great effect on investigations of physiological status, disease diagnosis, the discovery of biomarkers, and the identification of perturbed pathways due to disease or treatment (26–28). The application of metabolomic technologies to the study of HCV-infected animals will improve our understanding of the pathophysiological processes involved, and this should help us to identify potential biomarkers in order to develop new therapeutic strategies. Indeed, the analysis and construction of metabolomics feature profiling of HCV infection can provide a unified platform with which to integrate all the biological information on genes, proteins, and metabolites for a comprehensive study of the relationship between metabolism and disease (29). System analysis of metabolic networks that are a central paradigm in biology will help us identify new drug targets, which in turn will generate a more in-depth understanding of the HCV mechanism and thus provide better guidance at the level of global metabolomics. Thus, network-based pathways of special interest are emerging as an important paradigm for the analysis of biological systems. Future metabolomic studies on human HCV will be needed in order to validate the biomarkers found in the animal model.
CONCLUSIONS
Metabolomics, one of the “omic” sciences in systems biology, is the global assessment and validation of endogenous small-molecule metabolites that have an important role in the characterization of diseases within a biologic system. The tree shrew is the only known animal that can be infected with human HCV, and it has become an animal of interest in research related to human HCV. Using tree shrews as a model of HCV infection, we can evaluate HCV infection pathogenesis. Our methodology was designed to consider a wider range of biomarkers than just those associated with HCV infection in tree shrews. By analyzing the topology of the network, we have detected 38 potential biomarkers and predicted the major metabolite network of HCV by using validated pattern recognition methods and computational systems analysis. Combining the results from these methods, we have calculated six high-confidence networks. The identified target metabolites were found to encompass a variety of pathways related to taurine and hypotaurine metabolism, ether lipid metabolism, glycerophospholipid metabolism, primary bile acid biosynthesis, arachidonic acid metabolism, and tryptophan metabolism, and they may be mediated through receptors, neurotransmitters, enzymes, signal transduction, and electron carriers. We have constructed the metabolomic feature profiling and metabolite interaction network of HCV using a pattern recognition approach and ingenuity pathway analysis. In this study, we demonstrate that a new, cost-effective, non-primate, small-animal model for the study of HCV infection allows the functional assessment of HCV. The power of metabolomics to capture and elucidate metabolic characteristics of HCV has been successfully demonstrated in this study. Our study also highlights the importance of metabolomics as a potential tool for uncovering metabolic pathways to assess HCV and enable us to increase research productivity regarding HCV.
Supplementary Material
Footnotes
* This work was supported by grants from the Key Program of Natural Science Foundation of State (Grant No. 30973886 and 90709019), the National Specific Program on the Subject of Public Welfare (Grant No. 200807014), the National Key Subject of Drug Innovation (Grant No. 2009ZX09502–005), and the National Program on Key Basic Research Project of China (Grant No. 2005CB523406).
 This article contains supplemental material.
X.W., A.Z., H.S., G.Y., W.L., and Y.C. designed and performed the experiments and analyzed the raw data. A.Z. wrote the manuscript. X.W., H.S., and G.Y. supervised the project. W.L. and Y.C. collected urine. C.P., C.S., X.W., and X.L. assisted in the metabolomics experiment.
1 The abbreviations used are:
- HCV
- hepatitis C virus
- OPLS-DA
- orthogonal partial least-squares to latent structures discriminant analysis
- PCA
- principal component analysis
- SAM
- significance analysis for microarrays.
REFERENCES
- 1. Fellay J., Thompson A. J., Ge D., Gumbs C. E., Urban T. J., Shianna K. V., Little L. D., Qiu P., Bertelsen A. H., Watson M., Warner A., Muir A. J., Brass C., Albrecht J., Sulkowski M., McHutchison J. G., Goldstein D. B. (2010) ITPA gene variants protect against anaemia in patients treated for chronic hepatitis C. Nature 464, 405–408 [DOI] [PubMed] [Google Scholar]
- 2. Hsu C. S., Hsu S. J., Chen H. C., Tseng T., C., Liu C. H., Niu W. F., Jeng J., Liu C. J., Lai M. Y., Chen P. J., Kao J. H., Chen D. S. (2011) Association of IL28B gene variations with mathematical modeling of viral kinetics in chronic hepatitis C patients with IFN plus ribavirin therapy. Proc. Natl. Acad. Sci. U.S.A. 108, 3719–3724 [DOI] [PMC free article] [PubMed] [Google Scholar]
- 3. Mankouri J., Dallas M. L., Hughes M. E., Griffin S. D., Macdonald A., Peers C., Harris M. (2009) Suppression of a pro-apoptotic K+ channel as a mechanism for hepatitis C virus persistence. Proc. Natl. Acad. Sci. U.S.A. 106, 15903–15908 [DOI] [PMC free article] [PubMed] [Google Scholar]
- 4. Zhang P., Zhong L., Struble E. B., Watanabe H., Kachko A., Mihalik K., Virata-Theimer M. L., Alter H. J., Feinstone S., Major M. (2009) Depletion of interfering antibodies in chronic hepatitis C patients and vaccinated chimpanzees reveals broad cross-genotype neutralizing activity. Proc. Natl. Acad. Sci. U.S.A. 106, 7537–7541 [DOI] [PMC free article] [PubMed] [Google Scholar]
- 5. Amako Y., Tsukiyama-Kohara K., Katsume A., Hirata Y., Sekiguchi S., Tobita Y., Hayashi Y., Hishima T., Funata N., Yonekawa H., Kohara M. (2010) Pathogenesis of hepatitis C virus infection in Tupaia belangeri. J. Virol. 84, 303–311 [DOI] [PMC free article] [PubMed] [Google Scholar]
- 6. Xu X., Chen H., Cao X., Ben K. (2007) Efficient infection of tree shrew (Tupaia belangeri) with hepatitis C virus grown in cell culture or from patient plasma. J. Gen. Virol. 88, 2504–2512 [DOI] [PubMed] [Google Scholar]
- 7. Tong Y., Zhu Y., Xia X., Liu Y., Feng Y., Hua X., Chen Z., Ding H., Gao L., Wang Y., Feitelson M. A., Zhao P., Qi Z. T. (2011) Tupaia CD81, SR-BI, claudin-1, and occludin support hepatitis C virus infection. J. Virol. 85, 2793–2802 [DOI] [PMC free article] [PubMed] [Google Scholar]
- 8. Tian Z. F., Shen H., Fu X. H., Chen Y. C., Blum H. E., Baumert T. F., Zhao X. P. (2009) Interaction of hepatitis C virus envelope glycoprotein E2 with the large extracellular loop of tupaia CD81. World J. Gastroenterol. 15, 240–244 [DOI] [PMC free article] [PubMed] [Google Scholar]
- 9. Cai Z., Zhao J. S., Li J. J., Peng D. N., Wang X. Y., Chen T. L., Qiu Y. P., Chen P. P., Li W. J., Xu L. Y., Li E. M., Tam J. P., Qi R. Z., Jia W., Xie D. (2010) A combined proteomics and metabolomics profiling of gastric cardia cancer reveals characteristic dysregulations in glucose metabolism. Mol. Cell. Proteomics 9, 2617–2628 [DOI] [PMC free article] [PubMed] [Google Scholar]
- 10. Arakaki A. K., Skolnick J., McDonald J. F. (2008) Marker metabolites can be therapeutic targets as well. Nature 456, 443. [DOI] [PubMed] [Google Scholar]
- 11. Stoop M. P., Coulier L., Rosenling T., Shi S., Smolinska A. M., Buydens L., Ampt K., Stingl C., Dane A., Muilwijk B., Luitwieler R. L., Sillevis Smitt P. A., Hintzen R. Q., Bischoff R., Wijmenga S. S., Hankemeier T., van Gool A. J., Luider T. M. (2010) Quantitative proteomics and metabolomics analysis of normal human cerebrospinal fluid samples. Mol. Cell. Proteomics 9, 2063–2075 [DOI] [PMC free article] [PubMed] [Google Scholar]
- 12. Zhang A., Sun H., Han Y., Yuan Y., Wang P., Song G., Yuan X., Zhang M., Xie N., Wang X. (2012) Exploratory urinary metabolic biomarkers and pathways using UPLC-Q-TOF-HDMS coupled with pattern recognition approach. Analyst 137, 4200–4208 [DOI] [PubMed] [Google Scholar]
- 13. Sreekumar A., Poisson L. M., Rajendiran T. M., Khan A. P., Cao Q., Yu J., Laxman B., Mehra R., Lonigro R. J., Li Y., Nyati M. K., Ahsan A., Kalyana-Sundaram S., Han B., Cao X., Byun J., Omenn G. S., Ghosh D., Pennathur S., Alexander D. C., Berger A., Shuster J. R., Wei J. T., Varambally S., Beecher C., Chinnaiyan A. M. (2009) Metabolomic profiles delineate potential role for sarcosine in prostate cancer progression. Nature 457, 910–914 [DOI] [PMC free article] [PubMed] [Google Scholar] [Research Misconduct Found]
- 14. Wang X., Zhang A., Han Y., Wang P., Sun H., Song G., Dong T., Yuan Y., Yuan X., Zhang M., Ning X., Zhang H., Dong H., Dong W. (2012) Urine metabolomics analysis for biomarker discovery and detection of jaundice syndrome in patients with liver disease. Mol. Cell. Proteomics 11, 370–380 [DOI] [PMC free article] [PubMed] [Google Scholar]
- 15. Suhre K., Shin S. Y., Petersen A. K., Mohney R. P., Meredith D., Wägele B., Altmaier E., CARDIoGRAM, Deloukas P., Erdmann J., Grundberg E., Hammond C. J., de Angelis M. H., Kastenmüller G., Köttgen A., Kronenberg F., Mangino M., Meisinger C., Meitinger T., Mewes H. W., Milburn M. V., Prehn C., Raffler J., Ried J. S., Römisch-Margl W., Samani N. J., Small K. S., Wichmann H. E., Zhai G., Illig T., Spector T. D., Adamski J., Soranzo N., Gieger C., Assimes T. L., Deloukas P., Erdmann J., Holm H., Kathiresan S., König I. R., McPherson R., Reilly M. P., Roberts R., Samani N. J., Schunkert H., Stewart A. F. (2011) Human metabolic individuality in biomedical and pharmaceutical research. Nature 477, 54–60 [DOI] [PMC free article] [PubMed] [Google Scholar]
- 16. Zhang A., Sun H., Wang X. (2012) Power of metabolomics in diagnosis and biomarker discovery of hepatocellular carcinoma. Hepatology 10.1002/hep.26130 [DOI] [PubMed] [Google Scholar]
- 17. Wang X., Yang B., Sun H., Zhang A. (2012) Pattern recognition approaches and computational systems tools for ultra performance liquid chromatography-mass spectrometry-based comprehensive metabolomic profiling and pathways analysis of biological data sets. Anal. Chem. 84, 428–439 [DOI] [PubMed] [Google Scholar]
- 18. Wang X., Yang B., Zhang A., Sun H., Yan G. (2012) Potential drug targets on insomnia and intervention effects of Jujuboside A through metabolic pathway analysis as revealed by UPLC/ESI-SYNAPT-HDMS coupled with pattern recognition approach. J. Proteomics 75, 1411–1427 [DOI] [PubMed] [Google Scholar]
- 19. Xie Z. C., Riezu-Boj J. I., Lasarte J. J., Guillen J., Su J. H., Civeira M. P., Prieto J. (1998) Transmission of hepatitis C virus infection to tree shrews. Virology 244, 513–520 [DOI] [PubMed] [Google Scholar]
- 20. Sarasin-Filipowicz M., Oakeley E. J., Duong F. H., Christen V., Terracciano L., Filipowicz W., Heim M. H. (2008) Interferon signaling and treatment outcome in chronic hepatitis C. Proc. Natl. Acad. Sci. U.S.A. 105, 7034–7039 [DOI] [PMC free article] [PubMed] [Google Scholar]
- 21. Scheel T. K., Gottwein J. M., Jensen T. B., Prentoe J. C., Hoegh A. M., Alter H. J., Eugen-Olsen J., Bukh J. (2008) Development of JFH1-based cell culture systems for hepatitis C virus genotype 4a and evidence for cross-genotype neutralization. Proc. Natl. Acad. Sci. U.S.A. 105, 997–1002 [DOI] [PMC free article] [PubMed] [Google Scholar]
- 22. Zhang A., Sun H., Wang X. (2012) Serum metabolomics as a novel diagnostic approach for disease: a systematic review. Anal. Bioanal. Chem. 404, 1239–1245 [DOI] [PubMed] [Google Scholar]
- 23. Wang X., Zhang A., Sun H. (2012) Future perspectives of Chinese medical formulae: chinmedomics as an effector. OMICS 16, 414–421 [DOI] [PMC free article] [PubMed] [Google Scholar]
- 24. Kim K., Aronov P., Zakharkin S. O., Anderson D., Perroud B., Thompson I. M., Weiss R. H. (2009) Urine metabolomics analysis for kidney cancer detection and biomarker discovery. Mol. Cell. Proteomics 8, 558–570 [DOI] [PMC free article] [PubMed] [Google Scholar]
- 25. Zhang A., Sun H., Wang X. (2012) Saliva metabolomics opens door to biomarker discovery, disease diagnosis, and treatment. Appl. Biochem. Biotechnol. 168, 1718–1727 [DOI] [PubMed] [Google Scholar]
- 26. Zhang A., Sun H., Wu X., Wang X. (2012) Urine metabolomics. Clin. Chim. Acta 414C, 65–69 [DOI] [PubMed] [Google Scholar]
- 27. Zhang A., Sun H., Dou S., Sun W., Wu X., Wang P., Wang X. (2013) Metabolomics study on the hepatoprotective effect of scoparone using ultra-performance liquid chromatography/electrospray ionization quadruple time-of-flight mass spectrometry. Analyst 138, 353–361 [DOI] [PubMed] [Google Scholar]
- 28. Pungaliya C., Srinivasan J., Fox B. W., Malik R. U., Ludewig A. H., Sternberg P. W., Schroeder F. C. (2009) A shortcut to identifying small molecule signals that regulate behavior and development in Caenorhabditis elegans. Proc. Natl. Acad. Sci. U.S.A. 106, 7708–7713 [DOI] [PMC free article] [PubMed] [Google Scholar]
- 29. Chen T., Xie G., Wang X., Fan J., Qiu Y., Zheng X., Qi X., Cao Y., Su M., Wang X., Xu L. X., Yen Y., Liu P., Jia W. (2011) Serum and urine metabolite profiling reveals potential biomarkers of human hepatocellular carcinoma. Mol. Cell. Proteomics 10, 110.004945. [DOI] [PMC free article] [PubMed] [Google Scholar]
Associated Data
This section collects any data citations, data availability statements, or supplementary materials included in this article.