

Abstract
Time representation is an important element of cerebellar neural processing, but the mechanisms involved are poorly understood. We demonstrate that the major mossy fibre input system originating from the lateral reticular nucleus (LRN) can represent sensory event timing over hundreds of milliseconds. In vivo, cerebellar-projecting LRN neurons discharge extremely regularly with a clock-like rhythm. In response to stimulation of a wide peripheral receptive field, firing briefly pauses then resumes with precise timing. The precision of post-stimulus spikes and the regularity of firing mean that the stimulus timing is represented by LRN spike timing over hundreds of milliseconds. In an arithmetic progression model of LRN neuron firing, highly predictable post-stimulus spike timing is modulated by changing the variability of the first post-inhibitory spike and of the subsequent interspike intervals. From in vitro analysis we show that the Ca2+-activated small-conductance K+ current (SK) contributes to interspike interval regularity and that the hyperpolarization-activated cation current (Ih) contributes to short-latency, high-precision post-hyperpolarisation spike timing. Consistent with this, we demonstrate in vivo that resumption of firing becomes more sharply timed after longer stimulus-evoked pauses. Thus, Ih is a potential conductance that could mediate the precisely timed resumption of firing after the pause. Through the widespread projections of LRN neurons, these properties may enable the LRN to provide precisely timed signals to the cerebellum over a prolonged period following a stimulus, which may also both activate and sustain oscillatory processes in the cerebellar cortex.
Key points
The lateral reticular nucleus (LRN) sends dense mossy fibre projections to the cerebellum. We report that LRN neurons convey timing signals that, along with measurements of force and distance, are needed for the cerebellum to organise movement.
We show that LRN neurons fire with clock-like regularity but pause their firing in response to peripheral sensory stimuli; regular firing then resumes at a new, ‘reset’ time. Thus, the firing properties of LRN neurons enable them to signal the timing of sensory events to the cerebellum over prolonged periods.
We show a plausible ionic mechanism for these properties of LRN neurons, involving the concerted activity of the hyperpolarisation-activated cation conductance (Ih) and the small-conductance calcium-activated potassium conductance (SK). Notably, Ih shortens the latency and sharpens the precision of post-inhibitory spiking.
Overall, we provide evidence for a potential mechanism of time representation in a neural circuit.
Introduction
Cerebellar output adjusts motor commands to produce purposeful muscular action, using afferent information about force, distance and time. Many behavioural studies invoke a role for the cerebellum in the precise timing of movement (Ivry & Keele, 1989; Ohyama et al. 2003), but how time is represented by the circuitry is not well understood. The cerebellum is believed to generate feed-forward predictions using internal models of the motor apparatus in which time representation must be critical to predict delays and compare motor and sensory (including reafferent) signals (Kawato & Gomi, 1992; Miall et al. 1993; Wolpert et al. 1998; Medina & Mauk, 2000). Despite a wealth of knowledge on structure, connectivity and synaptic properties in cerebellar circuitry, neural encoding of event timing is subject to speculation (Medina & Mauk, 2000; Yamazaki & Tanaka, 2005; Maex & Steuber, 2009). Discussion of mechanisms of timing usually focuses on detection of coincident inputs; the mechanisms underlying independent representation of the timing of single events, such as the recent occurrence of a sensory stimulus, are not well-established. Proposed mechanisms for time representation include oscillations, processes with slow time constants, or delay lines (Medina & Mauk, 2000; Yamazaki & Tanaka, 2005; D’Angelo et al. 2009; Dean et al. 2009; Dugue et al. 2009; Solinas et al. 2010).
Mossy fibre pathways provide the major inputs to the cerebellum and excite granule cells, and hence Purkinje cells, in the cerebellar cortex. Many mossy fibre pathways convey modality and spatially specific signals from proprioceptors and cutaneous mechanoreceptors (Ito, 1984), providing parametric information about movement force and distance. Substantial mossy fibre projections arise from spinoreticulocerebellar pathways, which have poorly defined functions. The principal spinoreticulocerebellar relay is the lateral reticular nucleus (LRN), activation of which can also drive cerebellar granule cells (Bengtsson & Jorntell, 2009) and inhibit cerebellar Golgi cells (Xu & Edgley, 2010). Multimodal afferent inputs from broad peripheral receptive fields as well as from descending motor pathways converge on LRN neurons (Rosen & Scheid, 1973; Marini & Wiesendanger, 1987; Ekerot, 1990a; Wu et al. 1999), which in turn project throughout much of the cerebellar cortex and nuclei (Wu et al. 1999), suggesting a major role in cerebellar function. Here we show that in vivo cerebellar-projecting LRN neurons display tonic clock-like spike firing that pauses following peripheral sensory stimulation then subsequently resumes, but shifted in time, leading to highly reproducible timings of the initial post-stimulus spikes. LRN neurons broadcast widely to the cerebellar cortex, so their discharge following a stimulus could synchronise granule and Golgi cell excitability. This potentially contributes to oscillatory cerebellar activity that can represent timing information over hundreds of milliseconds, the timescale of compound movements (Medina & Mauk, 2000; D’Angelo et al. 2009; Dugue et al. 2009; Solinas et al. 2010).
Methods
All experimental procedures were approved by the UK Animals (Scientific Procedures) Act 1986 and the Local Ethical Committee of the University of Cambridge.
Recordings from LRN neurons in vivo
Experiments were performed on adult Wistar rats (300–350 g). In experiments under anaesthesia a single intraperitoneal dose of urethane was given (1–1.2 g kg−1) which was supplemented with single intraperitoneal doses of a fentanyl–fluanisone mixture (Hypnorm, Vetpharma, UK, 0.015 ml kg−1), as and when required to abolish limb withdrawal reflexes. Extracellular single-unit recordings were made using glass micropipettes filled with 1 m NaCl with impedances ranging from 6 to 15 MΩ. We approached the LRN from the dorsal brainstem, inserting electrodes 1.9 mm lateral to the obex. Signals from the microelectrodes were amplified (gain, ×10,000), filtered (band-pass, 0.3–10 kHz) and digitized at 25 kHz (Micro 1401 interface and Spike 2 software from Cambridge Electronic Design, UK). Cerebellar-projecting LRN neurons were antidromically activated following stimulation of the cerebellar white matter (insulated stainless steel electrodes inserted 2–3 mm into the cerebellum at the midline of lobule VII). In all cases fixed latency spikes were confirmed to be antidromic by collision with spontaneous action potentials.
Peripheral afferents were activated by electrical stimulation through pairs of percutaneous pins inserted into the skin of the vibrissal pads and the paws of the fore- and hindlimbs (Holtzman et al. 2006). One or more biphasic electrical stimuli lasting 0.2 ms set to approximately twice threshold were used for activating local motor axons (between 2 and 10 mA). Recording sites were marked in the initial experiments using juxtacellular deposits of Neurobiotin (Vector, UK; see Fig. 1B): methods for labelling and visualisation are described in Holtzman et al. (2006).
Figure 1. Cerebellar-projecting LRN neurons fire with clock-like regularity.
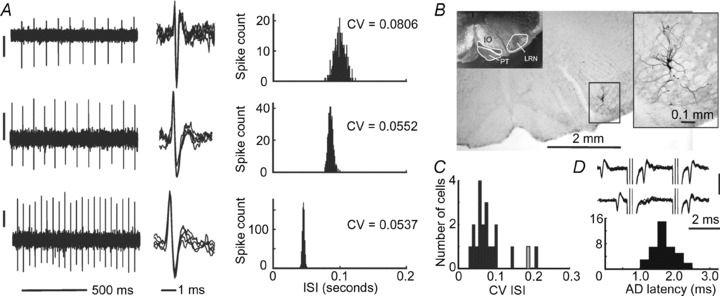
A, example recordings of spontaneous spiking in 3 antidromically identified LRN neurons with their respective spike overlays. Vertical scale bars: 300 μV. Interspike interval distribution histograms on the right show CV values. B, labelled neurons within the LRN. The inset on the left shows the relative positions of the pyramidal tract (PT), the inferior olivary nucleus (IO) and the LRN from a dark field view. C, CVs of spontaneous interspike intervals for 20 LRN neurons from which spontaneous discharges were recorded. The grey bin represents one neuron that periodically fell silent between periods of regular firing; the CV value shown is for the active periods. D, overlay of raw traces showing antidromic activation from a pair of stimuli 3 ms apart (upper traces) and collision between orthodromic and antidromic action potentials when the first stimulus is triggered less than 1 ms after a spontaneous spike (lower traces). Vertical scale bar: 0.2 mV. The histogram shows antidromic spike latencies for the population of LRN neurons (n= 39) consistent with them being fast-conducting mossy fibres.
In six additional experiments rats were decerebrated. In these experiments anaesthesia was induced with Isoflurane (3–5% in oxygen), after which both carotid arteries were ligated, the neuraxis was sectioned between midbrain and forebrain with a spatula and all forebrain structures (cortex, thalamus and hypothalamus) were removed by suction. Subsequently neuromuscular blockade was induced (Pancuronium, 1.5 mg kg−1, i.v.), artificial ventilation was commenced and anaesthesia discontinued. In these experiments recordings were made from antidromically identified LRN neurons using an Eckhorn 7 multi-electrode array system (for details see Holtzman et al. 2006). Other experimental details were as described for the experiments under urethane; peripheral nerve stimulus intensities were set before muscular blockade.
Recordings from LRN neurons in vitro
Rats aged between postnatal days 5 to 16 were killed by decapitation under halothane anaesthesia. Brains were rapidly removed into ice-cold sucrose-based Ringer solution of the following composition (mm): sucrose 206, KCl 2.5, NaH2PO4 1.25, NaHCO3 26, CaCl2 1, MgCl2 5 and d-glucose 25. Coronal brainstem slices (200 μm) containing the medulla were prepared (DTK-1000 microslicer, Dosaka, Japan) and held after cutting in a submersion chamber containing modified Ringer solution of the following composition (mm): NaCl 119, KCl 2.5, NaH2PO4 1.25, NaHCO3 26, CaCl2 2.5, MgCl2 6 and d-glucose 25, saturated with 95% O2 and 5% CO2.
The majority of in vitro recordings (117/140 neurons) were carried out in slices from rats aged 8–16 days postnatal. Slices were transferred to a recording chamber 1–5 h after preparation and continuously perfused at 2–3 ml min−1 with modified Ringer solution (as detailed above but containing 1.3 mm MgCl2 and 10 mm glucose) at 29–31°C, saturated with 95% O2 and 5% CO2. The LRN (Fig. 1B) and individual LRN neurons were visualised using an Olympus BX51W microscope with differential interference contrast optics. Whole-cell patch clamp recordings were made using pipettes of 1–3 MΩ resistance when filled with intracellular solution (mm): potassium gluconate 120, KCl 10, NaCl 2.8, MgCl2 3, Hepes 20, MgATP 2, Na3GTP 0.3 and EGTA 0.6, pH 7.2. Membrane current and voltage were recorded in LRN neurons using a HEKA EPC9 amplifier, low-pass filtered at 3 kHz and digitally sampled to Spike 2 (Version 4) software at 20 kHz using a Micro1401 interface (Cambridge Electronic Design, Cambridge, UK).
The spiking of LRN neurons was recorded in current clamp with zero current injection. In some experiments, hyperpolarising and/or depolarizing current injections were applied. Spontaneous and pulse-evoked firing properties were compared before and after addition of drugs (via the bathing solution). Spiking during an epoch of 30–60s recording in control solution immediately prior to drug addition was compared with spiking during similar epochs after at least 2 min in drug solution. The amplitude of the after-hyperpolarization (AHP) was measured 10 ms after the peak of the average spike waveform (derived from 30s samples of spikes taken before and at least 2 min after addition of drug). The Ih blocker ZD7288 and the SK channel blocker apamin were obtained from Tocris Bioscience.
Data analysis
Analyses of spike discharge from in vivo recordings (peristimulus time histograms and rasters) were performed as described previously (Holtzman et al. 2006). All combined data are shown as mean ± standard error of the mean (SEM). Paired or unpaired t tests as appropriate were used for two groups of normally distributed data; normality was determined using the Lilliefors test. Analysis of variance with post hoc Bonferroni tests was used to compare more than two groups of data.
Arithmetic progression model of spike timing
A simple model of post-stimulus spiking was created to simulate post-stimulus spike timing. In this model, the time at which a given post-stimulus spike occurs equals the time of the first post-stimulus spike with its corresponding jitter (standard deviation) plus all the intervening interspike intervals and their jitter.
The times of the first three spikes are:
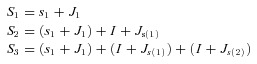 |
Therefore the time of the nth spike is:
 |
where: Sn is the time of the nth post-stimulus spike, s1 is the mean latency of the first post-stimulus spike, J1 is the jitter of the first post-stimulus spike, I is the mean spontaneous interspike interval, Js is the jitter of spontaneous interspike intervals and jitter (Js and J1) can have positive or negative values.
From the functions above it can be seen that the random jitter inherent in each post-stimulus interspike interval accumulates linearly with increasing numbers of post-stimulus spikes. For each iterative increase of n, the random variables J1 and Js were drawn randomly from zero-mean Gaussian distributions, which is valid as the real values of both spontaneous interspike intervals and first post-stimulus spike latencies measured from real LRN neurons in vitro approximate to a Gaussian distribution. For each simulation, 100 trials were generated to produce rasters and peristimulus time histograms (PSTHs). The model was tested by comparing real and simulated post-stimulus inter-trail spike time variance.
Results
Cerebellar-projecting LRN neurons fire with clock-like regularity in vivo
We report extracellular recordings from 39 antidromically identified LRN neurons in vivo under urethane anaesthesia. Examples of labelled LRN neurons are shown in Fig. 1B and population firing parameters are summarized in Table 1. All of the antidromically activated neurons discharged spikes in the absence of overt sensory stimulation. The mean spontaneous firing rate recorded was 14.7 ± 0.96 Hz (range 7.9–22 Hz; n= 20). Spike firing in LRN neurons was remarkably regular (Fig. 1A), as can be seen from the narrow and often symmetrical interspike interval (ISI) distributions. The coefficients of variation (CV) of ISIs for LRN neurons (Fig. 1C) were extremely low, averaging 0.08 ± 0.01 (for 20 neurons in which ‘resting’ spontaneous discharge was assessed). For comparison, sustained chopper cells in the ventral cochlear nucleus, which spike with high regularity, have higher CVs (Blackburn & Sachs, 1989) and the discharges of cerebellar Golgi cells that fire at mean rates similar to LRN neurons (∼10 Hz) have CVs averaging 0.9 (Vos et al. 1999).
Table 1.
Firing frequency and CV of interspike intervals measured in LRN neurons under the different recording configurations used in this study
| n | Mean freq. (Hz) | SEM | Range | Mean CV of ISI | SEM | CV range | |
|---|---|---|---|---|---|---|---|
| In vivo, urethane | 20 | 14.0 | 0.76 | 7.9–22.0 | 0.08 | 0.01 | 0.03–0.21 |
| In vivo, decerebrate unanaesthetised | 9 | 10.5 | 1.28 | 6.6–17.8 | 0.22 | 0.016 | 0.16–0.30 |
| In vitro WCR control | 58 | 6.27 | 0.6 | 1.5–24.0 | 0.21 | 0.02 | 0.07–0.69 |
| In vitro CAP control | 5 | 8.76 | 3.5 | 2.9–21.5 | 0.12 | 0.02 | 0.05–0.15 |
| Cerebellar Golgi cells in vivo anaesthetized* | 87 | 8.42 | NA | 1.9–18.1 | 0.92 | NA | 0.19–2.36 |
For comparison, data for cerebellar Golgi cells that fire with similar mean rates are included in the lower row of the table (*data recorded in vivo from anaesthetized rats, from Vos et al. 1999). WCR, whole-cell recording; CAP, cell attached patch configuration; SEM, standard error of mean.
All LRN neurons studied in vivo were identified by antidromic activation following stimulation in the cerebellar white matter (Fig. 1D), confirming that they project fast-conducting mossy fibres to the cerebellum (Wu et al. 1999). Spikes were considered antidromic if they had fixed latencies following cerebellar white matter stimulation and were abolished by collision if the cerebellar stimuli were triggered to follow spontaneous spikes with short intervals. Collision occurs because the orthodromic spike used to trigger the stimulus is still travelling in the axon, rendering it refractory, when the antidromic spike is elicited (Swadlow, 1982). The antidromic spikes had short latencies (averaging 1.5 ± 0.05 ms; Fig. 1D), consistent with the fast-conducting axons of large cerebellar-projecting LRN neurons. Note that our stimuli may have activated the axons of LRN neurons at any point between the stem axon and the granular layer terminals, which may contribute to the spread of antidromic latencies.
LRN neurons show unique pause–reset responses to peripheral sensory stimulation
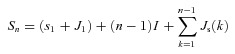
All of the LRN neurons tested (n= 33) responded to peripheral sensory stimuli with a pause in spiking, after which regular firing resumed at their idiosyncratic rate but with altered timing: the rhythm of firing was effectively ‘reset’ by the stimulus (Fig. 2A and B). In conjunction with the clock-like regularity of spontaneous spiking, this generated a high degree of post-stimulus inter-trial synchrony, such that the resulting PSTHs had a trough following the stimulus followed by distinct peaks and troughs lasting for several hundred milliseconds.
Figure 2. Peripheral stimulation of sensory afferents resets LRN firing.
A, spike trains from an LRN neuron showing the response to 3 successive stimuli delivered to contralateral trigeminal afferents. The times of spikes relative to each stimulus are plotted as lines at the top; dotted line indicates the stimulus artefact. The time interval between the stimulus and the pre-stimulus spike and the first post-stimulus spike are respectively labelled S–1 and S+1; note that while S–1 varies for each trial, S+1 is similar. B, raster and PSTH show the response of another LRN neuron to stimulation of contralateral hindlimb afferents (binwidth, 10 ms). The stimulus was delivered at time 0, indicated by the arrow. C, raster and PSTH as in B, but illustrating an example response from 1 of the 9 LRN neurons recorded in unanaesthetised decerebrate animals. D, LRN neuron spike times can be re-set by antidromic action potentials. The upper plot shows an autocorrelogram of spontaneous spiking. The 3 lower plots show similar autocorrelograms aligned by the spontaneous spike (filled bin at 0 ms) that triggered stimuli which elicited antidromic action potentials. These were delayed by 20, 30 and 40 ms from the trigger spike. Antidromically evoked spikes are indicated by the unfilled bins. Each PSTH was compiled from at least 30 trials; binwidth, 10 ms. The dashed vertical line indicates where the spike following the trigger spike would occur in the absence of an antidromic spike.
To our knowledge these in vivo firing characteristics have not been described previously in any cerebellar or pre-cerebellar neurons (and certainly not in other mossy fibres; Ohtsuka & Noda 1992; van Kan et al. 1993; Rancz et al. 2007; Prsa et al. 2009). To verify that the regular firing and characteristic pause–reset responses did not result from the use of urethane anaesthesia, we examined the behaviour of a sample of antidromically identified LRN neurons in unanaesthetised decerebrate animals. We recorded from nine antidromically identified LRN cells from six successful experiments; all of these fired regularly (at 10.5 ± 1.28 Hz; CV values of 0.22 ± 0.016; Table 1), but not as regularly as the neurons in anaesthetised rats (P < 0.05 compared with anaesthetised rats, ANOVA with Bonferroni multiple comparison's test). Many of these neurons did periodically show pauses and/or longer-lasting changes in firing pattern, where firing rate varied over many seconds. These lower frequency rhythmically patterned changes are likely to represent fictive motor patterns, and this may have influenced the regularity of firing. Importantly, pause–reset responses like those seen in urethane-anaesthetised animals were evoked by peripheral afferent stimulation in all nine LRN neurons in the absence of anaesthesia. A response from one of these is illustrated in Fig. 2C. Thus, regular firing and the characteristic pause–reset response do not depend on anaesthesia.
Although stimulation of peripheral afferents generated excitations in a small number of LRN neurons (see below), in all neurons tested stimulation of at least one source of afferents generated responses in which the first change in firing was a reduction in spike probability. Accordingly, the subsequent well-timed spikes could not have arisen from refractoriness following excitation. The origin of the pause–reset response in LRN neurons could therefore be explained by inhibition of intrinsic spontaneous firing mechanisms or by interruption of a tonic rhythmic excitatory drive to LRN neurons. To differentiate between these possibilities, we examined whether insertion of extraneous ‘unexpected’ action potentials could influence spike timing. In 13 LRN neurons, an antidromic action potential was delivered, timed to occur at specific times following spontaneous spikes. Antidromic spikes generated in this way also reliably reset the intrinsic firing rhythm, shifting the histogram peaks in time relative to the interleaved antidromic spikes (example in Fig. 2D). The regular spontaneous firing is therefore unlikely to be determined by a patterned extrinsic excitatory drive: insertion of an extraneous antidromic spike amongst synaptically driven spikes would be unlikely to reset the spike firing in this way. In light of this, a plausible explanation is that regular spontaneous spiking originates from intrinsic membrane conductances of LRN neurons, and that the pause in firing is due to inhibitory drive. This was investigated further in a model of LRN spiking (Fig. 4) and in vitro (Figs 5–8).
Figure 4. Arithmetic progression model of the temporal parameters required to generate the LRN neuron response.
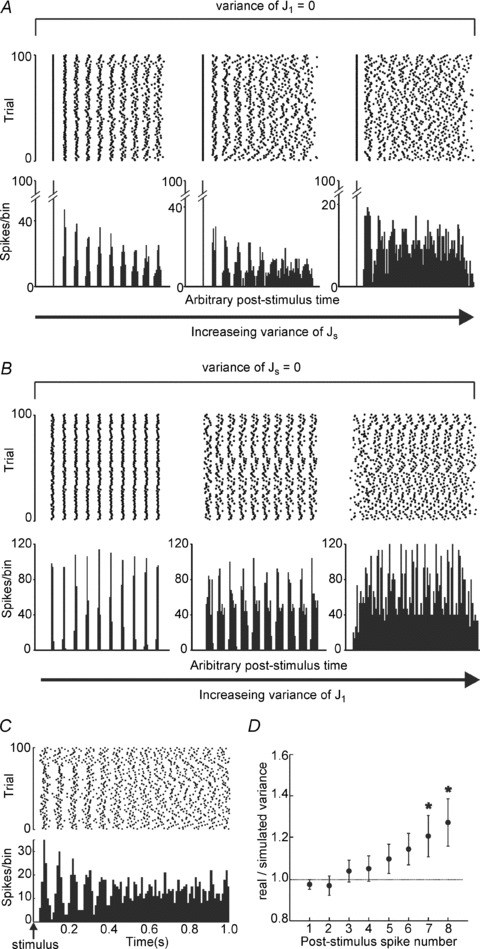
A, model outputs if the jitter in the onset time of the first post-stimulus spike (variance of J1) is kept at 0 whilst the jitter in the interspike intervals (variance of Js) is increased (from left to right). B, model outputs if the jitter in the timing of interspike intervals (variance of Js) is kept at 0 whilst jitter in the onset time of the first post-stimulus spike (variance of J1) is increased (from left to right). C, model outputs if the jitter and spike timing values are set to the mean values derived from real data obtained from the in vivo experiments. D, the ratio of the variance seen in real data from in vivo recordings and the variance expected from a linear spike-by-spike sum of the model values is plotted for each successive spike following a stimulus. The real values do not differ significantly from the linear sum for the first 6 spikes.
Figure 5. SK conductance, but not Ih, keeps interspike interval jitter low.
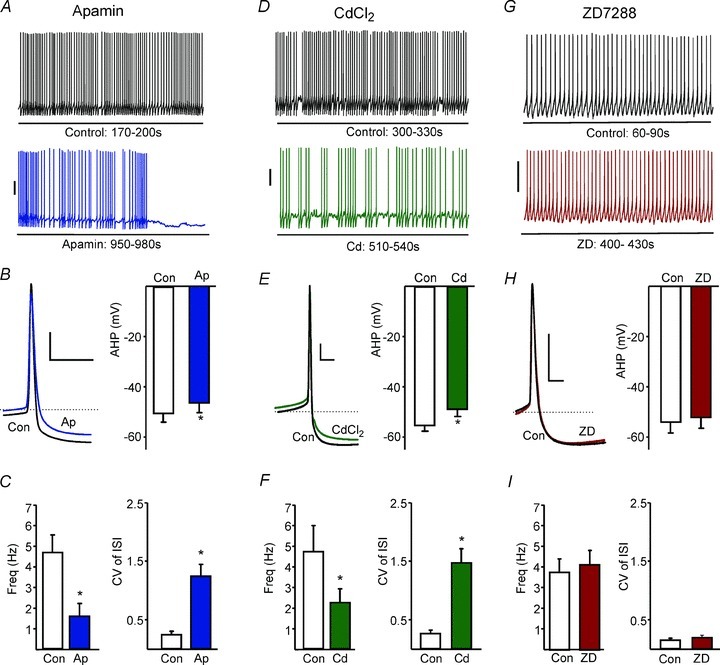
A, example spikes in control (top) and in the presence of apamin. B, apamin significantly reduced the amplitude of AHP. Left: averaged action potential waveform from 30s of spiking before (Con) and after the addition of apamin (Ap). Dashed line represents −40 mV; scale bars are 10 mV and 10 ms. C, mean spike frequencies and CV of ISI are, respectively, decreased and increased by apamin (P= 0.009 and P= 0.0007, respectively, n= 7 paired t test). D, example spikes in control and in the presence of Cd2+. E, Cd2+ significantly reduced the amplitude of the AHP (waveform averages as for B). F, mean spike frequencies and CV of ISI are, respectively, decreased and increased by Cd2+ (P= 0.015 and P= 0.0007, respectively, n= 9, paired t test). G, example spikes in control and in the presence of ZD7288. H, ZD7288 had no significant effect on AHP amplitude. I, neither mean spike frequencies nor CV of ISI were affected by ZD7288 (P= 0.10 and P= 0.11, respectively, n= 6, paired t test). In A, D and G scale bars represent 20 mV.
The characteristic pause–reset response could be evoked by stimulation of broad and bilateral areas of the body in many LRN neurons (Fig. 3A). We routinely tested stimulation of afferents from all four limbs and from the trigeminal afferents. The majority of LRN neurons responded to stimulation of several of these skin areas; more than 50% responded to stimulation of any given limb (Fig. 3B). A minority of LRN neurons (6/33) showed a brief excitation–reset response to one of the sensory inputs tested, in addition to the pause–reset response described above evoked by the other inputs.
Figure 3. Convergent sensory input can reset LRN neuronal spiking.
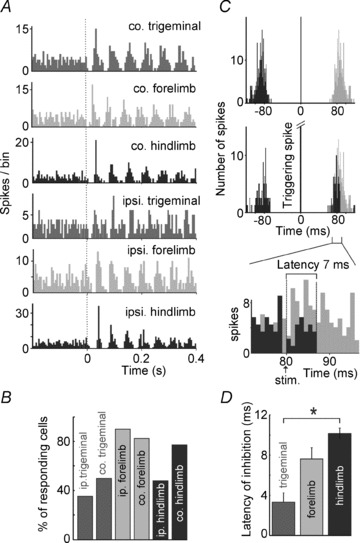
A, PSTHs show similar resetting responses to stimulation of afferents from all limbs and from the trigeminal skin, bilaterally. B, proportions of cells that reset their firing post-stimulus to each of the six peripheral stimulation sites tested. C, method for calculating onset latencies for inhibition. The upper panel is an autocorrelogram of spontaneous LRN spiking: spikes following the trigger spike are shown in the grey bins. Below is an autocorrelogram triggered from spikes that themselves triggered peripheral stimuli with a delay (in this case 80 ms). Thus, these stimuli were timed to occur around the time that the neuron was likely to fire. The resulting bins are superimposed on the grey bins from the upper autocorrelogram. The distribution of black bins is truncated shortly after the stimulus. The bottom panel shows the relevant parts of the autocorrelograms on an expanded timebase: stimuli delivered 80 ms after a spontaneously occurring spike (arrow) led to abolition of spikes from 87 ms on, indicating inhibition with a latency of 7 ms. D, onset latencies of the initial pause in spiking in response to stimulation of trigeminal, forelimb and hindlimb skin from, respectively, 3, 10 and 7 cells (from either side of the body, *P= 0.007, Bonferroni post hoc analysis of one-way ANOVA).
As LRN neurons fire with such regularity, the onset latencies of stimulus-evoked pauses are hard to judge from PSTHs generated by stimuli delivered at diverse points in the regular firing cycle of the LRN neurons. To obtain a more accurate latency measure, we delivered precisely timed stimuli in those neurons in which the reset was powerful (Fig. 3C). We used spontaneous spikes to trigger a peripheral stimulus to occur with a delay selected so that on each trial the stimulus occurred around the time that the subsequent spontaneous spike was likely to occur. By repeating this spike-triggered stimulus, PSTHs were built with the triggering spike forming a single bin occurring at t= 0 and the preceding and proceeding spikes falling within a time period according to the interspike interval distribution for spontaneous spikes. Compared with the distribution of spike times preceding the trigger spike, the proceeding spike distribution is truncated by the pause generated by the peripheral stimulus. The time of the interruption is taken as the onset of the pause, and can be assessed by comparing the peristimulus histogram with the autocorrelogram. The time interval between the time of the peripheral stimulus and the distribution truncation is interpreted as the amount of time taken for the peripheral stimulus to reach the LRN neuron.
The latencies obtained from this approach (Fig. 3D) suggest that LRN neuron responses are generated via a fast ascending pathway with few intervening synapses. For comparison, in three experiments we measured the latencies of the earliest potentials recorded from the gracile nucleus, which lies directly dorsal to the LRN, which would be mediated by the fastest conducting hindlimb cutaneous afferents and averaged 6.8 ± 0.45 ms (data not shown). In comparison, the latencies of the onset of the pause in LRN neuron firing evoked by hindlimb stimulation averaged just over 10 ms. Since ascending primary afferents do not directly target the LRN, this additional time would have to include at least two synaptic relays. Fast-conducting spinal pathways to the LRN have been reported previously (Ekerot, 1990b).
What temporal parameters are required for the pause–reset response?
Post-stimulus spiking in LRN neurons was highly predictable, with precisely timed spikes that gave rise to characteristic PSTHs with multiple post-stimulus peaks and troughs. To determine what temporal parameters are required for LRN neurons to fire so predictably after each inhibitory stimulus, thus generating the inter-trial synchrony, a simple model of post-stimulus spiking was created (Methods). The model simulates post-stimulus neuronal spiking using an arithmetic progression following a stimulus with a known starting value (delay to first spike) and a known common time difference between spikes (the ISI). These values were obtained from population in vivo recordings of real LRN neurons; 23 responses from 18 different LRN neurons which had strong reset responses (i.e. where the stimulus consistently silenced the LRN neuron on every presentation) were used. Means and standard deviations of interspike intervals were drawn from spontaneous spiking of the LRN neurons recorded in vivo under anaesthesia (Table 1). Figure 4A shows simulated raster plots and PSTHs generated when the timing of the first post-stimulus spike is fixed (standard deviation for first spike jitter kept at 0) whilst interspike jitter of the subsequent spikes was systematically varied. For all simulations, the successive peaks in the PSTH gradually became shorter and broader the further in time they occur post-stimulus, as occurs in real LRN neurons. In other words, the timing of the spikes becomes less predictable the later they occur after the sensory stimulus due to spike-wise accumulated jitter. Moreover, as shown in Fig. 4B, when the jitter of interspike intervals is set to zero (i.e. the spiking is perfectly metronomic) but the jitter in the timing of the first spike is systematically increased, inter-trial synchrony still deteriorates with increasing first spike jitter, albeit in a time-independent manner.
This simple model suggests that the high degree of inter-trial synchrony observed in the in vivo responses requires that the random jitter in both the spontaneous interspike intervals and the timing of the first post-inhibitory spike be kept low. Incorporating the mean latencies and mean standard deviation values obtained for real cells recorded in vivo (mean values taken from 18 cells that had a clear post-stimulus spiking cessation followed by reset after every stimulus) into the model produced a raster and PSTH (Fig. 4C) that closely resembles the individual responses of real LRN neurons (Figs 2 and 3), qualitatively supporting the validity of the model and applicability to real LRN neurons.
In our model the sources of variance of spike timing are: (i) first post-stimulus spike latency; and (ii) interspike intervals of spontaneously occurring spikes. If these are the only sources of variance, the variance of the timing of successive spikes should increase linearly spike-by-spike following the stimulus, and be comparable to real data. To test this, we compared the inter-trial variance of the first eight post-stimulus spikes from the simulated PSTHs with the mean variance of the real cells’ responses. Figure 4D plots the ratio of the variance of the real and simulated spikes. The average real spike variances are similar for the first few spikes, but then increase, becoming significantly greater seven or more spikes following the stimulus. This could be because additional sources of subthreshold synaptic inputs, other than those activated by the stimulus, contribute to the greater than expected increase in variance of spike timing. It is well known that LRN neurons have inputs from many central structures including the cerebellum and descending pathways (Rosen & Scheid, 1973; Marini & Wiesendanger, 1987; Ekerot, 1990a; Wu et al. 1999). Considering this, the match between our model data and the real data indicates that our model of inhibitory interruption resetting the intrinsic rhythm of the neuron is a good approximation to explain the resetting behaviour of the LRN neuron population, at least for the first six spikes following a stimulus.
We next investigated in vitro whether LRN neurons express intrinsic ionic conductances that could contribute to maintaining a low jitter in the spontaneous interspike intervals and a low jitter in the timing of the first post-inhibitory spike.
LRN neurons discharge continuously and regularly in vitro
In vitro recordings were made from 121 relatively large neurons in the LRN of rat medulla slices. In whole-cell current clamp mode, recordings were made from 58 LRN neurons to determine spontaneous spiking. Comparable regularity (CV of ISIs, 0.21 ± 0.02) to the firing of LRN neurons in unanaesthetised decerebrate animals was observed (Table 1). There was no relationship between age of rat and CV (6 to 16 days old, R2= 0.0002). We recorded spontaneous firing in five additional LRN neurons using the cell-attached patch method (Table 1), in which the intracellular environment is intact (comparable to extracellular recordings in vivo): CV values in these (0.12 ± 0.02) were not significantly different to in vivo values (unpaired t test, P= 0.18). Regardless of recording conditions, all LRN neurons with mean discharge rates greater than 5 Hz had CVs less than 0.3.
Because of the continual spiking activity of LRN neurons, estimation of resting membrane potential is not possible. In order to estimate interspike membrane potential, we measured the halfway point between the peak AHP and the action potential threshold voltage. This value is termed ‘subthreshold Em’ and was −42.7 ± 0.75 mV (n= 58) in LRN neurons.
SK conductance keeps interspike interval jitter low
In many other systems the Ca2+-activated small K+ conductance SK plays a role in spike regularity (Stocker et al. 1999; Atherton & Bevan, 2005; Bond et al. 2005; Walter et al. 2006; Solinas et al. 2010). We therefore investigated a possible role for SK in the clock-like firing of LRN neurons. Firing was recorded before and after application of the SK channel blocker apamin (100 nm) in seven LRN neurons (example in Fig. 5A). Apamin significantly reduced the spike AHP (7.7% inhibition, P= 0.01, paired t test; Fig. 5B), the regularity of spiking (from a CV value of 0.24 ± 0.06 to 1.24 ± 0.21, P= 0.0007; Fig. 5C) and firing frequency (from 4.67 ± 0.85 Hz to 1.56 ± 0.62 Hz, P= 0.009; Fig. 5C). Consistent with a role for SK, blockade of voltage-gated Ca2+ channels by application of Cd2+ (100 μm) also significantly reduced AHP amplitude (11.7% inhibition, P= 0.038, paired t test), CV of ISI values (from 0.26 ± 0.06 to 1.5 ± 0.25, P= 0.0007, paired t test) and firing frequency (from 4.72 ± 1.26 to 2.23 ± 0.68, P= 0.015, paired t test) as shown in Fig. 5D–F. These data support the idea that SK generates a significant component of the AHP and contributes to the clock-like regularity of LRN neuronal spike firing, a requirement for the characteristic response pattern of LRN neurons (see Fig. 4). By contrast, the HCN channel blocker ZD7288 (50 μm) did not affect the regularity (P= 0.11) or frequency (P= 0.10) of spontaneous firing or the amplitude of the AHP (P= 0.19), as shown in Fig. 5G–I.
Ih is present in LRN neurons
Characteristically, Ih is activated during membrane hyperpolarization and causes a concomitant relatively slow depolarization, in current clamp giving a signature voltage ‘sag’ (Vsag) and in voltage clamp giving a signature current ‘sag’ (Isag). To determine whether Ih is active in LRN neurons at membrane potentials that are moderately hyperpolarized from the typical interspike membrane potential, we voltage-clamped the membrane to −40 mV (in the presence of tetrodotoxin) and applied 3 s hyperpolarizing voltage steps (Fig. 6A). A time-dependent inward current that was inhibited by ZD7288 (50 μm) was seen on stepping to voltages between −60 and −90 mV (Fig. 6A). In eight LRN neurons where an Isag was measured after a step to −80 mV, application of ZD7288 effectively abolished the current (reduction by 99.8 ± 0.2%): the amplitudes of the ZD7288-sensitive current at different membrane potentials are plotted in Fig. 6B. Hyperpolarisation-activated currents were also sensitive to block by extracellular Cs+ ions in a concentration-dependent manner (Fig. 6C; inhibition at 3 mm Cs+, 75.3 ± 11.2%, n= 5), consistent with the presence of Ih in LRN neurons. The time constant of activation of the ZD7288-sensitive current at –80 mV, determined by fitting with a single exponential decay function, was 658.6 ± 162.4 ms (n= 7).
Figure 6. Ih is present in LRN neurons.
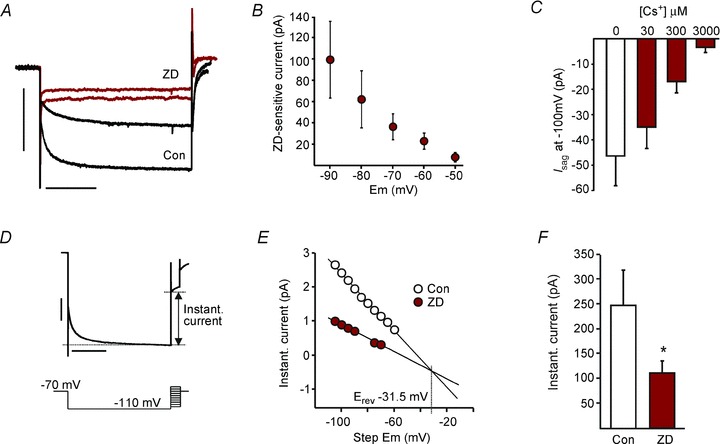
A, overlaid current traces from an example cell in control (Con) and ZD7288 (ZD) during voltage steps from −40 mV to −80 mV and −90 mV. Scale bars represent 500 pA and 1 s. B, plot of ZD-sensitive time-dependent current amplitude upon stepping from −40 mV to various more hyperpolarised membrane potentials (n= 12). C, bar graph of Isag amplitude upon stepping membrane potential from −70 mV to −100 mV in control, 30, 300 and 3000 μm Cs+ (n= 5–7). D, illustration of the voltage step protocol and sample current trace demonstrating the instantaneous current. E, plot (for sample cell in D) of the instantaneous current against intermediate voltage step values before (open circles) and after adding ZD. The intercept point of the extrapolated linear regression lines represents the membrane voltage at which no current flows through the HCN channel. F, bar graph of the instantaneous current upon stepping membrane potential from −40 mV to −80 mV in control (open bar) and ZD (n= 12; P= 0.049, paired t test).
The reversal potential of the Ih current was determined by measuring and plotting instantaneous current at intermediate voltage steps in control and in the presence of ZD7288; the linear regression lines of the two plots were extrapolated (Fig. 6D and E). Their point of intersection represents the voltage at which ZD7288 had no effect on the instantaneous membrane current (i.e. the voltage at which the open channel Ih current is zero (McCormick & Pape, 1990). The mean voltage at which the two linear regression lines intersected was –36.7 ± 6.2 mV (n= 9 cells from six rats all aged >10 days old). There was a significant difference in the instantaneous component of the current (evoked by hyperpolarisation from −40 to −80 mV) after the addition of ZD7288 (43.7 ± 8.5% inhbition, n= 12, P= 0.049, paired t test; Fig. 6F), suggesting that some Ih channels are constitutively open even at −40 mV (Aponte et al. 2006). These observations taken together suggest that modest deviations from the subthreshold Em (−42.7 mV) would generate current through constitutively open HCN channels.
Ih conductance keeps jitter in the latency of the first spike low
We investigated a possible role of Ih in the timing and jitter of post-inhibition spiking. First we sought to recruit Ih robustly with a long-lasting (3 s) hyperpolarizing prepulse. In current clamp recordings, adjusting the membrane potential to −70 mV abolished spontaneous spiking: we examined spike responses to depolarizing pulses (to −40 ± 5 mV, comparable to the mean subthreshold membrane potential) following hyperpolarising prepulses. The hyperpolarizing current prepulses activated a Vsag that was inhibited by ZD7288 (50 μm, Fig. 7A; 69.0 ± 12.6%, n= 8). For each cell, steady-state prepulses were matched to the same membrane potentials before and after adding ZD7288, to allow a valid comparison. Blockade of Ih by ZD7288 significantly changed the first post-hyperpolarization spike, increasing both the onset latency (from 32.3 ± 1.29 ms to 47.0 ± 3.6 ms, P < 0.001; Fig. 7B) and jitter (standard deviation; from 1.29 ± 0.03 ms to 3.57 ± 0.08 ms, P= 0.03; Fig. 7C). Additionally, the average rate of depolarization to first spike threshold from the same steady-state prepulse voltages was significantly reduced, from 1.77 ± 0.09 mV ms−1 to 1.22 ± 0.08 mV ms−1 (P < 0.001) in ZD7288 (example in inset in Fig. 7A, population data in Fig. 7D). Finally, the first spike latency had significantly lower variability following prepulses that produced larger voltage sags (1.94 ± 0.42 ms following Vsag <5 mV, compared with 0.87 ± 0.36 ms following Vsag >5 mV, P < 0.04, Fig. 7E). Thus, strong recruitment of Ih reduced the jitter of the first spike following inhibition and blocking it with ZD7288 reversed this effect. Purely depolarization-driven firing in the absence of hyperpolarizing prepulses was not significantly affected by ZD7288 (Fig. 7F).
Figure 7. Blocking Ih conductance increases both latency and jitter of first post-hyperpolarisation evoked spike following robust activation of Ih.
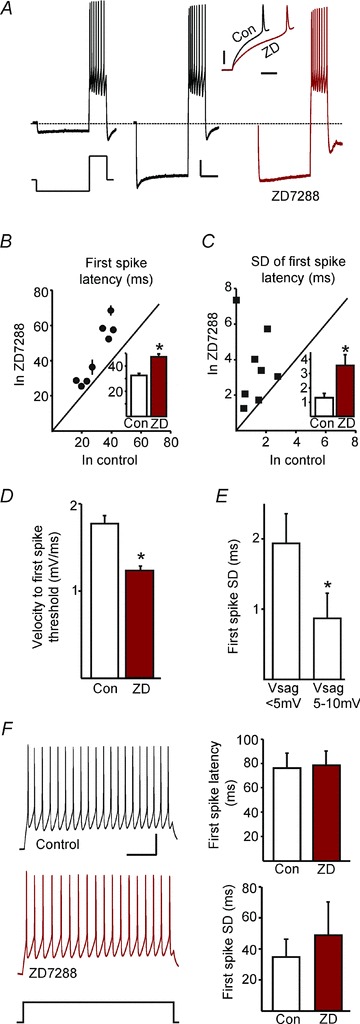
A, response of an LRN neuron to two different hyperpolarizing current pulses, the second of which produces a voltage sag (left and middle traces), each followed by a depolarising current pulse to a fixed subthreshold voltage (dashed line at −70 mV; scale bars represent 10 mV and 1 s). After application of ZD (right), the voltage sag during the prepulse was decreased. Inset shows the overlay of the membrane voltage from the onset of depolarizing current to the first spike in control (Con) and ZD (scale bars, 20 mV and 20 ms). B, mean first spike latency in the presence of ZD plotted against control values for the same steady-state prepulse voltages (8 cells, each point represents one cell). Horizontal and vertical error bars represent standard errors; where not seen they are smaller than the data point. C, standard deviations (SD) of the first spike latencies (shown in B) in the presence of ZD plotted against control values for the same steady-state prepulse voltages. The effect of ZD on first spike latency and SD are summarised (insets); both are significantly increased by ZD (P < 0.001 and P= 0.03, respectively, paired t tests). D, velocity of depolarisation to threshold from a given prepulse is significantly reduced by ZD (10 cells, P < 0.001, paired t test). E, SD of first spike latency for small and large voltage sag amplitudes (6 cells; P= 0.04, paired t test), showing that greater Ih activation by the prepulse leads to smaller jitter in the latencies of the first spike. F, neither the first spike latency nor its jitter are affected by ZD for spikes evoked by purely depolarising current injections (n= 5; P= 0.8 and 0.3, respectively, paired t test). Scale bars represent 20 mV and 200 ms.
Our in vivo recordings showed that sensory stimulation caused a pause in spontaneous spiking of ∼60 ms duration; we asked therefore whether hyperpolarizations of comparable durations could also affect the precision of post-hyperpolarization spikes in vitro. Brief hyperpolarizing pulses (60, 120 or 240 ms) to potentials between −50 and −110 mV were applied to spontaneously firing LRN neurons. In four of these neurons Isag amplitudes were small (less than 100 pA): increasing the magnitude or duration of the hyperpolarization in these neurons either increased or had no clear effect on the latency and the jitter of the first spike. An example recording is shown in Fig. 8A. First spike latency and jitter values for these low-amplitude Isag cells are plotted against the duration of the hyperpolarization in Fig. 8C and D as grey symbols. Conversely, in LRN neurons with Isag amplitudes greater than 100 pA, increasing the duration or the amplitude of the hyperpolarization caused decreases in both the latency and jitter of the first spike; an example is shown in Fig. 8B and data from six of these neurons are also plotted in Fig. 8C and D as black symbols. For example, mean latency SD was 91.8 ± 43.6 ms (n= 6) after a 60 ms prepulse and declined to 25.4 ± 10.2 ms after a 120 ms prepulse, while mean latency SD was much longer (286.2 ± 51.8 ms n= 4) after 120 ms prepulses in cells having a small Ih (see Fig. 8 legend for further detail). In three LRN neurons, Isag had a magnitude >200 pA and even at the shortest duration of hyperpolarization (60 ms), first-spike latency and its jitter were very small and showed little further decrease, indicating that even brief (60 ms) hyperpolarization activates sufficient Ih to practically minimize jitter. Plots of the relationship between Isag amplitude and first spike latency or jitter (Fig. 8E and F) for all cells reveal that both decrease as Isag amplitude increases (for 60, 120 and 240 ms hyperpolarizing current pulses).
Figure 8. Ih can play a part in shortening and sharpening post-hyperpolarisation spike timing even following short and modest hyperpolarisations.
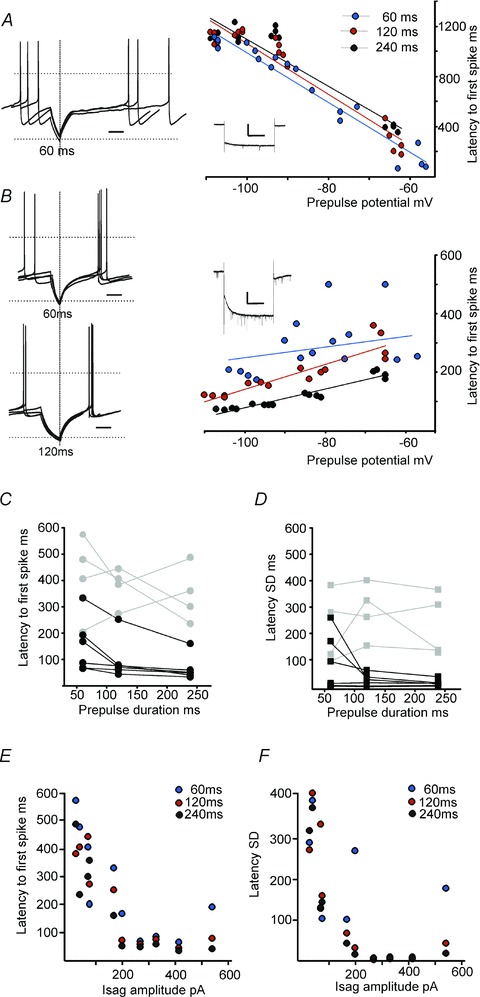
A, current clamp recording (left) from one LRN neuron with little apparent Isag (<100 pA upon stepping membrane potential from −60 mV to −110 mV; see inset right, scale bar is 100 pA, 1 s). Overlaid spike traces are aligned by the offset of the hyperpolarising current pulse, showing that post-hyperpolarisation spikes are relatively scattered in time. Time scale bar, 0.1 s; horizontal lines represent 0 and −80 mV. Graph on the right plots the latency of the first post-hyperpolarisation spike against prepulse membrane potential for 3 different prepulse durations. Note the increasing latency with progressive hyperpolarisation in this cell. B, another LRN neuron with a large Isag (>100 pA, see inset right, scale bar is 100 pA, 1 s). Top overlaid traces show shorter latency and more temporally precise post-hyperpolarisation spikes following a 60-ms-long hyperpolarisation than the cell illustrated in A: even shorter latency and more temporally precise spikes follow a 120-ms-long hyperpolarisation (bottom overlaid traces). For this cell, latency decreased with progressive hyperpolarization (graph on right). C, plot of mean latencies of first post-hyperpolarisation spikes against prepulse durations. Black symbols represent cells with large Isag (>100 pA). Latencies were 151 ± 42 ms following a 60 ms prepulse and 65 ± 19 ms following a 240 ms prepulse. Grey symbols represent cells with small Isag (<100 pA), which had latencies of 345 ± 53 ms even after a 240 ms prepulse. D, plot of mean latency SD values of first post-hyperpolarisation spikes against prepulse durations. Latency SD values were 91 ± 44 ms or 15 ± 5 ms after 60 ms or 240 ms prepulses, respectively, in cells with large Isag (black symbols). E and F plot the first spike latency and SD, respectively, for all cells (with large or small Isag) against their corresponding Isag amplitude. For C–F, each data point represents mean latency and SD values following 6–16 repeated hyperpolarisations (to between −60 and −90 mV) for the durations indicated, in a single LRN neuron.
Jitter in post-pause spiking is also inversely related to pause duration in vivo
The data presented in Fig. 8 suggest that hyperpolarizations that recruit Ih can sharpen the timing of post-inhibitory spike firing even following short periods of inhibition, with durations similar to those evoked by peripheral stimuli, and that longer periods have larger effects. Does the same phenomenon occur in vivo? We returned to in vivo experiments to examine this question, by systematically varying the stimulus-evoked inhibition of LRN neuron firing. We achieved this by delivering combinations of consecutive stimuli (usually to different receptive fields) to produce longer lasting pauses in spiking. At least three different combinations of stimuli were delivered to 11 different LRN neurons, which generated pauses in spiking with durations ranging from 44 to 334 ms, in the range of those used in vitro (Fig. 8). Figure 9A–C shows PSTHs from an example cell: the striking finding is that the timing precision of the first post-pause spike increased (i.e. SD decreased) with increasing durations of inhibition. This is at odds with what would be expected if the first spike was evoked by depolarization to threshold via a stochastic process. The first spike jitter decreased systematically with increasing pause duration for this cell as shown in Fig. 9D: each of the 11 points in the graph represent first spike SD values derived from 50 successive deliveries of a specific combination of stimuli.
Figure 9. Jitter of the first post-pause spike in vivo depends on duration of the pause.
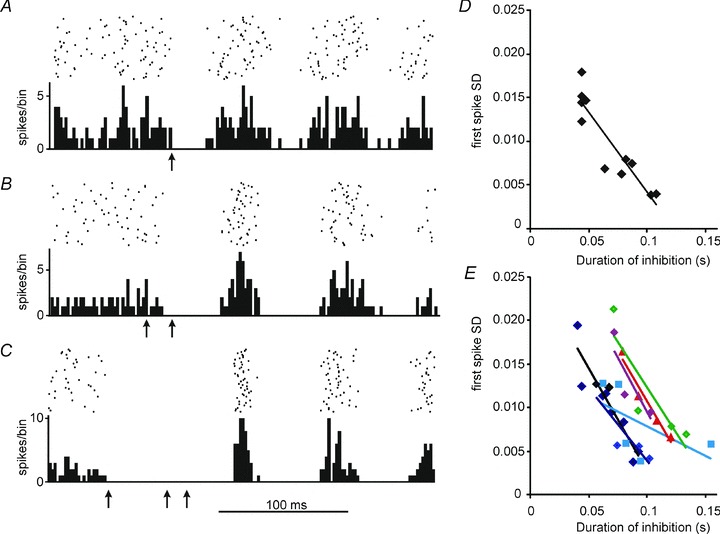
A–C show PSTHs and rasters (50 stimuli, bin with 2 ms) for combinations of stimuli (marked by arrows) that generate different durations of inhibition. The data are aligned vertically to the mean latency of the first post-inhibitory spike. As the duration of inhibition increases progressively from A to C, the first post-inhibitory peak of the PSTHs becomes narrower and higher. D, SD of the first post-inhibitory spike plotted against duration of inhibition for 11 different combinations of stimuli for the cell illustrated in A–C, fitted with a linear function. There is a significant inverse correlation (correlation coefficient −0.913, P < 0.001, Pearson product moment correlation). E, similar plots to D for 6 further LRN neurons again fitted with linear functions.
A similar relationship was shown for 10 of the 11 LRN neurons tested; plots for 6 additional cells are shown in Fig. 9E. Correlation analysis reveals a strong inverse correlation between pause duration and first spike SD for these 10 cells. Mean correlation coefficient was −0.83 ± 0.04 (range −0.58 to −0.98, Pearson product moment correlation). These in vivo effects mirror the in vitro phenomena described in Fig. 8.
In summary, these results suggest that the SK conductance contributes to maintaining a low jitter in interspike interval values whilst the Ih conductance may be responsible for lowering the jitter in the timing of the first post-inhibitory spike, the two key parameters required for the pause–reset responses of LRN neurons to peripheral stimulation (Fig. 4). Therefore, the concerted activity of these two conductances could explain the in vivo behaviour of LRN neurons, and could underpin a background timing role for these cerebellar afferents.
Discussion
We show that, in vivo, LRN neurons fire with extreme regularity, pause their firing in response to a sensory stimulus, and then resume firing with a reset rhythm. We propose that this mechanism provides a widely broadcast signal to much of the cerebellum, through which sensory events can elicit well timed signals over hundreds of milliseconds. This has been postulated in computational models of how the cerebellum generates appropriately timed behavioural responses (Medina & Mauk, 2000; Yamazaki & Tanaka, 2005) but hitherto not demonstrated in real neurons in vivo. LRN signals provide a potential mechanism to activate and entrain oscillatory mechanisms in the cortex (D’Angelo et al. 2009; Dugue et al. 2009; Solinas et al. 2010) and to provide long-duration representations of event timing (Medina & Mauk, 2000; Maex & Steuber, 2009). Furthermore, we provide a plausible ionic basis for this pause–reset response: contributions from SK and Ih conductances in LRN neurons. These unusual properties are remarkably similar to the properties of neurons in a brainstem auditory nucleus (the superior paraolivary nucleus) where a role of Ih in sharpening the temporal precision of post-inhibitory spiking was recently demonstrated (Kopp-Scheinpflug et al. 2011).
It is highly unusual for neuronal spiking recorded in vivo to show the remarkable degree of regularity observed in LRN neurons in this study. Indeed, other descriptions of mossy fibre activity have reported phasic and irregular discharge (Ohtsuka & Noda, 1992; van Kan et al. 1993; Rancz et al. 2007; Prsa et al. 2009): this most probably represents parametric information, largely from sensory systems that provide the principal input to these other sources of mossy fibres. The spontaneous clock-like firing of LRN neurons suggests that they provide a tonic excitatory mossy fibre input to the cerebellum that is subject to being reset in time by sensory-evoked perturbations. LRN-derived mossy fibres project widely throughout the cerebellar cortex and nuclei (Wu et al. 1999; Valle et al. 2001), and can converge onto single granule cells (Bengtsson & Jorntell, 2009). There is unlikely to be strong somatotopic representation in this signalling pathway since LRN neurons respond similarly to stimulation of large receptive fields that can span most of the body. The reliable resetting of spikes following a stimulus suggests that relative timing, rather than the spatial location or the modality of events (stimuli), may be signalled by LRN neurons. Since we demonstrate similar behaviour in decerebrate preparations, this is not a pharmacological effect of the anaesthetised state. Whether this behaviour is also seen in forebrain-intact awake animals is unknown: some LRN neurons have substantial inputs from descending motor pathways, including cerebral cortex. We do not know whether these are direct or indirect, or occur in the LRN neurons described here: if they do, these descending pathways from the forebrain could modulate the LRN neuron responses we describe.
The cerebellar cortical targets for LRN-derived mossy fibres are granule cells (Bengtsson & Jorntell, 2009) and Golgi cells (Xu & Edgley, 2010). Despite the widespread projection of LRN-derived mossy fibres, explicit clock-like firing has not been reported in granule cells recorded in vivo (Jorntell & Ekerot, 2006; Rancz et al. 2007; Arenz et al. 2008; Bengtsson & Jorntell, 2009). The downstream implications of LRN activity depend on convergence patterns of mossy fibres onto granule cells, on which there is debate (Arenz et al. 2009). If multiple LRN mossy fibres converge onto single granule cells (Bengtsson & Jorntell, 2009) then they may generate precisely timed outputs. If they converge with (non-clock-like) mossy fibres from other sources (Rancz et al. 2007; Arenz et al. 2009), LRN-derived EPSPs could gate the timing of granule cell responses to those inputs. Several different studies have provided theoretical and experimental evidence for oscillatory processes in the granule cell layer in the frequency range of LRN neuron firing (Pellerin & Lamarre, 1997; Hartmann & Bower, 1998; Maex & De Schutter, 1998; Courtemanche & Lamarre, 2005; D’Angelo et al. 2009; Dugue et al. 2009). Thus, LRN neurons could generate regular, stimulus-locked inputs which could initiate, sustain and entrain these cerebellar cortical oscillatory mechanisms (D’Angelo et al. 2009; Dugue et al. 2009; Solinas et al. 2010), a potential substrate for the temporal coordination of neuronal interactions. These interactions may provide precisely timed signals for plasticity, as well as for generating precisely timed cerebellar output signals for movement or interaction with other parts of the nervous system (for discussion see D’Angelo et al. 2009).
The extremely broad and overlapping receptive fields of LRN neurons indicate that many neurons will respond similarly to any given peripheral stimulus, providing a timing signal in the form of significant population activity maxima and minima, sustained over many hundreds of milliseconds following a stimulus. From our results there immediately emerge two non-mutually exclusive mechanisms by which LRN neurons could keep time: firstly, by time interval factorisation e.g. if one cell has an ISI of x ms and another cell has an ISI of y ms, and if both cells are reset by the same stimulus then they would fire coincidentally xy ms after the stimulus, and at any interval that is a common factor of x and y. Secondly, by population synchrony decay i.e. a group of cells with very similar ISIs (or ISIs that are integer multiples of each other) reset by the same stimulus are brought into a temporary synchrony that decays predictably over time. Furthermore, either of these of these mechanisms have the potential to be a transient memory buffer for timing (Maex & Steuber, 2009), a mechanism for what has been called ‘short-term memory’ within a neural network.
At this stage we do not know whether the continuous firing seen both in vivo and in vitro represents autorhythmicity (i.e. is due to intrinsic membrane properties), or is driven by tonic synaptic inputs. Our focus is on the origin of the resetting of this spontaneous firing following stimuli that evoke pauses in firing. To explore this, we used a linear model of post-stimulus spiking. This behaviour can be adequately explained by an inhibition of firing followed by a resumption of spontaneous firing; indeed, we find it difficult to explain the sharp and powerful stimulus-evoked cessation of firing, with no prior excitation, without invoking inhibition. Our model also identified two parameters that can explain our key findings in vivo: firstly, that spontaneous firing is highly regular; secondly, the first post-inhibitory spike is precisely timed. Using in vitro approaches, we illustrate two ionic mechanisms in LRN neurons that may account for these modelled parameters. The ability to maintain clock-like regularity of firing may be conferred, at least in part, by SK conductance, while Ih conductance could contribute to the precision of post-inhibitory spike timing. Apamin- and Cd2+-sensitive currents contribute to the AHP and to regular spontaneous firing of LRN neurons (Fig. 5), without which the pause–reset response, representing the timing of sensory stimuli, is disrupted (Fig. 4A). This finding is in broad agreement with previous demonstrations of a role for SK in the maintenance of tonic spiking and timing precision in neurons of the hippocampus, midbrain and cerebellum (Stocker et al. 1999; Atherton & Bevan, 2005; Bond et al. 2005; Walter et al. 2006; Solinas et al. 2010). Other conductances that could potentially contribute to regular firing include transient KV3 K+ channels; however, they are typically associated with higher frequencies of firing (Johnston et al. 2010) than observed in LRN neurons. Classic transient A-type (KV4) K+ currents require a brief hyperpolarisation to remove inactivation (Johnston et al. 2010), making them unlikely contributors. We cannot and do not rule out a role for other intrinsic conductances or synaptic inputs in driving LRN firing; however, it is clear that block of voltage-gated Ca2+ currents or of SK current disrupts the high degree of regularity in vitro.
In neurons, precise roles for Ih have proved difficult to identify (Biel et al. 2009). Ih-dependent pacemaking is surprisingly rare in neurons; a role in rhythmogenicity has been demonstrated only for thalamic relay neurons, some hippocampal interneurons and cerebellar Golgi cells (McCormick & Pape, 1990; Maccaferri & McBain, 1996; Forti et al. 2006). In a model of cerebellar Golgi cells, recruitment of Ih causes rebound excitation following hyperpolarisation (Solinas et al. 2007). Recently, a role for Ih in reducing and sharpening rebound spike latency, very similar to the phenomenon we describe here, has been proposed in brainstem auditory neurons: Ih, recruited during sound-driven inhibition, contributes to short-latency offset firing, a proposed mechanism for encoding sound termination (Kopp-Scheinpflug et al. 2011).
In LRN neurons we have demonstrated a potential role for Ih in sharpening the precision of the first spike latency following inhibition. Our in vitro data suggest that some Ih channels are open at the subthreshold membrane potential of spontaneous spiking, and that Ih conductance could be increased with modest hyperpolarisation to as little as −60 mV, for durations as short as 60 ms. During brief membrane hyperpolarisations, constitutively open Ih channels could be acting as a depolarising shunt that accelerates membrane depolarisation, enabling the cell to reach spike threshold more quickly and therefore with a less variable latency. The shortening and sharpening of the latency of the first post-hyperpolarisation spike seems most likely to be due to Ih, because both show a decreasing trend with increasing Isag amplitude. Furthermore, after longer durations of hyperpolarisation (in vitro; Fig. 8) and sensory-evoked pause in spiking (in vivo; Fig. 9), both of which might recruit further Ih, spiking resumes with greater precision. Therefore, while other intrinsic conductances and synaptic inputs may also contribute to resetting, we propose that Ih could contribute to the pause–reset response in LRN neurons observed in vivo, without which post-stimulus spiking becomes more variable (Fig. 4B). All four HCN channel mRNAs are expressed in the LRN at moderate to high levels (Monteggia et al. 2000; Santoro et al. 2000), making it difficult to say which HCN channel (or, more probably, which combination) mediate Ih. This role of Ih could be widely deployed in neural circuits where precisely timed post-inhibitory spikes that mark salient events are required. Overall, we hypothesise that sensory stimulation causes a pause in firing by evoking inhibition, and that this inhibition recruits Ih; however, we cannot rule out the possibility that other intrinsic conductances and synaptic inputs may also contribute to resetting and further work will be needed to definitively demonstrate this.
The concerted activity of SK and Ih may account for the temporal parameters that explain the in vivo firing responses of LRN neurons to stimuli (Fig. 4). By analogy with electronics, SK and Ih could be modelled as parallel capacitative and inductive elements, respectively, in an LC circuit with its own resonant frequency. SK current is capacitative-like, showing very fast activation followed by decay in the response to a DC voltage step. Ih current is inductive-like, slowly activating and remaining constitutively active in response to a DC voltage step; it can therefore act as a high-pass filter (Cangiano et al. 2007), behaving like an electronic inductor (Horowitz & Hill, 1989). In electronics, parallel LC circuits are used to generate or receive signals at particular frequencies. The concerted activity of SK and Ih in LRN neurons could thus form a harmonic resonator tuned to resonate at certain frequencies dependent on the relative sizes of the SK and Ih conductances. If the relative amplitudes of these two conductances can be altered (for example by intracellular messengers), then so can the resonance frequency. This would have implications for the responses of these neurons to rhythmic inputs.
A fundamental question in cerebellar function is how time is represented in the circuit. The results presented here suggest that the LRN can act as an independent timekeeper for the cerebellum, representing the timing of single sensory events. Our findings suggest that LRN neurons broadcast a representation of the relative timing of events to a wide region of the cerebellar cortex, which is available for a substantial time period, potentially hundreds of milliseconds.
Acknowledgments
This work was supported by the Elmore Fund of the University of Cambridge Clinical School (W.X.) and by NIH R01 NS040863-06 (S.A.E.).
Glossary
- ISI
interspike interval
- LRN
lateral reticular nucleus
- PSTH
peristimulus time histogram
Author contributions
Conception and design of the experiments: Figs 1–3, W.X. and S.A.E.; Fig 4, W.X.; Figs 5–7, W.X. and S.J.; Figs 8 and 9, S.J. and S.A.E. Collection and analysis of data: Figs 1–7, W.X.; Fig 8, S.J.; Fig 9, S.A.E. Interpretation of the data, drafting the article or revising it critically for important intellectual content: W.X., S.J. and S.A.E. All authors approved the final version.
References
- Aponte Y, Lien CC, Reisinger E, Jonas P. Hyperpolarization-activated cation channels in fast-spiking interneurons of rat hippocampus. J Physiol. 2006;574:229–243. doi: 10.1113/jphysiol.2005.104042. [DOI] [PMC free article] [PubMed] [Google Scholar]
- Arenz A, Bracey EF, Margrie TW. Sensory representations in cerebellar granule cells. Curr Opin Neurobiol. 2009;19:445–451. doi: 10.1016/j.conb.2009.07.003. [DOI] [PubMed] [Google Scholar]
- Arenz A, Silver RA, Schaefer AT, Margrie TW. The contribution of single synapses to sensory representation in vivo. Science. 2008;321:977–980. doi: 10.1126/science.1158391. [DOI] [PMC free article] [PubMed] [Google Scholar]
- Atherton JF, Bevan MD. Ionic mechanisms underlying autonomous action potential generation in the somata and dendrites of GABAergic substantia nigra pars reticulata neurons in vitro. J Neurosci. 2005;25:8272–8281. doi: 10.1523/JNEUROSCI.1475-05.2005. [DOI] [PMC free article] [PubMed] [Google Scholar]
- Bengtsson F, Jorntell H. Sensory transmission in cerebellar granule cells relies on similarly coded mossy fiber inputs. Proc Natl Acad Sci U S A. 2009;106:2389–2394. doi: 10.1073/pnas.0808428106. [DOI] [PMC free article] [PubMed] [Google Scholar]
- Biel M, Wahl-Schott C, Michalakis S, Zong X. Hyperpolarization-activated cation channels: from genes to function. Physiol Rev. 2009;89:847–885. doi: 10.1152/physrev.00029.2008. [DOI] [PubMed] [Google Scholar]
- Blackburn CC, Sachs MB. Classification of unit types in the anteroventral cochlear nucleus: PST histograms and regularity analysis. J Neurophysiol. 1989;62:1303–1329. doi: 10.1152/jn.1989.62.6.1303. [DOI] [PubMed] [Google Scholar]
- Bond CT, Maylie J, Adelman JP. SK channels in excitability, pacemaking and synaptic integration. Curr Opin Neurobiol. 2005;15:305–311. doi: 10.1016/j.conb.2005.05.001. [DOI] [PubMed] [Google Scholar]
- Cangiano L, Gargini C, Della Santina L, Demontis GC, Cervetto L. High-pass filtering of input signals by the Ih current in a non-spiking neuron, the retinal rod bipolar cell. PLoS One. 2007;2:e1327. doi: 10.1371/journal.pone.0001327. [DOI] [PMC free article] [PubMed] [Google Scholar]
- Courtemanche R, Lamarre Y. Local field potential oscillations in primate cerebellar cortex: synchronization with cerebral cortex during active and passive expectancy. J Neurophysiol. 2005;93:2039–2052. doi: 10.1152/jn.00080.2004. [DOI] [PubMed] [Google Scholar]
- D’Angelo E, Koekkoek SK, Lombardo P, Solinas S, Ros E, Garrido J, Schonewille M, De Zeeuw CI. Timing in the cerebellum: oscillations and resonance in the granular layer. Neuroscience. 2009;162:805–815. doi: 10.1016/j.neuroscience.2009.01.048. [DOI] [PubMed] [Google Scholar]
- Dean P, Porrill J, Ekerot CF, Jorntell H. The cerebellar microcircuit as an adaptive filter: experimental and computational evidence. Nat Rev Neurosci. 2009;11:30–43. doi: 10.1038/nrn2756. [DOI] [PubMed] [Google Scholar]
- Dugue GP, Brunel N, Hakim V, Schwartz E, Chat M, Levesque M, Courtemanche R, Lena C, Dieudonne S. Electrical coupling mediates tunable low-frequency oscillations and resonance in the cerebellar Golgi cell network. Neuron. 2009;61:126–139. doi: 10.1016/j.neuron.2008.11.028. [DOI] [PubMed] [Google Scholar]
- Ekerot CF. The lateral reticular nucleus in the cat. VI. Excitatory and inhibitory afferent paths. Exp Brain Res. 1990a;79:109–119. doi: 10.1007/BF00228879. [DOI] [PubMed] [Google Scholar]
- Ekerot CF. The lateral reticular nucleus in the cat. VIII. Excitatory and inhibitory projection from the bilateral ventral flexor reflex tract (bVFRT) Exp Brain Res. 1990b;79:129–137. doi: 10.1007/BF00228881. [DOI] [PubMed] [Google Scholar]
- Forti L, Cesana E, Mapelli J, D’Angelo E. Ionic mechanisms of autorhythmic firing in rat cerebellar Golgi cells. J Physiol. 2006;574:711–729. doi: 10.1113/jphysiol.2006.110858. [DOI] [PMC free article] [PubMed] [Google Scholar]
- Hartmann MJ, Bower JM. Oscillatory activity in the cerebellar hemispheres of unrestrained rats. J Neurophysiol. 1998;80:1598–1604. doi: 10.1152/jn.1998.80.3.1598. [DOI] [PubMed] [Google Scholar]
- Holtzman T, Rajapaksa T, Mostofi A, Edgley SA. Different responses of rat cerebellar Purkinje cells and Golgi cells evoked by widespread convergent sensory inputs. J Physiol. 2006;574:491–507. doi: 10.1113/jphysiol.2006.108282. [DOI] [PMC free article] [PubMed] [Google Scholar]
- Horowitz P, Hill W. The Art of Electronics. Cambridge University Press; 1989. [Google Scholar]
- Ito M. The Cerebellum and Neural Control. New York: Raven Press; 1984. [Google Scholar]
- Ivry R, Keele S. Timing functions of the cerebellum. J Cogn Neurosci. 1989;1:136–152. doi: 10.1162/jocn.1989.1.2.136. [DOI] [PubMed] [Google Scholar]
- Johnston J, Forsythe ID, Kopp-Scheinpflug C. Going native: voltage-gated potassium channels controlling neuronal excitability. J Physiol. 2010;588:3187–3200. doi: 10.1113/jphysiol.2010.191973. [DOI] [PMC free article] [PubMed] [Google Scholar]
- Jorntell H, Ekerot CF. Properties of somatosensory synaptic integration in cerebellar granule cells in vivo. J Neurosci. 2006;26:11786–11797. doi: 10.1523/JNEUROSCI.2939-06.2006. [DOI] [PMC free article] [PubMed] [Google Scholar]
- Kawato M, Gomi H. A computational model of four regions of the cerebellum based on feedback-error learning. Biol Cybern. 1992;68:95–103. doi: 10.1007/BF00201431. [DOI] [PubMed] [Google Scholar]
- Kopp-Scheinpflug C, Tozer AJ, Robinson SW, Tempel BL, Hennig MH, Forsythe ID. The sound of silence: ionic mechanisms encoding sound termination. Neuron. 2011;71:911–925. doi: 10.1016/j.neuron.2011.06.028. [DOI] [PubMed] [Google Scholar]
- Maccaferri G, McBain CJ. The hyperpolarization-activated current (Ih) and its contribution to pacemaker activity in rat CA1 hippocampal stratum oriens-alveus interneurones. J Physiol. 1996;497:119–130. doi: 10.1113/jphysiol.1996.sp021754. [DOI] [PMC free article] [PubMed] [Google Scholar]
- McCormick DA, Pape HC. Properties of a hyperpolarization-activated cation current and its role in rhythmic oscillation in thalamic relay neurones. J Physiol. 1990;431:291–318. doi: 10.1113/jphysiol.1990.sp018331. [DOI] [PMC free article] [PubMed] [Google Scholar]
- Maex R, De Schutter E. Synchronization of golgi and granule cell firing in a detailed network model of the cerebellar granule cell layer. J Neurophysiol. 1998;80:2521–2537. doi: 10.1152/jn.1998.80.5.2521. [DOI] [PubMed] [Google Scholar]
- Maex R, Steuber V. The first second: models of short-term memory traces in the brain. Neural Netw. 2009;22:1105–1112. doi: 10.1016/j.neunet.2009.07.022. [DOI] [PubMed] [Google Scholar]
- Marini G, Wiesendanger M. Cortical and peripheral effects on single neurons of the lateral reticular nucleus in the monkey. J Comp Neurol. 1987;256:581–589. doi: 10.1002/cne.902560410. [DOI] [PubMed] [Google Scholar]
- Medina JF, Mauk MD. Computer simulation of cerebellar information processing. Nat Neurosci. 2000;3:1205–1211. doi: 10.1038/81486. [DOI] [PubMed] [Google Scholar]
- Miall RC, Weir DJ, Wolpert DM, Stein JF. Is the cerebellum a smith predictor. J Mot Behav. 1993;25:203–216. doi: 10.1080/00222895.1993.9942050. [DOI] [PubMed] [Google Scholar]
- Monteggia LM, Eisch AJ, Tang MD, Kaczmarek LK, Nestler EJ. Cloning and localization of the hyperpolarization-activated cyclic nucleotide-gated channel family in rat brain. Brain Res Mol Brain Res. 2000;81:129–139. doi: 10.1016/s0169-328x(00)00155-8. [DOI] [PubMed] [Google Scholar]
- Ohtsuka K, Noda H. Burst discharges of mossy fibers in the oculomotor vermis of macaque monkeys during saccadic eye movements. Neurosci Res. 1992;15:102–114. doi: 10.1016/0168-0102(92)90023-6. [DOI] [PubMed] [Google Scholar]
- Ohyama T, Nores WL, Murphy M, Mauk MD. What the cerebellum computes. Trends Neurosci. 2003;26:222–227. doi: 10.1016/S0166-2236(03)00054-7. [DOI] [PubMed] [Google Scholar]
- Pellerin JP, Lamarre Y. Local field potential oscillations in primate cerebellar cortex during voluntary movement. J Neurophysiol. 1997;78:3502–3507. doi: 10.1152/jn.1997.78.6.3502. [DOI] [PubMed] [Google Scholar]
- Prsa M, Dash S, Catz N, Dicke PW, Thier P. Characteristics of responses of Golgi cells and mossy fibers to eye saccades and saccadic adaptation recorded from the posterior vermis of the cerebellum. J Neurosci. 2009;29:250–262. doi: 10.1523/JNEUROSCI.4791-08.2009. [DOI] [PMC free article] [PubMed] [Google Scholar]
- Rancz EA, Ishikawa T, Duguid I, Chadderton P, Mahon S, Hausser M. High-fidelity transmission of sensory information by single cerebellar mossy fibre boutons. Nature. 2007;450:1245–1248. doi: 10.1038/nature05995. [DOI] [PMC free article] [PubMed] [Google Scholar]
- Rosen I, Scheid P. Patterns of afferent input to the lateral reticular nucleus of the cat. Exp Brain Res. 1973;18:242–255. doi: 10.1007/BF00234595. [DOI] [PubMed] [Google Scholar]
- Santoro B, Chen S, Luthi A, Pavlidis P, Shumyatsky GP, Tibbs GR, Siegelbaum SA. Molecular and functional heterogeneity of hyperpolarization-activated pacemaker channels in the mouse CNS. J Neurosci. 2000;20:5264–5275. doi: 10.1523/JNEUROSCI.20-14-05264.2000. [DOI] [PMC free article] [PubMed] [Google Scholar]
- Solinas S, Forti L, Cesana E, Mapelli J, De Schutter E, D’Angelo E. Computational reconstruction of pacemaking and intrinsic electroresponsiveness in cerebellar Golgi cells. Front Cell Neurosci. 2007;1:2. doi: 10.3389/neuro.03.002.2007. [DOI] [PMC free article] [PubMed] [Google Scholar]
- Solinas S, Nieus T, D’Angelo E. A realistic large-scale model of the cerebellum granular layer predicts circuit spatio-temporal filtering properties. Front Cell Neurosci. 2010;4:12. doi: 10.3389/fncel.2010.00012. [DOI] [PMC free article] [PubMed] [Google Scholar]
- Stocker M, Krause M, Pedarzani P. An apamin-sensitive Ca2+-activated K+ current in hippocampal pyramidal neurons. Proc Natl Acad Sci U S A. 1999;96:4662–4667. doi: 10.1073/pnas.96.8.4662. [DOI] [PMC free article] [PubMed] [Google Scholar]
- Swadlow HA. Antidromic activation: measuring the refractory period at the site of axonal stimulation. Exp Neurol. 1982;75:514–519. doi: 10.1016/0014-4886(82)90179-0. [DOI] [PubMed] [Google Scholar]
- Valle MS, Garifoli A, Maci T, Perciavalle V. Reticulocerebellar projections to the anterior and posterior lobes of the rat cerebellum. Neurosci Lett. 2001;314:41–44. doi: 10.1016/s0304-3940(01)02278-9. [DOI] [PubMed] [Google Scholar]
- van Kan PL, Gibson AR, Houk JC. Movement-related inputs to intermediate cerebellum of the monkey. J Neurophysiol. 1993;69:74–94. doi: 10.1152/jn.1993.69.1.74. [DOI] [PubMed] [Google Scholar]
- Vos BP, Volny-Luraghi A, De Schutter E. Cerebellar Golgi cells in the rat: receptive fields and timing of responses to facial stimulation. Eur J Neurosci. 1999;11:2621–2634. doi: 10.1046/j.1460-9568.1999.00678.x. [DOI] [PubMed] [Google Scholar]
- Walter JT, Alvina K, Womack MD, Chevez C, Khodakhah K. Decreases in the precision of Purkinje cell pacemaking cause cerebellar dysfunction and ataxia. Nat Neurosci. 2006;9:389–397. doi: 10.1038/nn1648. [DOI] [PubMed] [Google Scholar]
- Wolpert DM, Miall CR, Kawato M. Internal models in the cerebellum. Trends Cogn Sci. 1998;2:338–347. doi: 10.1016/s1364-6613(98)01221-2. [DOI] [PubMed] [Google Scholar]
- Wu HS, Sugihara I, Shinoda Y. Projection patterns of single mossy fibers originating from the lateral reticular nucleus in the rat cerebellar cortex and nuclei. J Comp Neurol. 1999;411:97–118. doi: 10.1002/(sici)1096-9861(19990816)411:1<97::aid-cne8>3.0.co;2-o. [DOI] [PubMed] [Google Scholar]
- Xu W, Edgley SA. Cerebellar Golgi cells in the rat receive convergent peripheral inputs via a lateral reticular nucleus relay. Eur J Neurosci. 2010;32:591–597. doi: 10.1111/j.1460-9568.2010.07307.x. [DOI] [PMC free article] [PubMed] [Google Scholar]
- Yamazaki T, Tanaka S. Neural modeling of an internal clock. Neural Comput. 2005;17:1032–1058. doi: 10.1162/0899766053491850. [DOI] [PubMed] [Google Scholar]