

Abstract
Within the core molecular clock, protein phosphorylation and degradation play a vital role in determining circadian period. The ‘after-hours’ (Afh) mutation in mouse slows the degradation of the core clock protein Cryptochrome, lengthening the period of the molecular clock in the suprachiasmatic nuclei (SCN) and behavioural wheel-running rhythms. However, we do not yet know how the Afh mutation affects other aspects of physiology or the activity of circadian oscillators in other brain regions. Here we report that daily rhythms of metabolism and ingestive behaviours are altered in these animals, as are PERIOD2::LUCIFERASE (PER2::LUC) rhythms in mediobasal hypothalamic nuclei, which influence these behaviours. Overall there is a trend towards period lengthening and a decrease in amplitude of PER2::LUC rhythms throughout the brain. Imaging of single cells from the arcuate and dorsomedial hypothalamic nuclei revealed this reduction in tissue oscillator amplitude to be due to a decrease in the amplitude, rather than a desynchrony, of single cells. Consistent with existing models of oscillator function, this cellular phenotype was associated with a greater susceptibility to phase-shifting stimuli in vivo and in vitro, with light evoking high-amplitude Type 0 resetting in Afh mutant mice. Together, these findings reveal unexpected consequences of the Afh mutation on the amplitude and synchrony of individual cellular oscillators in the SCN.
Key points
The master circadian clock in the brain's suprachiasmatic nuclei provides daily timing cues for other circadian oscillators in the brain and body, and is itself synchronised to the external world through recurring changes in environmental light levels.
Here we show that in addition to lengthening circadian period, the after-hours (Afh) mutation alters daily rhythms in metabolism, and reduces the amplitude of oscillations in circadian timekeepers in the brain and periphery. Such suppression in circadian oscillation could be visualised in single brain cells. Intriguingly, the Afh mutation greatly enhanced resetting of the circadian system to stimuli such as environmental light.
Collectively the results indicate unusual consequences of the Afh mutation, from single cells to whole animal physiology and behaviour.
Introduction
Circadian clocks are biological pacemakers that drive daily rhythms in physiology and behaviour, such as sleep, metabolism, core body temperature and hormone secretion (Piggins & Guilding, 2011). In mammals, the master circadian clock is housed within the suprachiasmatic nuclei (SCN) of the hypothalamus. However, semi-autonomous circadian clocks have been demonstrated in multiple cell types and tissues outside of the SCN (Balsalobre et al. 1998; Yamazaki et al. 2000; Abe et al. 2002; Guilding & Piggins, 2007). Using brain tissues from PER2 reporter mice (PERIOD2::LUCIFERASE (PER2::LUC); Yoo et al. 2004), we have demonstrated that circadian rhythms are detectable in a number of extra-SCN brain sites. Notably, these include hypothalamic structures involved in feeding behaviour and metabolic control, such as the dorsomedial hypothalamus (DMH), arcuate nucleus (Arc) and median eminence (ME), as well as the pars tuberalis (PT) of the pituitary gland (PIT) and the habenula (Hb) of the epithalamus (Guilding et al. 2009, 2010). Therefore, it is now clear that a network of clocks located across the brain and body orchestrates circadian rhythms in behaviour and physiology.
The molecular clockwork that underlies circadian rhythmicity involves interlocking transcriptional and translational feedback loops centred upon the reciprocal interaction of transcriptional activators CLOCK and Brain and Muscle ARNT-Like 1 (BMAL1), and repressors PERIOD (PER) and CRYPTOCHROME (CRY; Ko & Takahashi, 2006). This central feedback loop is acted upon by a number of secondary and tertiary loops that stabilise its oscillation. Critically, fine-tuning of clock speed arises from phosphorylation and ubiquitination of clock proteins so that each cycle typically takes ∼24 h, and mutations that influence post-translational modification of these proteins alter clock speed in both humans and animals (Meng et al. 2008; Lee et al. 2011).
Behavioural screening of mutagenised mice recently identified two mouse lines in which circadian periods were significantly lengthened compared with control +/+ mice; subsequently named ‘after-hours’ (Afh; Godinho et al. 2007) and ‘overtime’ (Siepka et al. 2007) mutants. Both mutations were mapped to the Fbxl3 gene, a member of the F-box family that regulates protein ubiquitination and degradation and, although different, both mutations were found to disrupt the interaction of FBXL3 with CRY (Busino et al. 2007; Siepka et al. 2007). The ensuing reduction in the degradation of CRY prolongs the repressive effects of CRY on the molecular clock, thereby lengthening the period of each cycle. Initial characterisation of the Afh mice revealed a profound lengthening of circadian period in behavioural wheel-running activity, as well as PER2::LUC rhythms in SCN, kidney, lung and liver tissue slices in vitro. In addition to an increased period length, the amplitude of PER2 rhythms is significantly reduced in tissue derived from these animals (Godinho et al. 2007).
In the current study, we further characterise the physiological impact of the Afh mutation. We demonstrate that rhythms in metabolic rate and feeding behaviour are both dampened and phase-delayed in mutant mice compared with control +/+ littermates. Consistent with altered metabolic rhythms, the Afh mutation lowers the amplitude of single-cell oscillations in the SCN as well as structures of the mediobasal hypothalamus (MBH) and the PIT. Importantly, we also show that the Afh mutation results in high-amplitude phase-resetting of the circadian system, evident in both isolated tissue cultures in vitro as well as wheel-running in vivo responses to nocturnal light pulses. Collectively, this study establishes that the Afh mutation has widespread effects on the circadian system, and has important implications for patients with disrupted circadian rhythmicity, such as that observed in delayed sleep phase syndrome.
Methods
Ethical approval
All experiments were performed in accordance with the UK Animals (Scientific Procedures) Act of 1986 using procedures approved by The University of Manchester Review Ethics Panel.
Animals
The University of Manchester colony of Afh mice was derived from three breeding pairs of homozygous male (Fblx3Afh/Afh; referred to in this study as Afh/Afh mice) × heterozygous female (Fblx3Afh/+; referred to in this study as Afh/+ mice) animals provided by Dr Michael Hastings, MRC Laboratory of Molecular Biology, Cambridge, UK. This strain was originally generated by Prof. Pat Nolan at the Mammalian Genetics Unit, MRC Harwell, Oxfordshire, UK (see Godinho et al. 2007 for full description). All original breeding stock had been backcrossed for 9–10 generations on the mPer2Luc homozygous mouse (Yoo et al. 2004). Prior to study, mice were group housed and maintained with ad libitum access to food and water under a 12 h light/12 h dark (LD) cycle (where Zeitgeber time (ZT) 0 designates lights-on and ZT12 indicates lights-off). In constant lighting conditions circadian time (CT) 12 is defined as the onset of behavioural activity. Ambient temperature was maintained at 20–22°C and humidity at ∼40%. The light intensity in the breeding colony was ∼44 μW cm−2. Mice were genotyped using an allelic discrimination assay as previously described (Godinho et al. 2007). Experiments were conducted on age- and sex-matched adult mice, using congenic Fblx3+/+ littermates, referred to in this study as +/+ controls.
Behavioural analysis
Wheel-running behaviour
To assess wheel-running behaviour in LD and constant darkness (DD), male and female control (+/+; n= 14), heterozygous (Afh/+; n= 8) and homozygous mutant (Afh/Afh; n= 12) mice were individually housed in cages equipped with a stainless-steel running wheel (160 mm diameter) under a 12 h:12 h LD cycle for a minimum of 14 days then released into DD for at least 14 days. The intensity of light during lights-on was ∼56 μW cm−2. Wheel-running data were monitored throughout the experiment and recorded in 10 min time bins using the Chronobiology Kit (Stanford Software Systems, Santa Cruz, CA, USA).
Drinking rhythms
Water intake was measured using the Labmaster system (TSE systems, Bad Homburg, Germany). The Labmaster system consists of a chamber (425 × 265 × 150 mm) that incorporates sensitive sensors for online measurement of water consumption. Mice (+/+, n= 5; Afh/+, n= 5, Afh/Afh, n= 6) were acclimatised to the cages for at least 4 days prior to recordings, following which drinking rhythms were monitored for at least 14 days in LD and a further 14 days in DD. Standard chow and tap water were supplied ad libitum throughout the experiments. Water intake over time was recorded continuously and exported into Microsoft Excel in 30 min time bins.
Metabolic experiments
Indirect calorimetry
The metabolic rate of +/+ (n= 9) and Afh/Afh (n= 11) mice was assessed via indirect calorimetry, using a Comprehensive Lab Animal Monitoring System (CLAMS; Columbus Instruments, Columbus, OH, USA). Animals were individually housed in calorimetric cages and oxygen consumption (VO2) measured every 10 min for 7 days, under a 12 h:12 h LD photoperiod. Standard rodent chow and water were available ad libitum throughout experiments. Activity at the food hopper was assessed using an infrared laser beam across the opening of the hopper. The number of beam breaks (≥1 s duration) was recorded in 10 min time bins.
Phase–response curve to light
To determine whether phase shifting to an external stimulus was altered by the Afh mutation, we examined the phase-resetting effect of light pulses given to +/+ (n= 8) and Afh/Afh (n= 8) mice free-running in DD. Initially, mice were individually housed in running wheel (80 mm diameter)-equipped cages under a 12 h:12 h LD cycle for 1 week then released into DD to free-run for 10 days prior to the start of the phase-shift experiment. Mice were presented with a series (n= 3) of light pulses (∼60 μW cm−2) approximately every 2 weeks at a range of times across the circadian cycle. CT was calculated from the free-running period of each individual mouse. Because the free-running period and hence the time of one circadian day differed between +/+ and Afh/Afh mice (average period in first epoch of DD: +/+ 23.6 ± 0.07 h; Afh/Afh 25.7 ± 0.12 h), the times and lengths of the light pulses were adjusted accordingly to cover the same proportion of the circadian cycle. Consequently all light pulses given to +/+ animals were 6 h in length, and all light pulses given to Afh/Afh mice were 6.5 h. This length of stimuli was chosen in accordance with similar studies in mice on a C57/BL6 background (Vitaterna et al. 2006) to produce consistent, effective phase shifts. Care was taken not to pulse mice in the same portion of the circadian cycle more than once. Light pulses were delivered through timed programming of an LED Light-Controlled Ventilated Cabinet (Tecniplast, Buguggiate, Italy).
PER2::LUC bioluminescence experiments
Culture preparation
Mice were culled by cervical dislocation following isoflurane anaesthesia (Abbott Laboratories, Kent, UK). All cultures were prepared from animals that had been behaviourally screened and were free-running in DD. Animal handling and brain extraction were conducted with the aid of night vision goggles to prevent exposure of animals to visible light. For luminometric assessment on photomultiplier tube (PMT) assemblies (see below), SCN, arcuate complex (Arc complex: Arc, ME, PT), DMH and Hb were microdissected and cultured as 250 μm coronal sections, as previously described (Guilding et al. 2009, 2010). Pituitaries were dissected by hand and cultured whole under identical conditions. For bioluminescence imaging experiments, coronal SCN and/or MBH explants containing DMH, ventromedial hypothalamus, Arc, ME and PT were dissected and cultured at 37°C as previously described (Guilding et al. 2009).
Luminometry
Total bioluminescence was recorded from individual brain slice cultures for up to 7 days with PMT assemblies (H8259/R7518P; Hamamatsu, Welwyn Garden City, UK) housed in a light-tight incubator (Galaxy R+; RS Biotech, Irvine, UK) maintained at 37°C. Photon counts were integrated for 299 s every 300 s. All bioluminescence data were detrended by subtracting a 24 h running average from the raw data and smoothed with a 3 h running average.
Bioluminescence imaging
Bioluminescence emission from SCN or MBH cultures maintained at 37°C was imaged with a self-contained Olympus LV200 luminescence microscopy system fitted with a cooled Hamamatsu C9100-13 EM-CCD camera (Olympus, Japan), as previously described (Guilding et al. 2009, 2010). Individual regions of interest and single cells were delineated using ImageJ software (version 1.37a; NIH, USA).
Data analysis and statistics
Wheel-running behaviour
Analysis of locomotor activity under LD conditions was carried out on the final 10 days of LD. Data recorded under DD conditions were analysed on successive 10 day epochs immediately following the LD cycle (DD1-10 and DD10−20). Period and rhythm strength of wheel-running rhythms were calculated using χ2 periodogram analysis in the Analyse9 software package (Stanford Software Systems). Rhythm strength was expressed as percentage of variance (%V) explained by the dominant component of the rhythm; %V is derived from the power of the χ2 periodogram peak (%V=Qp× 100/n, where Qp is the power of the rhythm and n is the number of time bins included in the periodogram analysis). Rhythm strength in DD10−20 was also calculated relative to DD1-10 to determine whether this deteriorated more quickly under DD in Afh/Afh than in +/+ animals. Time of activity onset on the final day in LD and subsequent phase shift on transfer to DD were determined manually using eye-fit regression lines. Wheel revolution counts were exported into Microscoft Excel in 10 min time bins to calculate average locomotor activity (wheel revolutions h−1) and percentage total activity observed in the dark phase (under LD). The ZT of peak activity was estimated for each individual mouse using 24 h mean activity profiles, normalised such that the peak was equal to one and the nadir equal to zero. Wheel-running data were further outputted to El Temps analysis software (Dr A. Díez-Noguera, Barcelona, Spain) to determine the duration of the main active phase (alpha) and percentage of activity during alpha. Alpha was determined using an average waveform, and points where activity crossed the mean activity level were defined as onset and offset. All measurements were performed blind to genotype. Comparisons between genotypes were carried out using one-way ANOVA with Tukey's post hoc test (SYSTAT version 10, Chicago, IL, USA; P < 0.05 required for statistical significance).
Drinking rhythms
Total water intake (ml per day) and percentage drinking activity during the dark phase (in LD) were calculated in Microsoft Excel. Water consumption (30 min time bins) was outputted to El Temps, and actograms plotted of individual drinking rhythms. Period and %V were determined by χ2 periodogram analysis (Sokolove & Bushell, 1978) for the final 10 days in LD and on the first 14 days in DD. Alpha duration and percentage activity during alpha were determined using average waveform analysis, as described for wheel-running data. Statistical differences between genotypes were assessed with one-way ANOVA and Tukey post hoc test (SYSTAT; P < 0.05 required for statistical significance).
Analysis of metabolic rhythms
Data for O2 consumption and food hopper visits were analysed in Matlab (Mathworks, MA, USA) using custom-written scripts (Bechtold et al. 2008). Diurnal rhythmicity was assessed by χ2 analysis (Sokolove & Bushell, 1978), with significance set at P < 0.001. Timing of peak activity and peak−trough amplitudes were computed from 24 h means of O2 consumption and food hopper visits for each individual (over 7 days under LD). Comparisons of these parameters between genotypes were by unpaired t test with significance set at P < 0.05. Data are presented as mean ± SEM. For direct comparison of daily activity profiles between genotypes, 24 h means for each individual were first normalised to lie between 1 and 0. Data were averaged according to genotype and the resulting means renormalised.
Phase shifts to light
Behavioural phase shifts were measured using eye-fit regression lines on 7 days of activity before and after a pulse, discounting transient cycles following a shift. Time of activity onset (CT12) on the day of the pulse was calculated from a line eye-fit through times of activity onset for the 7 days before the light pulse. Period estimates were calculated using the same 7 day period. The CT at the start of each light pulse was calculated from the CT12 and period. A second line of best fit was fitted through the activity onsets for the 7 days following the light pulse (actograms were plotted to depict circadian days depending on the stable free-running period of individual animals). The time difference between the two extrapolated lines on the day of the pulse was the magnitude of the phase shift. This value was corrected for each individual animal's circadian period, estimated before the light pulse. Phase shift direction and magnitude were assessed by three experienced researchers blind to genotype and time of pulse. The means of these rated shifts were subsequently plotted against the CT at the start of the pulse to give the phase–response curve. To highlight any differences between genotypes in phase-resetting, data were also plotted as a phase–transition curve (Johnson, 1999; Johnson et al. 2003). Here, the ‘new phase’ post-light pulse is plotted against the CT of the light pulse (old phase); hence, if a light pulse was applied at CT14 and this resulted in a 2 h phase-delay, the new phase would be CT12. The slope of this graph provides an indication of how sensitive a system is to perturbations. If the circadian system is resilient to the perturbation of a light pulse, there will be little difference between the old and new phase, and the slope of the graph will be 1, indicating a Type 1 phase-resetting. Conversely, if the circadian system is highly sensitive to being reset by light, the new phase will be related to the time of the light pulse rather than the old phase, and the slope of the graph will be 0 (Winfree, 2001).
Bioluminescence
Molecular rhythms were analysed using curve-fitting software (Clockwise, developed in-house by Dr T. Brown), and all data analysis was carried out essentially as described previously (Bechtold et al. 2008; Guilding et al. 2009, 2010). Bioluminescence data from the PMTs were detrended by subtracting a 24 h running average from the raw data and smoothed using a 3 h running average. Amplitude was manually measured by two experienced, independent researchers based on the peak-to-trough difference 24–48 h after culture. PMT bioluminescence recordings from +/+, Afh/+ and Afh/Afh groups were analysed by ANOVA with Tukey post hoc test using SYSTAT. Videomicroscopy bioluminescence recordings were analysed by unpaired t tests. The proportion of rhythmic cells between +/+ and Afh/Afh groups was tested using χ2 with Yate's correction, while cellular synchrony was assessed and visualised using Rayleigh analysis (custom software designed in-house by Dr T. Brown and El Temps). In all tests a P-value of <0.05 was considered statistically significant.
Results
Wheel-running activity in +/+, Afh/+ and Afh/Afh mice
In +/+ and Afh/+ mice, wheel-running behaviour was closely synchronised to a 12 h:12 h LD cycle in all individuals, with activity largely confined to the dark period and peaking ∼2 h after lights off (Fig. 1; Table 1). In contrast, entrainment of Afh/Afh mutant mice to the LD cycle was variable, with individual animals ranging from those having strong diurnal rhythms to being completely arrhythmic. In total only 8 of the 12 mutant animals showed statistically significant (P < 0.001, χ2 periodogram) 24 h rhythms in wheel-running activity, and rhythm strength (%V) in these animals was significantly reduced compared with +/+ littermates. Interestingly, when we combined the data from these animals with those from later phase-shifting experiments (see below), we identified a negative correlation between %V in LD and period in DD1 (n= 16; P= 0.008) in Afh/Afh mice.
Figure 1. Behavioural characterisation of wheel-running behaviour in +/+, Afh/+ and Afh/Afh mice.

Double-plotted actograms (A) and χ2 periodograms (B) showing wheel-running rhythms of individual +/+, Afh/+ and Afh/Afh mice under LD and DD conditions. C, double-plotted 24 h wheel-running activity profiles in +/+, Afh/+ and Afh/Afh animals, normalised to lie between 0 and 1. The mean values for each genotype have been renormalised and smoothed (3 h running average). The shaded areas in A–C indicate epochs of darkness.
Table 1.
Summary data of wheel-running analysis of +/+, Afh/+ and Afh/Afh mice
| +/+ | Afh/+ | Afh/Afh | Significance | |
|---|---|---|---|---|
| LD | ||||
| N | 14 | 8 | 12 (8 rhythmic) | |
| Period (h) | 23.97 ± 0.02 | 23.99 ± 0.02 | 25.30 ± 0.89 | n.s. |
| Strength of rhythm (%V) | 48.73 ± 3.47 | 59.32 ± 7.38 | 32.82 ± 6.00* | P= 0.025 |
| Locomotor activity (Wheel revs h−1) | 674.66 ± 65.92 | 829.95 ± 183.60 | 702.34 ± 115.14 | n.s. |
| Percentage of activity in dark phase | 91.82 ± 2.02 | 89.94 ± 3.65 | 76.82 ± 5.64* | P= 0.042 |
| ZT of nocturnal activity peak | 13.99 ± 0.56 | 13.89 ± 0.52 | 17.50 ± 1.51* | P= 0.019 |
| DD1 | ||||
| N | 14 | 8 | 12 | |
| Period (h) | 23.74 ± 0.06 | 24.11 ± 0.08 | 26.62 ± 0.19* | P= 0.0001 |
| Strength of rhythm (%V) | 45.79 ± 3.08 | 44.31 ± 4.40 | 39.41 ± 2.78 | n.s. |
| Locomotor activity (Wheel revs h−1) | 714.99 ± 70.63 | 773.71 ± 197.38 | 784.59 ± 85.48 | n.s. |
| Phase shift on transfer to DD (min) | 43.94 ± 8.77 | 4.80 ± 17.64 | −202.95 ± 46.86* | P= 0.0001 |
| Alpha duration (h) | 12.67 ± 0.74 | 14.94 ± 1.08 | 15.54 ± 0.60 | P= 0.017 |
| Alpha duration as a percentage DD1-10 period | 53.38 ± 3.04 | 61.85 ± 4.52 | 58.44 ± 0.60 | n.s. |
| Percentage of activity in alpha in DD1-10 | 90.55 ± 1.55 | 95.32 ± 0.69 | 89.25 ± 2.19 | n.s. |
| DD2 | ||||
| N | 14 | 6 | 8 | |
| Period DD (h) | 23.79 ± 0.12 | 24.30 ± 0.14 | 26.36 ± 0.16* | P= 0.0001 |
| Strength of rhythm in DD10−20 (%V) | 38.83 ± 4.82 | 40.00 ± 5.94 | 37.33 ± 3.16 | n.s. |
| Rel. change in %V (DD10−20 :DD1-10) | −0.16 ± 0.07 | −0.13 ± 0.07 | −0.07 ± 0.10 | n.s. |
Wheel-running parameters of rhythmic mice measured in LD, DD1-10 and DD10−20. %V= percentage of variance explained by the dominant component of the rhythm; rev h−1= revolutions per hour; alpha = consolidated active phase. Values are expressed as mean ± SEM. Bold underlined values are statistically different from +/+ mice. *Indicates statistically significant differences between Afh/+ and Afh/Afh groups (one-way ANOVA followed by Tukey post hoc analyses; P < 0.05; significance column shows results of ANOVA). DD, constant darkness; LD, light/dark; ZT, Zeitgeber time.
The percentage of total activity observed during the dark phase was also reduced in Afh/Afh mutants, and the peak of the activity rhythm was delayed by ∼3.5 h relative to that of +/+ or Afh/+ littermates.
On transfer to DD, the three genotypes differed significantly in the magnitude of phase shift relative to the previous LD cycle. The phase of activity onset upon release to DD was advanced by 44 ± 9 min in +/+ mice and by 5 ± 18 min in Afh/+ animals Conversely, the onset of activity on the first cycle in DD was delayed by over 3 h (203 ± 47 min) in Afh/Afh mutants. During the first 10 days in DD (DD1-10), all +/+ mice free-ran robustly with a mean period of 23.74 ± 0.06 h and rhythm strength (%V) of 45.79 ± 3.08%. The mean period in heterozygote animals was slightly longer than this (24.11 ± 0.08 h), and this was further increased in Afh/Afh mutants to 26.62 ± 0.19 h (individual animals ranged from 25.58 to 27.66 h). The duration of this active phase was significantly longer in Afh/Afh mice than in +/+ littermates, in parallel with the increase in overall period (P < 0.05; Table 1). In contrast with LD conditions, all Afh/Afh animals were rhythmic in DD, and %V in Afh/+ and Afh/Afh mice was only slightly reduced compared with that of congenic +/+ controls. Differences in period between +/+, Afh/+ and Afh/Afh animals were maintained in DD10−20, and rhythm strength deteriorated to a similar extent in all three genotypes (Table 1; %V DD10−20: DD1-10; P > 0.05). These inter-genotype differences were maintained in individual +/+, Afh/+ and Afh/Afh mice that free-ran with a single dominant period in behaviour for up to 10 weeks in DD (data not shown).
Drinking rhythms
To determine whether behavioural lengthening in Afh/Afh mutant animals was also maintained in the absence of a running wheel, drinking rhythms were monitored continuously under LD and DD conditions. Like wheel-running activity, drinking behaviour in all three genotypes followed a characteristic diurnal pattern (Fig. 2A), with water intake peaking ∼2 h after dark onset. Rhythm strength was again significantly reduced in Afh/Afh mice compared with +/+ littermates (%V Afh/Afh: 23.10 ± 2.44; +/+: 45.40 ± 6.52; P= 0.014), although entrainment to the LD cycle varied less between individuals than in wheel-running studies and all Afh/Afh mice (n= 5) were rhythmic (Fig. 2B; Table 2).
Figure 2. Drinking rhythms in +/+, Afh/+ and Afh/Afh mice.

Double-plotted actograms (A) and χ2 periodograms (B) of drinking rhythms in representative +/+, Afh/+ and Afh/Afh mice under LD and DD conditions. Shaded areas in A indicate epochs of darkness.
Table 2.
Summary of drinking parameters in +/+, Afh/+ and Afh/Afh mice
| +/+ | Afh/+ | Afh/Afh | Significance | |
|---|---|---|---|---|
| LD | ||||
| N | 5 | 4 | 5 | |
| Period (h) | 24.00 ± 0.07 | 24.19 ± 0.02 | 24.75 ± 0.60 | n.s. |
| Strength of rhythm (%V) | 45.40 ± 6.52 | 27.66 ± 3.98 | 23.10 ± 2.44 | P= 0.014 |
| Total water intake (ml day−1) | 5.54 ± 0.49 | 5.54 ± 0.44 | 4.77 ± 0.39 | n.s. |
| Percentage of drinking activity in dark phase | 74.44 ± 4.97 | 67.81 ± 4.50 | 62.80 ± 4.74 | n.s |
| DD | ||||
| N | 5 | 5 | 6 | |
| Period (h) | 23.85 ± 0.04 | 24.25 ± 0.13 | 25.67 ± 0.21* | P= 0.0001 |
| Strength of rhythm (%V) | 23.74 ± 4.44 | 18.80 ± 2.11 | 20.88 ± 2.25 | n.s. |
| Total water intake (ml day−1) | 5.92 ± 0.63 | 5.30 ± 0.69 | 5.35 ± 0.47 | n.s. |
| Alpha duration (h) | 9.45 ± 0.59 | 9.30 ± 0.70 | 11.78 ± 0.61* | P= 0.026 |
| Alpha duration as a percentage DD period | 39.62 ± 2.54 | 38.40 ± 3.08 | 45.80 ± 2.04 | n.s. |
| Percentage of drinking activity in alpha | 60.22 ± 2.54 | 54.52 ± 4.45 | 63.01 ± 1.98 | n.s. |
Parameters of drinking and water consumption of mice classified as rhythmic in LD and DD. %V= percentage of variance explained by the dominant component of the rhythm; alpha = main active phase. Values are expressed as mean ± SEM. Bold underlined values are statistically different from +/+ mice. *Indicates statistically significant differences between Afh/+ and Afh/Afh groups (one-way ANOVA followed by Tukey post hoc analyses; P < 0.05). -values refer to the first level of ANOVA. DD, constant darkness; LD, light/dark.
In DD, drinking rhythms free-ran with a circadian pattern similar to that of locomotor activity. The mean period was significantly longer in Afh/Afh mice than +/+ animals, and Afh/+ animals again displayed an intermediate phenotype (+/+ 23.85 ± 0.04 h; Afh/+ 24.25 ± 0.13 h; Afh/Afh 25.67 ± 0.21 h). As with wheel-running behaviour, alpha duration of the drinking rhythm was increased in mutant animals in proportion to the extension in circadian period, and no differences in the percentage of total drinking behaviour within alpha were identified between genotypes.
Metabolic activity rhythms
To further investigate the effects of the Fbxl3 mutation on feeding behaviour and metabolic rhythms, we assessed the metabolic rate of +/+ (n= 9) and Afh/Afh (n= 10) mice via indirect calorimetry. Oxygen consumption (VO2) in +/+ mice exhibited a clear diurnal rhythm (Fig. 3A and E), with χ2 periodogram analysis revealing the presence of a significant (P < 0.001) ∼24 h rhythm, which peaked at ZT13.5 (Table 3). VO2 rhythms were mirrored by rhythms in food hopper visits (Fig. 3B and F; Table 3).
Figure 3. Altered diurnal patterns of metabolic activity in Afh/Afh mutant mice.
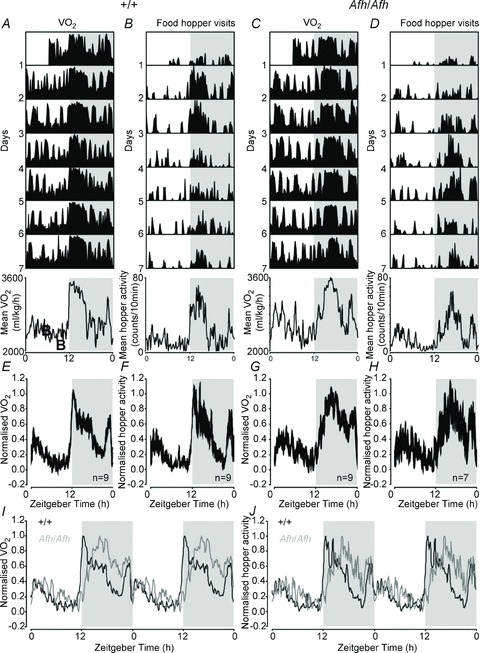
A–D, daily patterns of O2 consumption (A, C) and food hopper visits (B, D) in a +/+ (+/+; A, B) and Afh mutant mouse (Afh/Afh; C, D) housed under a 12 h:12 h LD cycle. The bottom panels show the mean daily activity profiles for those individuals. E–H, population averaged (mean ± SEM), normalised, 24 h profiles of O2 consumption (E, G) and food hopper visits (F, H) in +/+ (E, F) and Afh/Afh mice (G, H). I and J, double-plotted overlay of +/+ and Afh/Afh population profiles of O2 consumption (I) and food hopper visits (J). Shaded areas in A–J indicate epochs of darkness.
Table 3.
Comparison of daily oxygen consumption and food hopper visits between +/+ and Afh/Afh mice
| +/+ | Afh/Afh | Significance | |
|---|---|---|---|
| N | 9 | 10 | |
| O2 consumption | |||
| χ2 Periodogram | |||
| % Rhythmic | 100 | 90 | |
| Period (h) | 23.97 ± 0.04 | 24.11 ± 0.16 | n.s. |
| Rhythm strength (%V) | 33.19 ± 3.04 | 32.97 ± 2.77 | n.s. |
| 24 h average | |||
| ZT of peak (h) | 13.72 ± 0.57 | 16.57 ± 0.76 | P= 0.022 |
| Mean (ml kg−1 h−1) | 3053 ± 173 | 2760 ± 169 | n.s. |
| P-T amplitude (ml kg−1 h−1) | 2482 ± 254 | 2278 ± 290 | n.s. |
| Food hopper visits | |||
| χ2 Periodogram | |||
| % Rhythmic | 100 | 70 | |
| Period (h) | 23.95 ± 0.04 | 24.04 ± 0.13 | n.s. |
| Rhythm strength (%V) | 28.36 ± 2.78 | 29.04 ± 2.59 | n.s. |
| 24 h average | |||
| ZT of peak (h) | 14.21 ± 0.68 | 17.02 ± 1.01 | P= 0.016 |
| Mean (counts per 10 min) | 11.39 ± 1.69 | 11.7 ± 2.32 | n.s. |
| P-T amplitude (counts per 10 min) | 43.34 ± 7.74 | 40.2 ± 5.6 | n.s. |
Data are presented as mean ± SEM. Bold, underlined values indicate statistically significant differences between +/+ and Afh/Afh mice (unpaired t test; P < 0.05 required for significance). Only data from animals classified as rhythmic were used in the analysis of 24 h averages. ZT, Zeitgeber time.
All but one Afh/Afh mice also showed statistically significant (P < 0.001, χ2 periodogram) 24 h rhythms in VO2 (Fig. 3C and G; Table 3). However, by contrast with +/+ mice, peak O2 consumption in these mutant animals was shifted by ∼3 h to the mid-dark phase (Table 3; t test P < 0.05). There were no significant differences in the amplitude or overall level of day/night profiles of VO2 between mutant and +/+ mice. As with +/+ mice, daily profiles of food hopper activity of Afh/Afh mice largely paralleled changes in metabolic rate, with peak levels near the middle of the dark phase (Fig. 3D and G; Table 3). While we did not detect any clear difference in the amplitudes of these rhythms compared with +/+ animals, χ2 periodogram analysis revealed a significant rhythm (P < 0.001) in only 7 out of 10 of these Afh/Afh mice.
Phase-resetting to light
We investigated whether Afh/Afh mice are more susceptible to external resetting stimuli than +/+ mice in vivo by delivering a series of light pulses to mice free-running in DD and assessing resulting shifts in the phase of wheel-running activity. As expected, light pulses in the early subjective night resulted in phase-delays in wheel-running behaviour, while in the late night such pulses resulted in phase advances (Fig. 4A and B). A higher amplitude phase–response curve was seen in Afh/Afh mice than in +/+ controls. All shifts in +/+ animals were less than 5 h in magnitude, whereas ∼40% of those in Afh/Afh mutants were larger than 5 h (Fig. 4C and D; values were calculated in circadian hours to take into account the longer endogenous period of Afh/Afh animals). Interestingly, Afh/Afh mice exhibited a ‘breakpoint’ (Johnson, 1999) in response to light pulses at CT17–18, after which it was difficult to distinguish phase advances from phase-delays. This resulted in a period of overlap where phase shifts in either direction were observed, and it was therefore necessary to consider delays and advances separately during statistical analysis of genotypes differences. Phase-delays in response to CT12–18 pulsing were significantly larger in Afh/Afh mice than +/+ animals (+/+: 3.27 ± 0.24 h; Afh/Afh: 5.99 ± 1.29 h; P < 0.001). Similarly, phase advances in response to CT17–24 pulsing were significantly greater in Afh/Afh than +/+ mice (Afh/Afh: 4.60 ± 0.64 h; +/+: 1.15 ± 0.22 h; P < 0.05). When the phase shift data were plotted as a phase–transition curve, the +/+ data had an average slope of 1, indicating Type 1 resetting (Fig. 4E). In contrast, we observed Type 0 resetting in Afh/Afh mice (Fig. 4F). Rayleigh plots depicting the phase of the onset of activity rhythms in relation to the beginning of the 6 h light pulse demonstrate that Afh/Afh mice were reset by the light pulse, so that phase is significantly correlated with the time of pulse (P < 0.001, r= 0.527), whereas the phase in +/+ control mice was not (P > 0.5, r= 0.149; Fig. 4G and H).
Figure 4. Phase-shifting responses of circadian wheel-running rhythms to light in Afh/Afh and +/+ mice.

A and B, wheel-running activity records of representative Afh/Afh and +/+ mice given 6 h (CT) light pulses at a series (n= 3) of different circadian phases. A, data are double-plotted so that 2 days are represented on each horizontal line. To enable clear visualisation of phase-shifting effects in the Afh/Afh mouse (B), this plot reflects the stable free-running phase of this animal (∼26.5 h). Grey shading represents periods of darkness, and stars indicate the start of the light pulse. Phase–response curve to light pulses in +/+ (n= 8) (C) and Afh/Afh (n= 8) (D) mice. The x-axis is in circadian hours and the points plotted are the CT at the beginning of the light pulse. The y-axis is the shift in activity onset caused by the pulse. E, F, data from C, D replotted as phase–transition curves in response to light pulses in +/+ (E) and Afh/Afh (F) mice. The x-axis represents the CT of the light pulse and the y-axis represents the new phase (CT) of the slice extrapolated from the reset rhythm. G, H, Rayleigh plots depicting the phase of onset of activity rhythms (black circles) in relation to the time from the beginning of the 6 h light pulse. The direction of the arrow indicates the mean phase vector and its length shows significance relative to the significance threshold (P= 0.05) indicated by the inner broken circle. Boxes surrounding arrowheads show variance of phase between cultures. Afh/Afh mice are significantly reset by the light pulse, whereas +/+ mice are not (significant clustering of phases observed in Afh/Afh mice: Rayleigh test; P < 0.001).
Molecular rhythms in vitro
To investigate whether the enhanced phase-resetting effects of light are reflected in altered amplitude and function of the molecular clock, we assessed PER2::LUC activity in the SCN, and extra-SCN oscillators of the PIT, Arc complex, DMH and Hb (Guilding et al. 2009, 2010; Hughes et al. 2011). The Afh mutation significantly lengthened period in the SCN, PIT, Arc complex and DMH, in a gene dose-dependent manner (Fig. 5; Table 4). Period was also lengthened in the Hb, but this did not reach significance. A significant reduction in amplitude of PER2::LUC rhythms was observed in the SCN and PIT between +/+ and Afh/Afh mice, and between Afh/Afh and Afh/+ mice in the PIT (Fig. 5; Table 4). Subsequent treatment of cultures with 10 μm forskolin restored high-amplitude PER2::LUC rhythms in all tissues examined (data not shown). Because all cultures were prepared from rhythmic animals free-running in DD, this demonstrates that the observed changes in the molecular rhythms were not attributable to altered entrainment to the LD cycle.
Figure 5. PMT recordings of PER2::LUC expression in slice cultures from control (+/+), Afh/+ (+/−) and Afh/Afh (−/−) mice.

The left column shows representative detrended PER2::LUC bioluminescence rhythms from +/+ (black traces) and Afh/Afh (blue traces) in (A) suprachiasmatic nucleus (SCN), (B) pituitary (PIT), (C) arcuate (Arc) complex, (D) dorsomedial hypothalamus (DMH) and (E) habenula (Hb) over 7 days in culture. Inserts in B–E show expansion of the first 4 days in culture of tissues from Afh/Afh mice. Histograms in the middle and right columns show corresponding genotype measures (mean ± SEM) of the period and amplitude, respectively, of these rhythms for each tissue. Black colour boxes, +/+; light blue shaded boxes, Afh/+; dark blue shaded boxes, Afh/Afh. Inter-genotype differences in these measures as assessed by Tukey post hoc tests are indicated by the asterisks. *P < 0.05, **P < 0.01, ***P < 0.001.
Table 4.
Comparison of rhythms in PER2::LUC in +/+, Afh/+ and Afh/Afh mice from slice cultures recorded in PMTs
| N | % slices rhythmic | Period (h) | Amplitude (cpm) | |
|---|---|---|---|---|
| SCN | ||||
| +/+ | 24 | 100 | 24.04 ± 0.25 | 15076 ± 2512 |
| Afh/+ | 10 | 100 | 24.61 ± 0.37 | 7847 ± 3275 |
| Afh/Afh | 21 | 95.2 | 25.61 ± 0.27 | 7123 ± 1484 |
| PIT | ||||
| +/+ | 24 | 100 | 23.59 ± 0.17 | 20924 ± 3000 |
| Afh/+ | 13 | 84.6 | 24.68 ± 0.9 | 5995 ± 1992 |
| Afh/Afh | 15 | 93.3 | 26.63 ± 0.44* | 2311 ± 417* |
| Arc complex | ||||
| +/+ | 25 | 88 | 23.3 ± 0.35 | 830 ± 230 |
| Afh/+ | 14 | 71.4 | 24.3 ± 0.56 | 796 ± 246 |
| Afh/Afh | 21 | 52.4 | 24.9 ± 0.49 | 168 ± 37 |
| DMH | ||||
| +/+ | 25 | 84 | 23.13 ± 0.56 | 587 ± 127 |
| Afh/+ | 14 | 78.6 | 22.88 ± 0.74 | 629 ± 165 |
| Afh/Afh | 21 | 52.4 | 26.16 ± 0.91* | 229.9 ± 40 |
| Hb | ||||
| +/+ | 12 | 66.7 | 22.11 ± 0.10 | 514 ± 143 |
| Afh/+ | 5 | 80 | 23.91 ± 0.98 | 417 ± 117 |
| Afh/Afh | 14 | 50 | 24.68 ± 1.11 | 205 ± 103 |
Values are expressed as mean ± SEM. Bold underlined values are statistically different from +/+ mice. *Indicates statistically significant differences between Afh/+ and Afh/Afh groups. Arc, arcuate nucleus; DMH, dorsomedial hypothalamus; Hb, habenula; PIT, pituitary; SCN, suprachiasmatic nucleus.
We have shown above that Afh/Afh mice show alterations in phase-resetting in vivo in response to light pulses, and that the molecular oscillators in the SCN and PIT are significantly reduced in amplitude. We therefore hypothesised that the SCN and PIT oscillators are more susceptible to phase-resetting when cultured, a phenomena we have previously demonstrated in lower amplitude circadian oscillators (Guilding et al. 2009; Hughes et al. 2011). By preparing cultures at a range of times across the circadian cycle from animals free-running in DD conditions, we assessed whether the phase of PER2:LUC rhythms in culture reflected the in vivo CT phase or was reset by the culture procedure (i.e. peaked a set time after tissue collection). Rayleigh analysis of phase clustering between different slices showed that +/+ and Afh/+ SCN peak phase was significantly associated with CT (Fig. 6; +/+: P < 0.00001; Afh/+: P < 0.02) and not with time of cull (all P > 0.05); rhythms peaked at a mean phase of CT13.01 ± 0.7 and CT13.98 ± 1.36 respectively. Intriguingly, Afh/Afh SCN were reset by the culture procedure with PER2::LUC rhythms peaking consistently ∼32 h after cull (32.34 ± 1.4 h), regardless of the circadian phase of tissue preparation (Fig. 6). Similarly, +/+ and Afh/+ PIT phase was also significantly associated with CT phase (Fig. 6; +/+: P < 0.00001, CT 17.8 ± 1.2; Afh/+: P < 0.02, CT 23.67 ± 1.0) and not with time from cull (all P > 0.05), while the peak phase in mutants was consistently reset to ∼29 h after cull (P < 0.03, 28.6 ± 1.3 h).
Figure 6. Cultured suprachiasmatic nucleus (SCN) and pituitary (PIT) from +/+ mice maintain a phase consistently correlated with the animals circadian time (CT) in vivo, while Afh/Afh SCN and PIT are reset by the culture procedure.
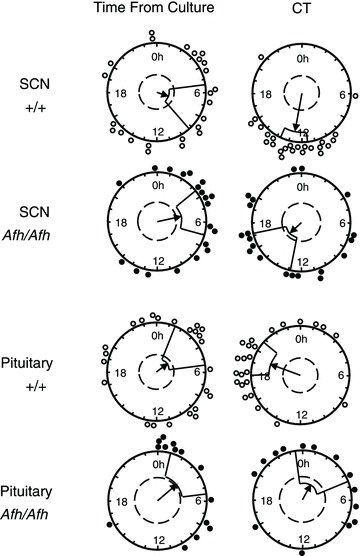
Rayleigh plots show peak PER2::LUC phase for +/+ and Afh/Afh SCN and PIT recorded in PMTs, plotted as either CT (based on behavioural rhythms in DD) or time of peak bioluminescence after culture preparation (time from culture). Circles (open: +/+; filled: Afh/Afh) indicate the phase of peak bioluminescence in individual cultures. Both SCN and PIT from +/+ mice express peak PER2::LUC bioluminescence at a consistent circadian phase, regardless of cull/culture time (peak phase is correlated with CT not with time from culture). However, Afh/Afh SCN and PIT always peak the same number of hours after culture preparation, showing these tissues to be reset by this process (peak phase correlated with time from culture not CT).
In contrast, the phase of peak PER2::LUC expression in the Arc complex and DMH from +/+ mice did not correlate with CT and instead were significantly associated with time from cull/culture preparation (Arc complex: P < 0.00001, peak 34.9 ± 0.74 h following cull; DMH: P < 0.02, peak 32.6 ± 1.3 h following cull). The phase of peak PER2::LUC expression in both tissues from Afh/+ and Afh/Afh mice did not correlate with either CT or time from cull (all P > 0.05). In addition, the peak phase in the Hb was not correlated with CT or time from culture in any genotype (all P > 0.05).
Bioluminescence imaging of molecular rhythms in the MBH and SCN
Arc complex cultures contain within them the Arc, ME, PT and the ependymal cell layer of the third ventricle (Epe), while DMH cultures contain DMH and the adjacent Epe. To further assess and differentiate the effects of the Afh mutation on these tissues, and on single cells within these tissues, we imaged coronal slices of the MBH using a highly sensitive EM-CCD luminescence imaging camera. In both +/+ and Afh/Afh mice we observed circadian rhythms in PER2::LUC expression in the Arc, DMH, ME/PT and the Epe. The Afh mutation significantly lengthened the period of PER2::LUC rhythms in all MBH regions examined (Fig. 7; Table 5). A proportionally greater increase in period length in Afh/Afh vs. +/+ mice was observed in the Arc and DMH than in the ME and Epe (Table 5), suggesting that different MBH regions are differentially sensitive to the Afh mutation. While the amplitude of rhythms showed a trend towards a decrease in all tissues from Afh/Afh mice, this only reached significance in the Arc (Fig. 7; Table 5). However, the rate of damping of rhythms was significantly faster in all MBH regions from Afh/Afh mice (Table 5).
Figure 7. Comparison of PER2::LUC rhythms in the MBH of +/+ and Afh/Afh mice.

A, EM-CCD image illustrating PER2::LUC bioluminescence in the dorsomedial hypothalamus (DMH), arcuate nucleus (Arc), median eminence (ME) and the ependymal cell layer of the 3rd ventricle (Epe), but not in the ventromedial hypothalamus (VMH). Calibration bar: 250 μm. B, histograms summarising period and amplitude differences of PER2::LUC rhythms for different tissues between +/+ and Afh/Afh mice. The Afh mutation results in a significant lengthening of period in all tissues, and a decrease in amplitude in the Arc; *P < 0.05 vs.+/+ in each tissue. The DMH and Arc have significantly shorter periods in +/+ mice than ME and Epe; †P < 0.05 (one-way ANOVA with Tukey post hoc tests); however, this difference is not present in Afh/Afh mice. C, plots of detrended PER2::LUC expression integrated across delineated Arc, DMH, Epe and ME from a representative +/+ and Afh/Afh MBH slice culture. The bottom two panels show representative single cells in the Arc and DMH.
Table 5.
Summary of circadian rhythms of PER2::LUC expression in hypothalamic tissues recorded using a bioluminescence imaging camera
| N | % slices rhythmic | Period (h) | % increase in period vs. +/+ | Amplitude | Rate of damping (days) | |
|---|---|---|---|---|---|---|
| Arc | ||||||
| +/+ | 10 | 100 | 21.4 ± 0.7 | 12.5 | 1413 ± 192 | 5.8 ± 0.56 |
| Afh/Afh | 11 | 82 | 24.0 ± 0.5** | 410 ± 186* | 2.5 ± 0.56*** | |
| DMH | ||||||
| +/+ | 10 | 100 | 21.2 ± 0.4 | 13.4 | 772 ± 185 | 5.7 ± 0.47 |
| Afh/Afh | 11 | 63.6 | 24.0 ± 1.0* | 416 ± 167 | 2.5 ± 0.70** | |
| ME | ||||||
| +/+ | 10 | 100 | 23.8 ± 0.4 | 9.1 | 2470 ± 1420 | 7.0 ± 0.43 |
| Afh/Afh | 10 | 70 | 26.0 ± 0.8* | 1061 ± 654 | 4.2 ± 0.8** | |
| Epe | ||||||
| +/+ | 10 | 100 | 23.5 ± 0.6 | 10.3 | 2090 ± 1364 | 6.6 ± 0.76 |
| Afh/Afh | 10 | 80 | 26.0 ± 0.8* | 354 ± 117 | 3.3 ± 0.67** | |
| SCN | ||||||
| +/+ | 5 | 100 | 23.7 ± 0.3 | 9.0 | 5447 ± 155 | n/a |
| Afh/Afh | 5 | 100 | 25.8 ± 1.4* | 3307 ± 964 | n/a | |
Values are expressed as mean ± SEM. *P < 0.05, **P < 0.01, ***P < 0.001 unpaired t test. Arc, arcuate nucleus; DMH, dorsomedial hypothalamus; Epe, ependymal cell layer of the 3rd ventricle; ME, median eminence; SCN, suprachiasmatic nucleus.
We assessed whether peak phase of PER2::LUC expression in the MBH of +/+ and Afh/Afh mice was associated with a particular CT phase or was reset by the culture procedure. Overall, both +/+ Arc and DMH peak phase was significantly associated with time of cull (both P < 0.00001, Rayleigh analysis; Fig. 8) and not CT; rhythms consistently peaked at ∼28 h after cull (Arc: 27.7 ± 0.5 h; DMH: 27.9 ± 0.7 h). Afh/Afh Arc and DMH peak phase did not significantly correlate with time of cull or CT (Fig. 8). Conversely, +/+ ME peak phase was significantly correlated with CT (CT peak 19.6 ± 1.2 h; P < 0.01; Fig. 8) and not with time from cull, while the phase of Afh/Afh ME was not consistently associated with either a particular circadian phase or time following cull. Peak phase in the Epe in both +/+ and Afh/Afh varied widely between individuals and was not consistently associated with either a particular circadian phase or duration of time following cull (Rayleigh associations with CT and cull all P > 0.05).
Figure 8. The phases of MBH tissues in vitro are differentially affected by the culture procedure and by the Afh/Afh mutation.

Rayleigh plots show peak PER2::LUC phase for +/+ and Afh/Afh MBH regions imaged on an EM-CCD camera, plotted as either circadian time (CT; based on behavioural rhythms in DD) or time of peak bioluminescence after culture preparation (time from culture). Circles (open: +/+; filled: Afh/Afh) indicate the phase of peak bioluminescence in MBH regions delineated from individual cultures. Arcuate nucleus (Arc) and dorsomedial hypothalamus (DMH) from +/+ mice are reset by the culture procedure, while the median eminence (ME)/pars tuberalis (PT) maintains a phase consistently correlated with CT. All regions from Afh/Afh mice are not correlated with either CT or time from culture. Ep, ependymal cell layer of the 3rd ventricle.
To determine whether the Afh mutation also influenced cellular oscillations of PER2::LUC in the MBH, single cells were discriminated in the Arc and DMH of +/+ and Afh/Afh mice (Fig. 7). In total 205 cells were visualised in the Arc from +/+ mice, 91.2% of which were rhythmic; and 125 cells were visualised in the Arc from mutant animals, 60% of which were rhythmic. In the DMH 142 cells were discriminated in slices from +/+ mice, 85.9% of which were rhythmic; and 125 cells were visualised in the DMH from mutant mice, 53.6% of which were rhythmic. There was a significant decrease in the proportion of rhythmic cells in Afh/Afh vs. +/+ slices in Arc and DMH (P < 0.0001, X-squared with Yate's correction).
The period of rhythms in single cells lengthened significantly in Afh/Afh vs.+/+ mice in both the Arc (+/+: 22.7 ± 0.19 h; Afh/Afh: 23.4 ± 0.29 h; P < 0.02, unpaired t test) and the DMH (+/+: 21.8 ± 0.2 h; Afh/Afh: 22.9 ± 0.2 h; P < 0.002). ‘R’-values from Rayleigh tests on the second day in culture indicated that there was no significant reduction in synchrony between single cells in Afh/Afh mice with respect to +/+, in either the Arc or DMH (Arc: +/+, r = 0.57 ± 0.04, Afh/Afh, r= 0.71 ± 0.06; DMH: +/+, r= 0.62 ± 0.09, Afh/Afh, r= 0.47 ± 0.18; all P > 0.05). While oscillating cells were detected in +/+ mice for up to the end of the recording cycle (at least 7 days), we could not assess synchrony of Afh/Afh cells at a later time point as we have done previously (Guilding et al. 2009), because after the third day in culture there were not consistently enough single cells oscillating to allow Rayleigh plots to be performed. This presumably stems from the significantly reduced amplitude of single-cell oscillations observed in Afh/Afh mice in both the Arc (+/+: 5231 ± 410; Afh/Afh: 1964 ± 260; P < 0.0001) and the DMH (+/+: 2963 ± 592; Afh/Afh: 1317 ± 184; P < 0.0001, unpaired t test).
Consistent with imaging experiments in the MBH, period was significantly lengthened in the SCN of Afh/Afh vs.+/+ mice, and there was a trend towards a reduction in amplitude (Table 5). All 150 cells identified in the SCN of +/+ mice were rhythmic, and 98% of the 148 cells discriminated in the SCN of Afh/Afh mutants were rhythmic. The period of single-cell oscillations in the SCN lengthened significantly from 23.64 ± 0.23 h in +/+ mice to 25.77 ± 0.05 h in Afh/Afh animals (P < 0.0001).
The Afh mutation significantly reduced the amplitude of single-cell rhythms in the SCN (+/+: 5304 ± 262; Afh/Afh: 3767 ± 224; P < 0.0001; Fig. 9). We therefore assessed whether this was accompanied by a loss of synchrony between individual SCN cells. Rayleigh analysis revealed that cells were significantly synchronised on the second day in all +/+ and Afh/Afh SCN cultures. R-values did not differ significantly between genotypes after 2 days in culture (+/+, r= 0.93 ± 0.03; Afh/Afh, r= 0.94 ± 0.03; P > 0.05, unpaired t test; Fig. 9), indicating no reduction in cell synchrony due to the Afh mutation. Most cells in both +/+ and Afh/Afh SCN slices had not significantly damped by the end of the recording period, so for this tissue it was possible to also determine cellular synchrony at a later time point. Cell synchrony after 5 days in culture tended to be lower in Afh/Afh (r= 0.66 ± 0.08) than in +/+ (r= 0.83 ± 0.06; Fig. 9) SCNs and, while differences only approached significance (P= 0.052), this trend suggests that after a longer time in culture, faster desynchronisation between cells in the SCN of Afh/Afh mice may lead to an increased rate of damping relative to +/+ SCNs.
Figure 9. Cell synchrony in +/+ and Afh/Afh SCN slices.

A, plots of integrated bioluminescence for representative individual cells in the SCN of +/+ (upper trace) and Afh/Afh (lower trace) mice. The inserts show expansion of single-cell traces for days 5–9 in culture. The amplitude of single-cell oscillations was lower in Afh/Afh compared with +/+ SCN slices, and cells tended to become desynchronised over time in culture. B, Rayleigh vector plots showing phase clustering of cells in the SCN of +/+ and Afh/Afh mice. Circles (open: +/+; filled: Afh/Afh) indicate the phase of peak PER2::LUC bioluminescence in individual cells visualised from the same slice at 2 days and 5 days following culture. Phases are plotted relative to time of culture. Single-cell rhythms in both +/+ and Afh/Afh SCN were tightly synchronised on day 2 in culture. Lower R-values on day 5 in vitro indicate a progressive reduction in cell synchrony. No significant differences between genotypes were observed in phase clustering (P > 0.05), although cells tended to be less well synchronised in Afh/Afh than +/+ cultures after 5 days in culture.
Discussion
Here we show that the Afh mutation elicits alterations in metabolic and ingestive rhythms. These may in part be controlled by the changes we demonstrate in molecular oscillators in metabolically important brain regions. We provide the first examination of phase-shifting behaviour in these mice and uncover rare Type 0 resetting, which is associated with enhanced phase-resetting of molecular clocks in vitro. Our current findings add to our understanding of circadian phase-resetting, and indicate that the amplitude of individual cellular oscillators is a key component in maintenance of phase.
The significant reduction in the strength of diurnal wheel-running and drinking rhythms in homozygous Afh mutants is indicative of impaired photic entrainment. We observed variation in the precision of entrainment of Afh/Afh animals to LD using all of the methods described in this study, and mutant individuals were identified that were arrhythmic for either locomotor or metabolic activity. In a previous study, all Afh/Afh mice entrained to the LD cycle (Maywood et al. 2011), although the authors here did not comment on whether diurnal rhythm strength was affected by genotype. Godinho et al. (2007) did, however, report variable behaviour of Afh/Afh mice on return to LD following 19 days in DD, with some mice failing to re-entrain. It is also noteworthy that in the Afh/Afh mice that were significantly rhythmic under LD in our study, diurnal rhythm strength was negatively correlated with period length in DD. Therefore, whether or not diurnal entrainment is achieved appears to depend on the amount by which an individual's natural activity onset deviates from the exogenous LD cycle. Once released into DD, both +/+ and Afh/Afh mice were able to maintain robust rhythms for up to 10 weeks, and there was no evidence that free-running rhythm strength deteriorated more quickly in Afh/Afh mice. The alteration in endogenous period by the Afh mutation does not therefore significantly impair the strength of the endogenous rhythm once external phase-shifting influences are removed.
Interestingly, tau homozygote mutant mice, which express a 20 h circadian period of wheel-running in DD, also display a range of phenotypes in diurnal conditions, again with some individuals failing to entrain to the LD cycle (Meng et al. 2008; Maywood et al. 2011). Stabilisation of clock gene proteins is also disrupted in these animals, but in this case results in enhanced degradation of PER with consequent shortening of the free-running period and advanced onset of wheel-running activity in LD. In the case of Afh/Afh mutants, we identified a significant delay relative to +/+ controls in the timing of peak wheel-running activity under diurnal conditions. Such delays correlate with the altered phasing of clock gene and protein expression associated with the Afh and overtime mutations, determined previously using in situ hybridisation, real-time polymerase chain reaction and Western blotting (Godinho et al. 2007; Siepka et al. 2007). It is important to note, however, that, unlike wheel-running rhythms, the reduced amplitude of clock gene oscillations in Afh mice persists in DD.
Metabolic and feeding rhythms were also delayed 3–4 h in Afh/Afh mice under LD, mirroring alterations in the molecular clockwork and wheel-running activity. While overall amplitudes of VO2 and food hopper activity rhythms were not significantly reduced under LD, we did observe Afh/Afh mice that lacked a significant diurnal rhythm in one or other parameter (see Table 3). Alterations in drinking rhythms in Afh/Afh mice were closely correlated to wheel-running rhythms, showing decreased diurnal strength and increased circadian period. There are numerous reciprocal connections between the SCN and the hypocretin and other energy balance systems, and mutations affecting the circadian system can alter metabolism and ingestive behaviours (Rudic et al. 2004; Turek et al. 2005; Bechtold et al. 2008). For example, Clock mutant mice have severely attenuated feeding rhythms under diurnal conditions (Turek et al. 2005), and similar reductions in the amplitudes of plasma glucose and triglyceride rhythms are reported in mice lacking Bmal1 (Rudic et al. 2004).
Phase-shifting behaviour has not previously been determined for Afh mice. Our in vivo resetting study revealed a high-amplitude Type 0-like phase-resetting in Afh/Afh mice in response to light. This is of importance because nocturnal rodents typically display Type 1 phase-resetting in vivo; indeed Type 0 resetting has only been reported in mice lacking core molecular clock components (Vitaterna et al. 2006; Jud et al. 2010; Dallmann et al. 2011). The circadian pacemaker has been modelled across a diverse range of species as a van der Pol limit cycle oscillator (Jewett et al. 1999; Leloup et al. 1999; Gonze et al. 2002; Indic et al. 2005; Yamada & Forger, 2010; Leloup & Goldbeter, 2011). Thus, the ability of perturbing stimuli to phase shift an oscillator is inversely correlated with the internal amplitude of the oscillation (Aschoff & Pohl, 1978; Pittendrigh et al. 1991; Johnson et al. 2003). Consequently, Type 0 resetting results from a high-intensity phase-shifting stimuli or a decrease in the amplitude of the oscillator. Takahashi and colleagues provided evidence that the decrease in amplitude of the molecular oscillator in Clock heterozygous mutant mice resulted in high-amplitude Type 0 phase-resetting (Vitaterna et al. 2006). Further, high-amplitude phase-resetting was observed in the Rev-Erba/Per1 double mutant mouse, which displayed damped oscillations of several clock genes (but not Per2) in the SCN (Jud et al. 2010).
In our study, we observe a decrease in the amplitude of the molecular clock not just in the SCN pacemaker, but also in extra-SCN oscillators. This decrease can result from either a decrease in the amplitude (or proportion) of individual oscillating cells, or from a reduction in synchrony among the population, damping the combined output of the oscillator. To determine the mechanism underlying the reduction in oscillator amplitude from tissues in the brain of Afh/Afh mice, we imaged cells in the SCN, Arc and DMH, and assessed their individual amplitudes. One can predict from the limit cycle model that because we observed much larger phase-shifting responses to light in the Afh/Afh vs.+/+ mice, oscillating single cells would be of lower amplitude but still synchronised, which is indeed what we observed. However, while it was not possible to assess cellular synchrony in the MBH beyond a few days in culture, there was some indication that within the SCN, individual cells may become desynchronised more quickly over time as a result of the Afh mutation. Desynchronisation of SCN cellular oscillators is strongly associated with aberrant rhythms in SCN clock gene expression and behaviour (Harmar et al. 2002; Aton et al. 2005), and exercise in a running wheel can stabilise behavioural rhythms in such animals (Power et al. 2010). Because Afh/Afh mice maintain stable wheel-running and drinking rhythms in DD conditions, this suggests that feedback from general locomotor activity and/or wheel-running stabilises the SCN of the animals such that the individual SCN cells do not desynchronise.
The mechanism underlying enhanced in vivo behavioural resetting likely involves enhanced resetting of the molecular clockwork. When cultured in vitro, +/+ SCN and PIT exhibit peaks in PER2::LUC at a consistent CT, which corresponds to their previously published circadian phases in vivo and in vitro (Albrecht et al. 1997; Bae et al. 2001; Guilding et al. 2009; Hughes et al. 2011). Hence, these +/+ oscillators resist the phase-resetting stimuli of the cull/culturing process. We hypothesised that weakening of the molecular clock in Afh/Afh mice may render the previously robust oscillators in the SCN and PIT unable to resist phase shifts. Indeed, we found that these tissues taken from Afh/Afh mice do not peak at a consistent time relative to their previous in vivo phase. Instead, they are reset so they consistently peak the same time after cull regardless of the circadian phase of cull. These data indicate that the ability of a given tissue to maintain its in vivo phase when cultured depends on the strength of the oscillator (Guilding et al. 2009; Dolatshad et al. 2010; Hughes et al. 2011). Accordingly, +/+ ME, the strongest (highest amplitude, least damping) of all the oscillators in the MBH maintains a phase correlated to circadian time when cultured, whereas the less robust MBH oscillators in the Arc and DMH, and the oscillator in the Hb are easily reset by the phase-shifting effects of the culturing process. This enhanced phase-resetting in response to culture is similar to that recently observed in the SCN of VPAC2RKO mice, which also display low-amplitude molecular rhythms (Hughes et al. 2011).
Circadian clocks throughout the body display different characteristics, as exemplified by significant differences in intrinsic circadian period between hypothalamic oscillators (Guilding et al. 2009) and by the substitution of CLOCK with NPAS2 in the forebrain (Reick et al. 2001; Debruyne et al. 2006). Fbxl3 is ubiquitously expressed (Godinho et al. 2007; Dardente et al. 2008), and its role in the regulation of circadian clockwork appears to be conserved at least throughout the brain as we see a similar tendency towards increased period length and reduced amplitude in all tissues we investigated. More recently, a homologue of Fbxl3, Fbxl21, was identified as a new clock component (Dardente et al. 2008). Unlike Fbxl3, the expression of Fbxl21 is highly tissue specific, and exhibits a clock-dependent rhythm. Whether Fbxl21 differentially influences the resistance of local oscillators to phase-resetting is intriguing and remains to be explored.
In summary, we demonstrate a broad conservation of the period-lengthening and amplitude-reducing effects of the Fbxl3 mutation across the brain and peripheral regions investigated. Our results indicate that not only does the Afh mutation enhance in vitro phase-resetting of molecular rhythms, but that this is associated with high-amplitude, Type 0-like phase–response curve to light in vivo. Because Afh/Afh mutant mice maintain behavioural rhythms in constant conditions, the increased efficacy of resetting stimuli in Afh/Afh mutants is likely to be a consequence of reduced oscillator amplitude, resulting from suppressed amplitude in single cells rather than from a desynchronisation of these cells.
Acknowledgments
This research was funded by a project grant from the Wellcome Trust (WT086352MA). The authors thank Dr Pat Nolan (MRC Harwell) and Dr Michael Hastings (MRC LMB, Cambridge) for supplying the Afh+/− mice, and staff in the Manchester BSF for technical assistance.
Glossary
- Afh
after-hours
- Arc
arcuate nucleus
- BMAL1
Brain and Muscle ARNT-Like 1
- CRY
Cryptochrome
- CT
circadian time
- DD
constant darkness
- DMH
dorsomedial hypothalamus
- Epe
ependymal layer
- Hb
habenula
- LD
light/dark
- MBH
mediobasal hypothalamus
- ME
median eminence
- PER2::LUC
PERIOD2::LUCIFERASE
- PIT
pituitary
- PMT
photomultiplier tube
- PT
pars tuberalis
- SCN
suprachiasmatic nuclei
- ZT
Zeitgeber time
Author contributions
C.G., F.S. and H.P. conceived and designed the experiments. C.G., F.S. and S.W. collected the data, while all authors contributed to the analysis and interpretation of the data. C.G., F.S., H.P., T.M.B. and D.A.B. wrote the paper. All authors approved the final version of the manuscript.
References
- Abe M, Herzog ED, Yamazaki S, Straume M, Tei H, Sakaki Y, Menaker M, Block GD. Circadian rhythms in isolated brain regions. J Neurosci. 2002;22:350–356. doi: 10.1523/JNEUROSCI.22-01-00350.2002. [DOI] [PMC free article] [PubMed] [Google Scholar]
- Albrecht U, Sun ZS, Eichele G, Lee CC. A differential response of two putative mammalian circadian regulators, mper1 and mper2, to light. Cell. 1997;91:1055–1064. doi: 10.1016/s0092-8674(00)80495-x. [DOI] [PubMed] [Google Scholar]
- Aschoff J, Pohl H. Phase relations between a circadian rhythm and its zeitgeber within the range of entrainment. Die Naturwissenschaften. 1978;65:80–84. doi: 10.1007/BF00440545. [DOI] [PubMed] [Google Scholar]
- Aton SJ, Colwell CS, Harmar AJ, Waschek J, Herzog ED. Vasoactive intestinal polypeptide mediates circadian rhythmicity and synchrony in mammaliam clock neurons. Nat Neurosci. 2005;8:476–483. doi: 10.1038/nn1419. [DOI] [PMC free article] [PubMed] [Google Scholar]
- Bae K, Jin X, Maywood ES, Hastings MH, Reppert SM, Weaver DR. Differential functions of mPer1, mPer2, and mPer3 in the SCN circadian clock. Neuron. 2001;30:525–536. doi: 10.1016/s0896-6273(01)00302-6. [DOI] [PubMed] [Google Scholar]
- Balsalobre A, Damiola F, Schibler U. A serum shock induces circadian gene expression in mammalian tissue culture cells. Cell. 1998;93:929–937. doi: 10.1016/s0092-8674(00)81199-x. [DOI] [PubMed] [Google Scholar]
- Bechtold DA, Brown TM, Luckman SM, Piggins HD. Metabolic rhythm abnormalities in mice lacking VIP-VPAC2 signaling. Am J Physiol Regul Integr Comp Physiol. 2008;294:R344–R351. doi: 10.1152/ajpregu.00667.2007. [DOI] [PubMed] [Google Scholar]
- Busino L, Bassermann F, Maiolica A, Lee C, Nolan PM, Godinho SI, Draetta GF, Pagano M. SCFFbxl3 controls the oscillation of the circadian clock by directing the degradation of cryptochrome proteins. Science. 2007;316:900–904. doi: 10.1126/science.1141194. [DOI] [PubMed] [Google Scholar]
- Dallmann R, DeBruyne JP, Weaver DR. Photic resetting and entrainment in CLOCK-deficient mice. J Biol Rhythms. 2011;26:390–401. doi: 10.1177/0748730411414345. [DOI] [PMC free article] [PubMed] [Google Scholar]
- Dardente H, Mendoza J, Fustin JM, Challet E, Hazlerigg DG. Implication of the F-Box Protein FBXL21 in circadian pacemaker function in mammals. PLoS One. 2008;3:e3530. doi: 10.1371/journal.pone.0003530. [DOI] [PMC free article] [PubMed] [Google Scholar]
- Debruyne JP, Noton E, Lambert CM, Maywood ES, Weaver DR, Reppert SM. A clock shock: mouse CLOCK is not required for circadian oscillator function. Neuron. 2006;50:465–477. doi: 10.1016/j.neuron.2006.03.041. [DOI] [PubMed] [Google Scholar]
- Dolatshad H, Cary AJ, Davis FC. Differential expression of the circadian clock in maternal and embryonic tissues of mice. PloS one. 2010;5:e9855. doi: 10.1371/journal.pone.0009855. [DOI] [PMC free article] [PubMed] [Google Scholar]
- Godinho SI, Maywood ES, Shaw L, Tucci V, Barnard AR, Busino L, Pagano M, Kendall R, Quwailid MM, Romero MR, O’Neill J, Chesham JE, Brooker D, Lalanne Z, Hastings MH, Nolan PM. The after-hours mutant reveals a role for Fbxl3 in determining mammalian circadian period. Science. 2007;316:897–900. doi: 10.1126/science.1141138. [DOI] [PubMed] [Google Scholar]
- Gonze D, Roussel MR, Goldbeter A. A model for the enhancement of fitness in cyanobacteria based on resonance of a circadian oscillator with the external light-dark cycle. J Theor Biol. 2002;214:577–597. doi: 10.1006/jtbi.2001.2476. [DOI] [PubMed] [Google Scholar]
- Guilding C, Hughes AT, Brown TM, Namvar S, Piggins HD. A riot of rhythms: neuronal and glial circadian oscillators in the mediobasal hypothalamus. Mol Brain. 2009;2:28. doi: 10.1186/1756-6606-2-28. [DOI] [PMC free article] [PubMed] [Google Scholar]
- Guilding C, Hughes AT, Piggins HD. Circadian oscillators in the epithalamus. Neuroscience. 2010;169:1630–1639. doi: 10.1016/j.neuroscience.2010.06.015. [DOI] [PMC free article] [PubMed] [Google Scholar]
- Guilding C, Piggins HD. Challenging the omnipotence of the suprachiasmatic timekeeper: are circadian oscillators present throughout the mammalian brain. Eur J Neurosci. 2007;25:3195–3216. doi: 10.1111/j.1460-9568.2007.05581.x. [DOI] [PubMed] [Google Scholar]
- Harmar AJ, Marston HM, Shen S, Spratt C, West KM, Sheward WJ, Morrison CF, Dorin JR, Piggins HD, Reubi JC, Kelly JS, Maywood ES, Hastings MH. The VPAC(2) receptor is essential for circadian function in the mouse suprachiasmatic nuclei. Cell. 2002;109:497–508. doi: 10.1016/s0092-8674(02)00736-5. [DOI] [PubMed] [Google Scholar]
- Hughes AT, Guilding C, Piggins HD. Neuropeptide signaling differentially affects phase maintenance and rhythm generation in SCN and extra-SCN circadian oscillators. PloS one. 2011;6:e18926. doi: 10.1371/journal.pone.0018926. [DOI] [PMC free article] [PubMed] [Google Scholar]
- Indic P, Forger DB, St Hilaire MA, Dean DA, 2nd, Brown EN, Kronauer RE, Klerman EB, Jewett ME. Comparison of amplitude recovery dynamics of two limit cycle oscillator models of the human circadian pacemaker. Chronobiol Int. 2005;22:613–629. doi: 10.1080/07420520500180371. [DOI] [PMC free article] [PubMed] [Google Scholar]
- Jewett ME, Forger DB, Kronauer RE. Revised limit cycle oscillator model of human circadian pacemaker. J Biol Rhythms. 1999;14:493–499. doi: 10.1177/074873049901400608. [DOI] [PubMed] [Google Scholar]
- Johnson CH. Forty years of PRCs – what have we learned. Chronobiol Int. 1999;16:711–743. doi: 10.3109/07420529909016940. [DOI] [PubMed] [Google Scholar]
- Johnson CH, Elliott JA, Foster R. Entrainment of circadian programs. Chronobiol Int. 2003;20:741–774. doi: 10.1081/cbi-120024211. [DOI] [PubMed] [Google Scholar]
- Jud C, Hayoz A, Albrecht U. High amplitude phase resetting in rev-erbalpha/per1 double mutant mice. PloS One. 2010;5:e12540. doi: 10.1371/journal.pone.0012540. [DOI] [PMC free article] [PubMed] [Google Scholar]
- Ko CH, Takahashi JS. Molecular components of the mammalian circadian clock. Hum Mol Genet. 2006;15(Spec No 2):R271–R277. doi: 10.1093/hmg/ddl207. [DOI] [PubMed] [Google Scholar]
- Lee HM, Chen R, Kim H, Etchegaray JP, Weaver DR, Lee C. The period of the circadian oscillator is primarily determined by the balance between casein kinase 1 and protein phosphatase 1. Proc Natl Acad Sci U S A. 2011;108:16451–16456. doi: 10.1073/pnas.1107178108. [DOI] [PMC free article] [PubMed] [Google Scholar]
- Leloup JC, Goldbeter A. Modelling the dual role of Per phosphorylation and its effect on the period and phase of the mammalian circadian clock. IET Systems Biol. 2011;5:44. doi: 10.1049/iet-syb.2009.0068. [DOI] [PubMed] [Google Scholar]
- Leloup JC, Gonze D, Goldbeter A. Limit cycle models for circadian rhythms based on transcriptional regulation in Drosophila and Neurospora. J Biol Rhythms. 1999;14:433–448. doi: 10.1177/074873099129000948. [DOI] [PubMed] [Google Scholar]
- Maywood ES, Chesham JE, Meng QJ, Nolan PM, Loudon AS, Hastings MH. Tuning the period of the mammalian circadian clock: additive and independent effects of CK1epsilonTau and Fbxl3Afh mutations on mouse circadian behaviour and molecular pacemaking. J Neurosci. 2011;31:1539–1544. doi: 10.1523/JNEUROSCI.4107-10.2011. [DOI] [PMC free article] [PubMed] [Google Scholar]
- Meng QJ, Logunova L, Maywood ES, Gallego M, Lebiecki J, Brown TM, Sladek M, Semikhodskii AS, Glossop NR, Piggins HD, Chesham JE, Bechtold DA, Yoo SH, Takahashi JS, Virshup DM, Boot-Handford RP, Hastings MH, Loudon AS. Setting clock speed in mammals: the CK1 epsilon tau mutation in mice accelerates circadian pacemakers by selectively destabilizing PERIOD proteins. Neuron. 2008;58:78–88. doi: 10.1016/j.neuron.2008.01.019. [DOI] [PMC free article] [PubMed] [Google Scholar]
- Piggins HD, Guilding C. The neural circadian system of mammals. Essays Biochem. 2011;49:1–17. doi: 10.1042/bse0490001. [DOI] [PubMed] [Google Scholar]
- Pittendrigh CS, Kyner WT, Takamura T. The amplitude of circadian oscillations: temperature dependence, latitudinal clines, and the photoperiodic time measurement. J Biol Rhythms. 1991;6:299–313. doi: 10.1177/074873049100600402. [DOI] [PubMed] [Google Scholar]
- Power A, Hughes AT, Samuels RE, Piggins HD. Rhythm-promoting actions of exercise in mice with deficient neuropeptide signaling. J Biol Rhythms. 2010;25:235–246. doi: 10.1177/0748730410374446. [DOI] [PubMed] [Google Scholar]
- Reick M, Garcia JA, Dudley C, McKnight SL. NPAS2: an analog of clock operative in the mammalian forebrain. Science. 2001;293:506–509. doi: 10.1126/science.1060699. [DOI] [PubMed] [Google Scholar]
- Rudic RD, McNamara P, Curtis AM, Boston RC, Panda S, Hogenesch JB, Fitzgerald GA. BMAL1 and CLOCK, two essential components of the circadian clock, are involved in glucose homeostasis. PLoS Biol. 2004;2:e377. doi: 10.1371/journal.pbio.0020377. [DOI] [PMC free article] [PubMed] [Google Scholar]
- Siepka SM, Yoo SH, Park J, Song W, Kumar V, Hu Y, Lee C, Takahashi JS. Circadian mutant Overtime reveals F-box protein FBXL3 regulation of cryptochrome and period gene expression. Cell. 2007;129:1011–1023. doi: 10.1016/j.cell.2007.04.030. [DOI] [PMC free article] [PubMed] [Google Scholar]
- Sokolove PG, Bushell WN. The chi square periodogram: its utility for analysis of circadian rhythms. J Theor Biol. 1978;72:131–160. doi: 10.1016/0022-5193(78)90022-x. [DOI] [PubMed] [Google Scholar]
- Turek FW, Joshu C, Kohsaka A, Lin E, Ivanova G, McDearmon E, Laposky A, Losee-Olson S, Easton A, Jensen DR, Eckel RH, Takahashi JS, Bass J. Obesity and metabolic syndrome in circadian Clock mutant mice. Science. 2005;308:1043–1045. doi: 10.1126/science.1108750. [DOI] [PMC free article] [PubMed] [Google Scholar]
- Vitaterna MH, Ko CH, Chang AM, Buhr ED, Fruechte EM, Schook A, Antoch MP, Turek FW, Takahashi JS. The mouse Clock mutation reduces circadian pacemaker amplitude and enhances efficacy of resetting stimuli and phase-response curve amplitude. Proc Natl Acad Sci U S A. 2006;103:9327–9332. doi: 10.1073/pnas.0603601103. [DOI] [PMC free article] [PubMed] [Google Scholar]
- Winfree AT. The Geometry of Biological Time. New York: Springer; 2001. [Google Scholar]
- Yamada Y, Forger D. Multiscale complexity in the mammalian circadian clock. Curr Opin Genet Dev. 2010;20:626–633. doi: 10.1016/j.gde.2010.09.006. [DOI] [PMC free article] [PubMed] [Google Scholar]
- Yamazaki S, Numano R, Abe M, Hida A, Takahashi R, Ueda M, Block GD, Sakaki Y, Menaker M, Tei H. Resetting central and peripheral circadian oscillators in transgenic rats. Science. 2000;288:682–685. doi: 10.1126/science.288.5466.682. [DOI] [PubMed] [Google Scholar]
- Yoo SH, Yamazaki S, Lowrey PL, Shimomura K, Ko CH, Buhr ED, Siepka SM, Hong HK, Oh WJ, Yoo OJ, Menaker M, Takahashi JS. PERIOD2::LUCIFERASE real-time reporting of circadian dynamics reveals persistent circadian oscillations in mouse peripheral tissues. Proc Natl Acad Sci U S A. 2004;101:5339–5346. doi: 10.1073/pnas.0308709101. [DOI] [PMC free article] [PubMed] [Google Scholar]