

Abstract
Changes in the activity of striatal output neurons (SONs) have been implicated in the pathogenesis of Huntington's disease (HD). In this inherited polyglutamine disorder, accumulation of intracellular toxins causes a variety of deficits, including synaptic dysfunction, but it is still unclear to what extent striatal GABA release is afflicted as well. Two murine HD models were used, a recently created knock-in mouse (Z_Q175_KI) and an established model of HD (R6/2). In sagittal slices with relatively well-preserved glutamatergic connections throughout the basal ganglia, we have characterized the following: (i) the excitability of SONs; (ii) their spontaneous action potential-dependent GABAergic synaptic activity; (iii) the capacity of exogenous GABA to inhibit spontaneous action potential generation; and (iv) the properties of GABAergic unitary evoked responses (eIPSCs) in response to intrastriatal minimal stimulation at low and high frequency. The HD SONs exhibited enhanced intrisic excitability and higher levels of GABAergic spontaneous activity without presenting evidence for homeostatic upregulation of endogenous or exogenous GABA actions. Unitary eIPSC amplitudes were reduced, with a clear deficit in the probability of release, as indicated by a higher paired-pulse ratio, failure rate and coefficient of variation. In conditions of high-frequency activation, GABAergic connections of HD SONs were prone to asynchronous release and delayed IPSC generation at the expense of synchronized release. Both in wild-type and in HD SONs, GABA was inhibitory. Our results support the conclusion that the enhanced spontaneous synaptic activity in the HD striatum reflects disinhibition. Pharmacological tests identified the HD-related tonic suppression of synaptic inhibition as a glutamate- and endocannabinoid-dependent process.
Key points
In neurodegenerative diseases, the afflicted brain provides both an important object of study and an opportunity to characterize a given cellular interaction from a pathophysiological perspective.
This dual approach is particularly advantageous when human disease is based on a monogenetic defect and an appropriate animal model becomes available for detailed investigation, as in case of Z_Q175_KI, a new knock-in mouse expressing a mutant form of murine huntingtin.
Our results challenge the current viewpoint that GABAergic transmission is enhanced in the striatum in Huntington's disease. Quantal analysis in combination with high-frequency stimulation and paired-pulse tests revealed that synaptic GABA release is in fact tonically suppressed, resulting in disinhibition of striatal output activity.
The underlying mechanism involves a retrograde endocannabinoid signalling pathway linking postsynaptic metabotropic glutamate type 5 receptors with presynaptic cannabinoid type 1 receptors and GABA release.
The results help us to understand why pathological elevation of extracellular glutamate levels depresses synaptic inhibition.
Introduction
Huntington's disease (HD) is inherited in an autosomal dominant manner and is characterized by progressive deterioration of movement control, cognitive abilities and mood. In the afflicted persons, a pathological expansion of a CAG trinucleotide repeat in the mutant huntingtin (mhtt) gene is translated into a polyglutamine (polyQ) repeat located at the N-terminus of the mutant protein (The Huntington’s Disease Collaborative Research Group, 1993). The age of disease onset correlates inversely with the length of the polyQ stretch (Kremer et al. 1993; Snell et al. 1993). Extensive studies suggest that at the cellular level HD results from both a gain and a loss of gene function (Ross & Tabrizi, 2011). The production of small N-terminal fragments by proteolytic cleavage (Hackam et al. 1998) would represent a gain of toxic function, while impairment of vesicle transport and secretion of trophic factors (Gauthier et al. 2004; Zuccato & Cattaneo, 2009) may reflect loss of normal huntingtin function. Other pathogenic mechanisms include mitochondrial deficits (Shirendeb et al. 2011), proteosomal dysfunction (Li & Li, 2011), dysfunction of Ca2+ homeostasis (Tang et al. 2005), defects in axonal transport (Morfini et al. 2009), abnormal endocytosis (Trushina et al. 2006) and deficits in transmitter uptake (Liévens et al. 2001; Estrada-Sánchez et al. 2009).
Although a neuropathological feature of advanced HD in humans is loss of neurons in the striatum and cerebral cortex, one has to consider that HD might at first be a disease of inappropriate neuronal signalling, and only secondarily a disease of cell death (Tobin & Signer, 2000). During the past 10 years, animal models of HD (reviewed by Mangiarini et al. 1996; Levine et al. 2004; Van Raamsdonk et al. 2005; Menalled et al. 2009; Lu, 2009; Cepeda et al. 2010; Rozas et al. 2010) have offered opportunities to illuminate the possible links between altered transmitter signalling and neurotoxicity and to assess more subtle modifications in cellular interactions prior to neurodegeneration (see, for example, Milnerwood et al. 2010).
The starting point of the present study was the initial observation that in mice carrying the mutant form of huntingtin, striatal output neurons (SONs) displayed lower amplitudes of evoked inhibitory postsynaptic currents (eIPSCs) and higher frequency levels of spontaneous inhibitory postsynaptic currents (sIPSCs) than their wild-type (WT) siblings. The former finding was surprising because a number of previously published papers suggested that the strength of GABAergic inhibition in the striatum increases with progression of HD (Cepeda et al. 2004; Centonze et al. 2005), which could compensate for the massive increase of intrinsic excitability characteristic of HD SONs (Klapstein et al. 2001; Cepeda et al. 2001, 2004). In view of the potential importance of pharmacotherapy in neurodegenerative diseases of the basal ganglia, we aimed at resolving this apparent contradiction by performing a more detailed examination of presynaptic indicators of synaptic efficacy. To this end, we applied the method of vesicle depletion by high-frequency (HF) stimulation to validate the paired-pulse ratio (PPR) as a specific indicator of presynaptic alterations (see Sakaba et al. 2002; Kirischuk et al. 2005). In addition, we intended to gain more information on the action of GABA on striatal output activity and the mechanism(s) underlying HD-related alterations of GABAergic synaptic transmission in the dosal striatum.
The experiments were performed in two different mouse models of HD, R6/2 and Z_Q175_KI (in the following abbreviated as Q175). The R6/2 mice represent a transgenic model of HD (Mangiarini et al. 1996) and develop a particularly aggressive form of the disease bearing similarity to the juvenile variety of HD. R6/2 mice are characterized by initial motor hyperactivity, followed by akinesia at about 8 weeks after birth. In the recently introduced Q175 mouse (Yrjanheikki et al. 2011), the mutation is inserted in the murine huntingtin gene. As in Q140 mice, expression of multiple CAG repeats can occur in an appropriate genomic and protein environment (Menalled, 2005). In Q175 homozygotes, motor symptoms start to develop at an age of about 5 months. At an age of 10–12 months, Q175 homozygotes are hypokinetic and occasionally exhibit tremor, but mostly lack feet clasping.
Our results support the main conclusion that symptomatic HD is associated with a marked deficit in synaptic GABA release, thereby qualifying the enhancement of sIPSC frequency as a disinhibitory phenomenon. The mechanism underlying the HD-related suppression of inhibition includes tonic activity of metabotropic glutamate receptor type 5 (mGluR5) and retrograde endocannabinoid (eCB) signalling as a pathophysiological hallmark of advanced disease.
Methods
Ethical approval
All experiments were carried out according to the guidelines laid down by the Office of Health Protection and Technical Safety of the Berlin regional government (Landesamt für Arbeitsschutz, Gesundheitsschutz und Technische Sicherheit Berlin, T0406/03) and EU guidelines (directive 86/609/EEC). The experiments comply with the policies and regulations of The Journal of Physiology. Every precaution was taken to minimize stress and the number of animals used in each series of experiments.
Transgenic mice
R6/2 heterozygote mice (B6CBA-Tg(HDexon1)62Gpb/3J, #006494; The Jackson Laboratory, Bar Harbor, ME, USA) were derived from the transgenic mouse line generated by (Mangiarini et al. 1996) but give a slightly lower repeat number than the original R6/2 bred until 2004 (#002810; Jackson Laboratory). The Q175 homozygote mice used here (#370437; Jackson Laboratory) originated from the Q140 knock-in mouse described by Menalled et al. (2003). It was created by Cerebricon Ltd/Charles River Laboratories, Kuopio, Finland and CHDI Fndn. Inc., Princeton, NJ, USA. Q175 mice express a chimeric mouse/human exon 1 mhtt. At weaning, all mice were given identity marks, and tail-tip samples were taken for DNA extraction and genotyping by transgene PCR and were analysed for CAG length. In the following, we shall refer to the normal wild-type mice as ‘WT’ and to mice carrying a mutant form of huntingtin as ‘carrier’ (CAR) or ‘HD mice’. Average CAG length was 120 ± 0.2 (range 114–127, n= 137 in R6/2 and 184.6 ± 0.7) (range 172–195, n= 68) in Q175. The average age was 78.0 ± 1.1 days, n= 91 vs. 75.0 ± 1.2 days, n= 77 (n.s.) in R6/2 WT and CAR, respectively, and 400.3 ± 2.6 days, n= 54 vs. 405.6 ± 4.9 days n= 68 (n.s.) in Q175 WT and CAR, respectively. Considering the absence of sex- and age-dependent differences in the tested parameters, we have accordingly pooled the data from the WT and CAR cohorts.
Both the WT and CAR mice were derived from the same breading source, kept under identical housing and transport conditions and were taken into the experiments in an alternate fashion. At the age of 2 months, R6/2 CAR mice had a significantly reduced body weight and severe sensorimotor disturbances, including akinesia and feet clasping (Mangiarini et al. 1996; Milnerwood et al. 2006). In R6/2 mice the latter was 100% positive. Although much older and already symptomatic for HD, Q175 homozygotes appeared to be in a slightly better general state. Nonetheless, they were hypokinetic and occasionally presented with tremor. Compared to WT mice, their body weight was significantly lower (females 26.7 ± 0.6 g, n= 24 vs. 21.3 ± 0.5 g, n= 23, p < 0.0001; and males 33.6 ± 0.8 g, n= 47 vs. 22.2 ± 0.3 g, n= 45, p < 0.001).
Slice preparation
Animals were decapitated under deep isoflurane anaesthesia and the brains were quickly removed and transferred into ice-cold saline that contained (mm): 125 choline chloride, 2 KCl, 10 glucose, 1.25 NaH2PO4, 25 NaHCO3, 0.5 CaCl2 and 7.5 MgCl2 constantly aerated with a 5% CO2–95% O2 mixture (pH 7.3). Osmolarity was ∼300 mosmol l−1. Ten degree off-sagittal slices comprising the striatum of one hemisphere were cut on a vibrating microtome (Integraslice 7550PSDS; Campden Instruments Ltd, Loughborough, UK).
The slices were 200–300 μm thick and typically preserved part of the glutamatergic (apart from GABAergic) synaptic connectivity of the basal ganglia (also see Bosch et al. 2012). This conclusion was supported by records of local field potentials in addition to postsynaptic currents in the striatum and substantia nigra pars reticulata (SNR). Figure 1A–C shows an example. The approximate tip position of recording and stimulating electrodes is projected on a photomicrograph from the mouse brain atlas (Paxinos & Franklin, 2003). In these local field potential recordings, the upward positive deflection was sensitive to gabazine (10 μm), the N2 wave was sensitive to 6,7-dinitroquinoxaline-2,3(1H,4H)-dione (DNQX; 10 μm) and the N1 wave was blocked by TTX (1 μm; not illustrated). The presence of N2 indicates that viable glutamatergic fibres not only entered the striatum (Fig. 1B) but also left it (Fig. 1C), some of them reaching the SNR. The size of N2 in the SNR served as a means to optimize slice orientation. In most cases, the angle to the sagittal plane was set to 10 deg.
Figure 1. Experimental configuration to test for integrity of the basal ganglia connectome and to record unitary evoked inhibitory postsynaptic currents (eIPSCs) in response to ‘minimal stimulation’ in the striatum (Str).
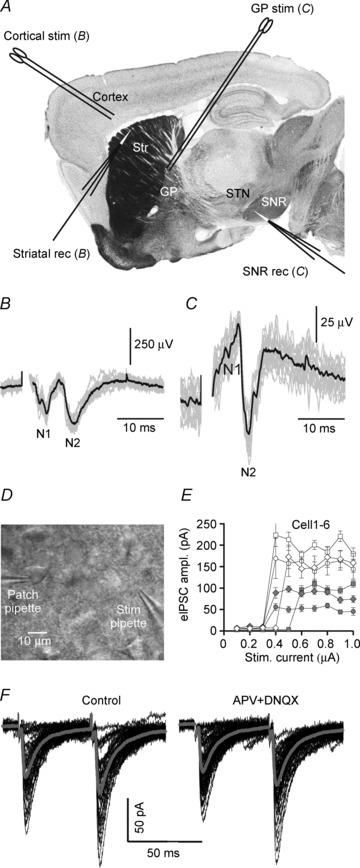
A–C, integrity check of glutamatergic connections on the basis of evoked local field potentials in the striatum and substantia nigra pars reticulata (SNR) in response to electrical stimulation in the cerebral cortex and dorsal globus pallidus (GP) or subthalamic nucleus (STN), respectively. A, the position of stimulating and recording electrodes is shown on a sagittal section through the mouse brain (Paxinos & Franklin, 2003). B, local field potential traces from the dorsal striatum (grey). Averaged trace in black. N2 denotes a DNXQ-sensitive component (test not shown). C, same as in B, but local field potential traces were recorded from the SNR after dorsal GP stimulation and low-pass filtered at 1 kHz. Note that a stimulation electrode placed at the striatal exit elicits in the SNR a glutamatergic response amounting to at least 10% of the dorsal striatal response to cortical stimulation. D, view field of a striatal slice showing the position of an artificial cerebrospinal fluid (ACSF)-filled glass pipette as used for minimal stimulation of GABAergic fibres within the striatum. E, distinct intensity threshold of eIPSCs in 6 neurons, suggesting that only one axon was activated at each site. F, specimen records of eIPSCs from the same SON in ACSF (control traces) and in the presence of the GluR blockers DNQX (10 μm) and APV (50 μm). Individual traces (black) and averages (grey) from 40 trials. Note the lack of contamination by glutamatergic eEPSCs in the postsynaptic responses. Vh=−70 mV, ECl=−21 mV.
After preparation, the slices were stored for at least 1 h at room temperature in artificial cerebrospinal fluid (ACSF) that contained (mm): 125 NaCl, 2 KCl, 10 glucose, 1.25 NaH2PO4, 25 NaHCO3, 2 CaCl2 and 1 MgCl2; the pH was buffered to 7.3 by continuous bubbling with a 5% CO2–95% O2 mixture. The osmolarity was 300 mosmol l−1.
In Q175 mice 1 year old and older, the procedure was somewhat modified to obtain better tissue preservation. Under continuous deep isoflurane anaesthesia, animals were transcardially perfused with ice-cold saline, supplemented with 5 μm glutathione, 500 μm sodium pyruvate and, in a few cases, also 1 μm MK-801. The storage and superfusion solutions did not contain MK-801.
Patch-clamp recordings in acute slices
For electrophysiological tests, slices were placed into a recording chamber (volume ∼0.4 ml) on a microscope stage (Axioscope 2 FS plus; Zeiss, Oberkochen, Germany) equipped with infrared differential interference contrast video microscopy. Slices were submerged with a constant flow of oxygenated ACSF. The flow rate was set to 1–2 ml min−1 using a gravity-driven, manually operated superfusion system. A ×63 or a ×20 water immersion objective (Zeiss, Oberkochen, Germany and Olympus Deutschland GmbH, Hamburg, Germany) was used in all experiments. Inhibitory postsynaptic currents (IPSCs) were recorded using the whole-cell configuration of the patch-clamp technique. If not mentioned otherwise, the intrapipette solution contained (mm): 100 potassium gluconate, 50 KCl, 5 NaCl, 0.5 CaCl2, 5 EGTA, 25 Hepes, 2 MgATP and 0.3 GTP; the pH was set to 7.2 with KOH (low-Cl− solution, calculated equilibrium potential for chloride, ECl=−21 mV). The osmolarity was 329 mosmol l−1. Pipette resistance was 3–6 MΩ when filled with this solution. Electrophysiological signals were acquired using an EPC-8 amplifier (List, Darmstadt, Germany), a 16-bit AD/DA board (ITC-16; HEKA Elektronik, Lambrecht, Germany) and TIDA 4.11 software (HEKA Elektronik). The signals were sampled at a rate of 10 kHz and filtered at 3 kHz. Liquid junction potentials were not corrected. In the voltage-clamp mode, the holding potential was set to −70 mV, which is close to the resting membrane potential of these cells, as recorded in the current-clamp mode immediately after breaking in.
Access resistance was monitored by applying pulses of −10 mV. Cell capacitance and access resistance values were obtained by fitting a mono-exponential function to the capacitance transients. Only recordings with a series resistance below 30 MΩ were accepted (in typical cases, series resistance amounted to 15–20 MΩ). Series resistance compensation was not applied. Cells exhibiting more than 20% change in the access resistance during an experiment were discarded.
Unitary responses at minimal stimulation intensity
Evoked postsynaptic currents were elicited by focal electrical stimulation through a glass pipette filled with ACSF (∼10 MΩ) and positioned in the dorsal striatum, in the vicinity of the recorded neuron (Fig. 1D). Sometimes neurons were filled with Lucifer Yellow, which helped to avoid positions that could lead to direct depolarization of dendrites. An isolated stimulation unit was used to generate rectangular electrical pulses. Pulse duration was set at 0.5 ms. Pulse intensity was adjusted to activate a synaptic response with distinct threshold, as illustrated in Fig. 1E. Stimulation was accepted as minimal if the following criteria were satisfied: (i) eIPSC latency remained stable (<20% fluctuations); (ii) lowering stimulus intensity by 20% resulted in a complete failure of eIPSCs; (iii) an increase in stimulus intensity by 20% changed neither mean eIPSC amplitude nor eIPSC shape; and (iv) there was no contamination by glutamatergic synaptic input (Fig. 1F). Typical current intensities required for minimal stimulation ranged between 0.4 and 0.6 μA. Paired pulses (interstimulus interval 50 ms) were delivered at a frequency of 0.1–0.2 Hz to allow for full recovery of transmitter release.
Although there is no proof that only one axon had been stimulated in any given case, we regard it as highly probable that the responses induced by minimal stimulation were indeed ‘unitary eIPSCs’, i.e. responses to activation of one presynaptic neuron. For the sake of simplicity, evoked IPSCs will in the following be referred to as eIPSCs, assuming that in the vast majority of cases we have dealt with unitary connections.
Solutions and chemicals
All experiments were performed at room temperature (22–25°C). During experiments, 10 μm DNQX and 50 μm dl-2-amino-5-phosphonopentanoic acid (APV) were added to the ACSF to block glutamatergic currents. The remaining postsynaptic currents were completely blocked by bicuculline methiodide (25 μm) or SR-95531 (gabazine; 10 μm), but not strychnine (30 μm), indicating their GABAergic nature. Miniature IPSCs (mIPSCs) were recorded in the presence of the sodium channel blocker TTX (1 μm). Tetrodotoxin was obtained from Alomone Labs (Jerusalem, Israel). The following pharmacological agents were obtained from Tocris (Bristol, UK) and applied at indicated concentrations: LY341495 (40 and 0.1 μm), (RS)-1-aminoindan-1,5-dicarboxylic acid (AIDA; 300 μm), 2-methyl-6-(phenylethynyl)pyridine hydrochloride (MPEP; 1 μm), (2S)-3-(1S)-1-(3,4-dichlorophenyl)ethyl] amino-2-hydroxypropyl](phenylmethyl) phosphinic acid (CGP55845; 1 μm), AM251 (10 μm) and DL-threo-β- benzyloxyaspartate (TBOA; 100 μm). All other chemicals, including guanosine-5′-O-(2-thiodiphosphate) trili- thium salt (GDPβS; 2 mm), were from Sigma-Aldrich (Munich, Germany), and the respective concentrations are given in the Results section.
Data evaluation and statistics
All data was evaluated off-line using TIDA 4.11 (HEKA Elektronik, Lambrecht, Germany), Prism 4 (Graphpad, San Diego, CA, USA) and SPSS 12.0 (SPSS GmbH Software, Munich, Germany). Spontaneous (s) and miniature (m) postsynaptic currents (PSCs) were analysed using an in-house modification of the HEKA software PeakCount V3.2. The program employs a derivative threshold-crossing algorithm to detect individual PSCs. Each automatically detected event was displayed for visual inspection. The PSC rise times and decay time constants (based on a single-exponential fit) were also quantified.
The quantitative results are presented as means ± SEM. The error bars in the figures indicate SEM. Data points and means from CAR mice are presented with grey fill. The numbers in parentheses are the number of tested neurons. Normality of data distributions was evaluated by the Kolmogorov–Smirnov or the Shapiro–Wilk test. Differences between means were determined by Student's paired or unpaired t test, Mann–Whitney U test or ANOVA, as required. Fitting of regression curves to data points was performed on the basis of the Spearman test. The asterisks in the figures indicate the following: *p < 0.05, **p < 0.01 and ***p < 0.001.
Results
Higher excitability and more depolarized membranes of CAR SONs
The ability of synaptically released GABA to inhibit the activity of striatal output neurons may depend on and adjust to a number of variables, including passive membrane properties and resting membrane potential levels. Table 1 summarizes the data obtained in a sample of R6/2 WT and CAR SONs as used for the recording of unitary eIPSCs. In standard conditions (see Methods), the values obtained for the whole-cell input resistance (RN) differed remarkably between WT and CAR SONs. Block of G-protein signalling with GDPβS (2 mm) in the recording solution somewhat attenuated this difference, but did not abolish it, reducing RN both in WT and CAR SONs. In line with these HD-related alterations of RN, CAR SONs also exhibited a significant difference in the rheobasic currents, and they had more positive resting membrane potentials. The values of whole-cell capacitance were slightly lower in CAR SONs, which might reflect a loss of dendritic branches or, less likely, a bias towards smaller dopamine D2 receptor-expressing SONs (Gertler et al. 2008).
Table 1.
Comparison of membrane properties and network activity in R6/2 WT and CAR mice
| WT | CAR | |||||||
|---|---|---|---|---|---|---|---|---|
| Property | Mean | ±SEM | n | Mean | ±SEM | n | p value | Test |
| Membrane potential (mV) | −69.5 | 0.58 | 108 | −60.5 | 0.96 | 101 | <0.0001 | Mann-Whitney’s U test |
| Whole-cell input resistance (MΩ) | ||||||||
| Intracellular standard | 59.2 | 2.50 | 107 | 128.2 | 8.44 | 99 | <0.0001 | Mann-Whitney’s U test |
| Intracellular with GDPβS | 38.1 | 3.10 | 13 | 72.70 | 4.80 | 37 | <0.0010 | Student's unpaired t test |
| Whole-cell capacitance (pF) | 79.7 | 1.91 | 107 | 66.1 | 1.63 | 99 | <0.0001 | Student's unpaired t test |
| Reobasic current (pA) | 189.6 | 11.66 | 71 | 97.3 | 6.14 | 66 | <0.0001 | Mann-Whitney’s U test |
All measurements at a holding voltage Vh=−70 mV and chloride reversal potential ECl=−21 mV. The age of the R6/2 cohort was 78.0 ± 1.1 days, n= 91 vs. CAR 75.0 ± 1.2 days, n= 77 (n.s.). Abbreviations: n, number of neurons; p value, significance level; for all other abbreviations see list on Introduction page.
We conclude that CAR SONs are more excitable than their WT counterparts. Results obtained from a smaller sample of Q175 SONs were in line with this conclusion, except that Q175 CAR SONS were less depolarized (Q175 CAR −66.6 ± 0.7 mV, n= 39 vs. R6/2 CAR −60.5 ± 1.0 mV, n= 101; p= 0.002).
The inhibitory function of GABA in the regulation of striatal network activity
Higher excitability and membrane depolarization may promote spontaneous AP generation in SONs of HD mice. Does GABAergic synaptic transmission respond in a homeostatic manner to the enhanced intrinsic excitability of SONs? Given that the striatum contains mainly GABAergic neurons, the frequency of sIPSCs could serve as a measure of the strength of inhibitory action of GABA and also as an indicator of altered network activity. If inhibition becomes stronger, the frequency of AP-dependent events should decrease. In the case of disinhibition, we should see the opposite, provided that GABA indeed acted as an inhibitory neurotransmitter, not only in WT but also in CAR SONs.
This point was addressed first (Fig. 2A–D) by recording sIPSCs in the continuous presence of the GABAB receptor blocker CGP and the ionotropic glutamate receptor blockers DNQX and APV and by adding exogenous GABA (5 μm). The AP-dependent fraction of sIPSCs could be isolated by recording spontaneous IPSCs in the absence and presence of 1 μm TTX. Tetrodotoxin completely blocked the generation of voltage-activated inward currents. The experiments showed that inhibitory effects of exogenous GABA could be induced only in the absence of TTX, i.e. when allowing for AP generation, thereby validating the TTX-sensitive fraction of sIPSCs in the striatum as a convenient indicator of spontaneous AP generation. A size criterion based on amplitude histograms in the absence and presence of TTX was then defined to detect events that were presumed to be AP-dependent even in standard conditions. Exogenous GABA reduced the frequency of AP-dependent events (Fig. 2C), but the percentage inhibition of the TTX-sensitive sIPSC fraction was smaller in CAR (Fig. 2D). However, exogenous GABA may act through synaptic as well as extrasynaptic GABAA receptors (Ade et al. 2008; Kirmse et al. 2008; Santhakumar et al. 2010); therefore, HD-related differences observed with exogenous GABA may be due to differences in the function of extrasynaptic GABAA receptors. Our main conclusion from this set of observations is that GABAA receptors mediate an inhibitory function not only in WT but also in CAR SONs.
Figure 2. Inhibitory GABA action and Huntington's disease (HD)-related disinhibition of spontaneous activity in R6/2 and Q175 striatal output neurons (SONs).
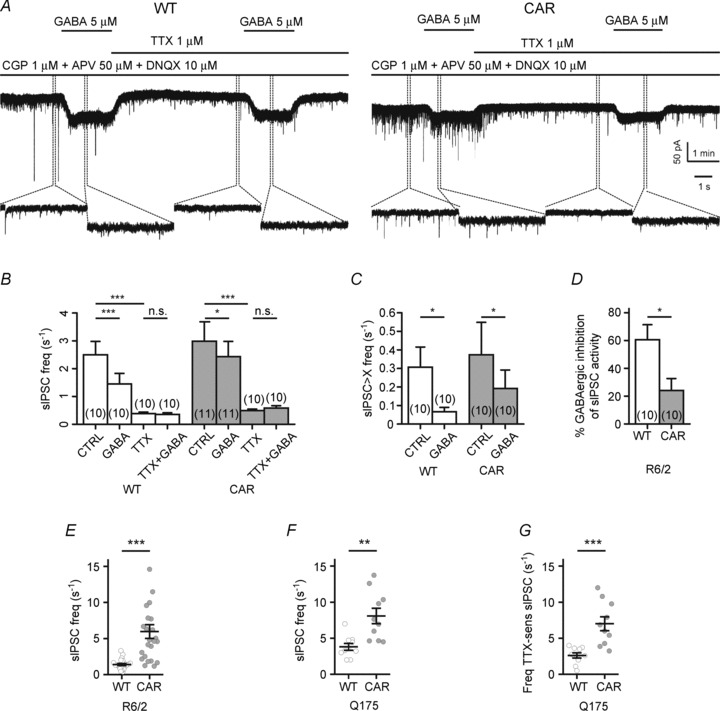
A, sample traces of spontaneous activity in SONs from R6/2 to illustrate GABAA receptor-mediated actions of exogenous GABA (5 μm) in the absence and presence of TTX. In these records, the lower traces represent an expansion from the time interval marked by dotted lines. Note that recordings of spontaneous inhibitory postsynaptic currents (sIPSCs) and miniature inhibitory postsynaptic currents (mIPSCs) were performed in the presence of the GABAB blocker CGP, in addition to the ionotropic glutamate receptor blockers APV and DNQX. CGP attenuates the differences between WT and CAR mice, presumably by removal of a depressant action in WT SONs. B, quantification of sIPSC and mIPSC frequency to illustrate the differential GABAA receptor-mediated effects of exogenous GABA on sIPSCs and mIPSCs. C, effect of exogenous GABA on the frequency of sIPSCs with amplitudes larger than mean + 3 SD (‘sIPSCs > X’). D, quantification of the inhibitory action of exogenous GABA on sIPSC frequency. In any given cell, a 100% inhibitory action corresponds to that of the TTX-induced reduction of sIPSC frequency. E, HD-related differences in the frequency of sIPSCs as recorded from R6/2 SONs in the absence of the GABAB receptor blocker CGP. Note significantly higher sIPSC frequency in R6/2 CAR. F, same conditions as in E, but results are from Q175 and recordings with CsCl-filled electrodes. G, frequency of TTX-sensitive sIPSCs (ordinate), as determined by subtraction of individual frequency values in control conditions and TTX.
Finally, sIPSCs were recorded in standard conditions (no added GABAB receptor blocker, but presence of DNQX and APV), and the results from R6/2 and Q175 are shown in Fig. 2E–G. In both strains of mice, the CAR SONs exhibited higher sIPSC frequencies than the WT. However, in contrast to Cepeda et al. (2004) and Centonze et al. (2005), who reported similar observations before, we regard this finding as evidence for disinhibition of spontaneous AP generation rather than increased strength of GABAergic synaptic transmission.
Basic characteristics of GABAergic eIPSCs in R6/2 and Q175
As therapy of HD relies largely on drugs, including drugs that modify the action of GABA, we sought to obtain more detailed information on the functional properties of GABAergic synaptic connections. Towards this objective, unitary GABAergic synaptic responses were elicited by minimal stimulation in the vicinity of an SON soma or dendrite, as explained in the Methods. This approach reduces the bias for SON–SON connection, which is almost unavoidable when performing paired recordings in the absence of optogenetic tools for the detection and activation of GABAergic interneurons. In the striatum, GABAergic interneurons constitute about 2% of the neuronal population (Tepper & Bolam, 2004).
Figure 3 and Tables 2 and 3 present a summary of the main characteristics of eIPSCs in R6/2 and Q175 mice. It can be seen that in both types of CAR mice the mean eIPSC amplitudes (first eIPSCs in a paired-pulse protocol) were smaller than in WT (Fig. 3A, B, G and H). The loss in amplitude amounted to about one-third of the control value. To clarify the origin of this difference, we next determined the ratio of average to maximal eIPSC amplitudes (Fig. 3C and I). This parameter is presumably independent of quantal size and can therefore be regarded as a measure of presynaptic efficacy, although it depends on the assumption that the maximal response is due to release from all sites. The ratio of mean to maximal eIPSC amplitude was significantly lower in CAR SONs. In line with this result, CAR SONs generally showed higher failure rates than WT SONs (Fig. 3D and J).
Figure 3. Analysis of unitary GABAergic synaptic connections in R6/2 and Q175 reveals HD-related differences in evoked GABA release.
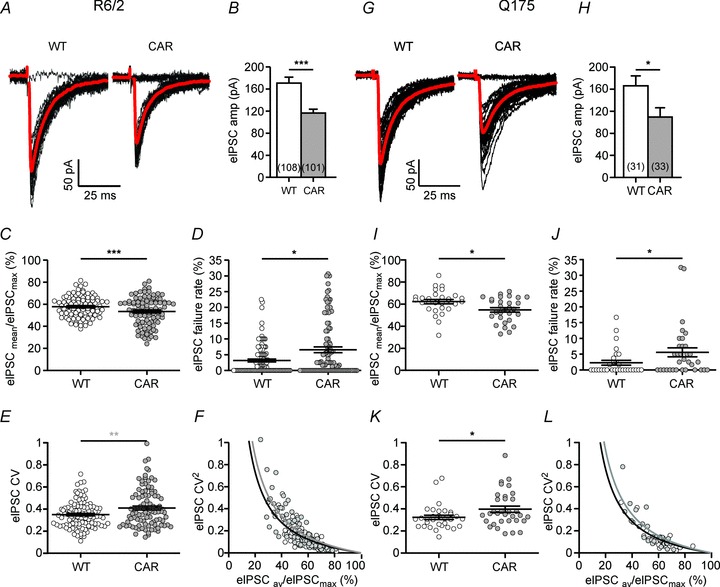
A and G, representative sample traces to illustrate differences in mean amplitude and failure rates. Average from 40 trials in grey. B and H, significant differences of mean unitary eIPSCs, as recorded in standard conditions (in 10 μm DNQX and 50 μm APV). In each SON, the eIPSC amplitude is derived from at least 40 trials. C and I, ratio of mean eIPSC to maximal eIPSC amplitudes as an approximate measure of the average probability of release. The significantly lower value of this ratio in CAR mice indicates a presynaptic deficit in the GABAergic synaptic connections. Note that the values of eIPSCmax are most likely to be underestimated, owing to the relatively low number of trials (40–60). D and J, quantification of the failure rate as an indicator of presynaptic function. Note significantly higher failure rate in CAR mice. E and K, quantification of the coefficient of variation (CV) as another indicator of presynaptic function. Note significantly higher CV in CAR mice. F and L, as predicted on theoretical grounds, there is an inverse relationship between the square of the CV and the ratio of eIPSCav/eIPSCmax.
Table 2.
GABAergic synaptic transmission in R6/2 WT and CAR
| WT | CAR | |||||||
|---|---|---|---|---|---|---|---|---|
| Property | Mean | ±SEM | n | Mean | ±SEM | n | p value | Test |
| Basic characteristics (all connections) | ||||||||
| Mean eIPSC amplitude (pA) | 170.74 | 10.81 | 108 | 116.29 | 6.80 | 101 | <0.0001 | Mann-Whitney’s U test |
| Maximal eIPSC amplitude (pA) | 293.17 | 16.68 | 99 | 201.07 | 9.60 | 93 | <0.0001 | Mann-Whitney’s U test |
| P (mean eIPSC/maximal eIPSC) | 0.58 | 0.01 | 99 | 0.53 | 0.01 | 93 | 0.0076 | Student's unpaired t test |
| eIPSC failure rate (%) | 3.13 | 0.46 | 108 | 6.95 | 0.97 | 101 | 0.0228 | Mann-Whitney’s U test |
| eIPSC CV (coefficient of variation, %) | 35.66 | 1.18 | 107 | 41.54 | 1.78 | 101 | 0.0059 | Student's unpaired t test |
| Asyncronicity index (100 Hz test) | 0.96 | 0.16 | 18 | 2.41 | 0.35 | 16 | 0.0004 | Student's unpaired t test |
| dIPSC integral (pA s) | 4.64 | 0.65 | 18 | 9.64 | 2.02 | 16 | 0.0192 | Student's unpaired t test |
| PPR (eEPSC2/eEPSC1) | 0.71 | 0.01 | 108 | 0.81 | 0.02 | 101 | <0.0001 | Student's unpaired t test |
| PPR % change by CB1 block | None | — | 14 | −7.50 | 3.00 | 9 | 0.0432 | Student's paired t test |
| PPR % change by GABAB receptor block | −7.55 | 2.19 | 14 | None | — | 14 | 0.0195 | Student's paired t test |
| Quantal analysis (based on 100 Hz test) | ||||||||
| Q (median of dIPSC distribution; pA) | 29.46 | 3.03 | 18 | 35.08 | 1.69 | 16 | 0.1273 | Student's unpaired t test |
| N (RRP = cumulative eIPSC at time 0/Q) | 19.39 | 2.69 | 18 | 14.79 | 2.32 | 16 | 0.2113 | Student's unpaired t test |
| Pves (mean eIPSC/Q) | 0.41 | 0.03 | 18 | 0.32 | 0.02 | 16 | 0.0252 | Student's unpaired t test |
| m (mean eIPSC/Q) | 7.04 | 0.65 | 18 | 4.41 | 0.61 | 16 | 0.0062 | Student's unpaired t test |
All measurements were made at Vh=−70 mV and ECl=−21 mV. The recording electrode contained, among other constiuents, 100 mm potassium gluconate and 50 mM KCl. n, number of neurons; p value, significance level; P, probability of release. For other abbreviations see list on Introduction page.
Table 3.
Similar differences between WT and CAR in R6/2 and Q175
| Percentage difference, CAR vs. WT | ||
|---|---|---|
| Property | R6/2 | Q175 |
| SON properties and network activity | ||
| Membrane potential | −12.9 | −7.2 |
| Whole-cell input resistance | 116.7 | 67.0 |
| Rheobasic current | −48.7 | −26.5 |
| Half-effective current | −41.2 | −20.0 |
| Maximal AP frequency | −10.1 | −11.1 |
| sIPSC frequency (KCl) | 427.1 | — |
| sIPSC frequency (CsCl) | — | 404.0 |
| Unitary synaptic connections | ||
| Mean eIPSC amplitude | −31.9 | −34.0 |
| Maximal eIPSC amplitude | −31.4 | −39.9 |
| P (mean eIPSC/maximal eIPSC) | −7.6 | −12.1 |
| eIPSC failure rate | 122.2 | 146.3 |
| eIPSC CV | 16.5 | 23.0 |
| PPR (eEPSC2/eEPSC1) | 14.2 | 16.5 |
| Asynchronicity index (100 Hz test) | 151.1 | 54.8 |
| Pves | −27.7 | −28.8 |
| m (mean eIPSC/Q) | −37.4 | −37.5 |
All evaluated parameters in this table showed statistically significant differences between WT and CAR. Parameters that were not different (for instance, quantal size Q) are omitted. The percent difference is the difference between WT and CAR mean values in % of WT mean. Note that in Q175 the HD-related differences in membrane potential, input resistance, rheobasic current and the asynchrony index were less pronounced. For abbreviations see list on Introduction page.
In order to explore further the possibility that symptomatic CAR mice were suffering from an impairment of GABAergic synaptic input to SONs, we estimated the coefficient of variation (CV) of eIPSCs, because it is known that in the case of low probability of release (P) CV can serve as an indicator of P according to the following equation: CV2= (1 –P)/N×P, where N is the number of release sites (or number of readily releasable vesicles). Indeed, the CV was significantly higher in CAR mice (Fig. 3E and K). Both in WT and in CAR mice, CV2 was inversely related to the ratio of mean to maximal eIPSC amplitude (Fig. 3F and L).
Taken together, these results suggest that in both types of HD mice the CAR SONs exhibited a depression of GABAergic synaptic transmission that originated, at least in part, from a presynaptic deficit.
Responses to high-frequency activation: inhibitory synapses of CAR mice are less robust
It is well known that during HF activation, evoked transmitter release undergoes a depression associated with the depletion of the readily releasable vesicle pool (RRP). In juvenile brain slices, evoked responses to stimulation of GABAergic axons run down after about 20 HF stimuli, while asynchronous release is augmented (Kirischuk et al. 2005). Normal maturation of transmitter release is associated with a relative increase of synchronous vesicle release, whereas modifications of growth conditions and some gene defects can lead to a predominance of asynchronous release (see Grantyn et al. 2011). Tests with HF stimulation could help to reveal synaptic dysfunction and may, in addition, shed light on the mechanism underlying the therapeutic effects of deep brain stimulation in humans.
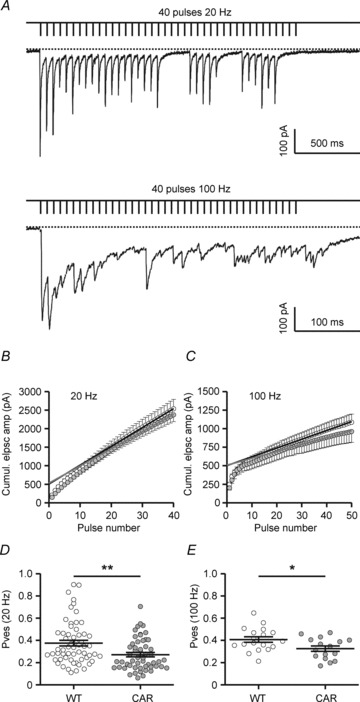
Here we challenged the GABAergic input to SONs with trains of 50 pulses at 20 or 100 Hz. Sites giving rise to unitary eIPSCs at low activation frequencies (0.1667 s−1) were exposed to five HF trains separated by resting periods of 1 min. The absence of long-term changes after HF stimulation is in line with the lack of glutamatergic coactivation when inducing unitary eIPSCs by minimal stimulation. Comparing the responses during the second half of the HF activation period revealed a remarkable difference between WT and CAR SONs (Fig. 4A). In contrast to WT SONs, which continued to generate eIPSCs, CAR SONs switched to a predominantly asynchronous mode of release.
Figure 4. Higher asynchronicity and stronger delayed release in CAR, but lack of differences in the amplitude of delayed inhibitory postsynaptic currents (dIPSCs) in R6/2.
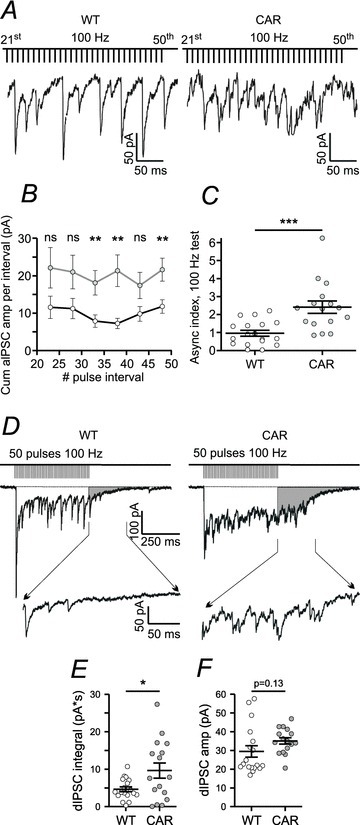
A, sample traces from WT and CAR to illustrate enhanced asynchronicity of synaptic GABA release in CAR. B, quantification of results. Shown is the average value of the cumulative amplitude of all aIPSCs per interval in CAR (filled circles, n= 16) and WT (open circles, n= 16) against interval number. After 30 pulses, this difference is significant. C, quantification of the cumulative amplitude of all aIPSCs per interval divided by the amplitude of the respective stimulus-locked eIPSC. This quotient is referred to as the asynchronicity index. Note that its value is significantly different in WT and CAR mice. D, sample traces from WT and CAR SONs to illustrate the dynamics of evoked transmitter release during conditions of high-frequency activation at 100 Hz. Note differences in delayed release (shaded area) after stimulation. The insets between the arrows show enlarged trace segments with dIPSC activity. E, increased delayed release in CAR mice. F, absence of differences in dIPSC amplitude.
Inhibitory postsynaptic currents occurring during the train but with latencies differing more than 2 ms from the average latency at single-pulse activation were qualified as asynchronous IPSCs (aIPSCs). For each interval, all aIPSCs were added to obtain the average ‘cumulative aIPSC amplitude’ for the five HF trials. Comparison of WT and CAR data showed that this value was significantly higher in CAR mice (Fig. 4B). An asynchronicity index (Tables 2 and 3) was then defined as the ratio of the average cumulative aIPSC amplitude per interval (from the 21st until the last in the train) divided by the average amplitude of solitary eIPSCs induced in the same connection prior to the HF test. It can be seen (Fig. 4C and Tables 2 and 3) that this asynchronicity index is significantly higher in CAR mice, supporting the notion that CAR SONs are more prone to asynchronous synaptic activity.
Next we looked at the synaptic activity immediately after the HF activation. Figure 4D illustrates that this activity declines within about 250 ms in WT and 500 ms in CAR, and is more pronounced in the latter. The IPSCs sampled during a time window of 500 ms after the HF train are referred to as delayed IPSCs (dIPSCs). The integral of the total dIPSC barrage was larger in CAR SONs (Fig. 4E and Table 2), although the amplitudes of individual dIPSCs were not significantly different from each other (Fig. 4F). This further supports the idea of a presynaptic alteration in HD SONs.
Apart from characterizing important aspects of presynaptic function, the samples of dIPSCs after HF trains served an additional purpose, in that they were used to compare quantal size, Q. Assuming that dIPSCs were induced by vesicles liberated from terminals belonging to the unitary connection under test, rather than being generated by random release from other afferents to the same cell (mIPSC activity), we obtained Q on the basis of dIPSC histograms (as illustrated in a previous publication, Kirischuk et al. 2005). No differences in Q were found between WT and CAR (Fig. 4F and Table 2). In Q175 a difference in Q was absent as well (WT 30.0 ± 1.4 pA, n= 25, vs. CAR 27.2 ± 2.0 pA, n= 25).
Estimation of readily releasable pool size and probability of vesicle release in WT and CAR mice
We aimed to compare the presynaptic parameters N and P, following a procedure initially described for the calyx of Held (Sakaba et al. 2002) and later adjusted to GABAergic synaptic connections (Kirischuk et al. 2005; Henneberger et al. 2005). In this type of quantal analysis, the different release sites (terminals) of a unitary connection are lumped together. The parameter N represents one joint pool of readily releasable vesicles (also referred to as readily releasable pool, RRP), disregarding the site at which any given quantum of transmitter is released onto the postsynaptic cell. Accordingly, P now describes the average probability that a given vesicle within that pool is released (Pves), rather than the probability that a particular synapse/active zone releases a quantum of transmitter (Psite). Both RRP size and Pves reflect important aspects of presynaptic function and may be useful for characterizing synapse performance in a murine disease model with a state of GABA signalling that is not yet clear.
The principle of the method has been explained elsewhere (Kirischuk et al. 2005; Grantyn et al. 2011). Briefly, by applying HF stimulation unitary synaptic connections were driven into (partial) depletion of the vesicle pool (Fig. 5A), thereby reaching a state when release and replenishment of the RRP were roughly in equilibrium. In this situation, the relationship between the cumulative eIPSC amplitude and pulse number becomes linear (Fig. 5B and C). Extrapolation from the linear part of the curve to its Y-intercept, i.e. the point of zero stimulation) gives RRP ×Q. Dividing the value of the mean amplitude of solitary eIPSCs recorded after full rest by the Y-intercept value of the extrapolated cumulative eIPSC, one obtains an estimate of Pves that does not require knowledge of Q. It can be seen that at both frequencies Pves was significantly lower in CAR mice (Fig. 5D and E). The average Pves values for all connections submitted to the 20 Hz test were 0.37 ± 0.03, n= 59 in R6/2 WT vs. 0.27 ± 0.02, n= 54 in R6/2 CAR (P < 0.01) and 32.8 ± 3.0, n= 24 in Q175 WT vs. 23.4 ± 2.7, n= 27 in Q175 CAR (P= 0.023). For averages from the 100 Hz test, see Table 2.
Figure 5. Estimation of readily releasable vesicle pool (RRP) size and Pves in R6/2.
A, specimen records from a WT SON to illustrate the switch from mainly synchronous to mainly asynchronous release during a train of high-frequency activation at 100 but not 20 Hz. Data are from the same cell. B and D, summary of results for 20 Hz. C and E, summary of results for 100 Hz. B and C, plots of cumulative eIPSC amplitudes against stimulus number for WT (open circles) and CAR (filled circles). Pooled results from all cells. The Y-intercept extended from the linear part of the plot is assumed to reflect RRP ×Q. D and E, calculation of Pves for single eIPSCs after a period of complete rest (6 s). Pves= eIPSCmean/cumulative eIPSC at point zero (average Y-intercept of cumulative eIPSC value for 5 trials per cell). The value of eIPSCmean was obtained from at least 40 trials at intervals of 6 s sampled prior to the respective depletion test.
Next we tried to determine N (RRP size). To this end, the extrapolated Y-intercept of the cumulative eIPSC must be divided by Q. Values of Q based on dIPSC distributions were available only for connections submitted to the 100 Hz test. The difference in RRP size was not significant (Table 2), although there was a tendency towards lower RRP values in CAR mice. Thus, loss of GABAergic terminals is likely to be mild, if present at all, at this stage of the disease.
Huntington's disease-related presynaptic depression in R6/2 SONs is more pronounced in connections with larger N
Using minimal stimulation to elicit unitary eIPSCs has the disadvantage that the phenotype of the presynaptic cells could not be determined in these HD mice. However, as a first approximation one may assume that responses with N > 7 are most likely to be derived from activating fast spiking interneurons, i.e. they represent interneuron–SON connections, whereas SON–SON connections were expected to produce smaller responses, with N in the range of 1–6 (Koos & Tepper, 1999; Taverna et al. 2008; Tecuapetla et al. 2009). Connections with small N (presumed SON–SON connections) and connections with large N (presumed interneuron–SON connections) were compared, and the results from R6/2 mice are summarized in Table 4. Interestingly, HD-related differences were found in only those connections with large N. Paired recordings will have to be performed to explore further the possibility that HD preferentially affects interneuron–SON connections.
Table 4.
Comparison of eIPSCs in R6/2 WT and CAR based on 20 Hz test according to small RRP (N < 7) and large RRP (N≥ 7)
| WT | CAR | |||||||
|---|---|---|---|---|---|---|---|---|
| Property | Mean | ±SEM | n | Mean | ±SEM | n | p value | Test |
| Small N (SON–SON?) | ||||||||
| Mean eIPSC amplitude (pA) | 84.04 | 9.18 | 28 | 81.96 | 7.48 | 22 | 0.8665 | Student's unpaired t test |
| PPR (eEPSC2/eEPSC1) | 0.74 | 0.03 | 28 | 0.84 | 0.04 | 22 | 0.0823 | Student's unpaired t test |
| Pves (mean eIPSC/cumulative eIPSC at time 0) | 0.45 | 0.04 | 28 | 0.33 | 0.03 | 22 | 0.0503 | Student's unpaired t test |
| Large N (interneuron–SON?) | ||||||||
| Mean eIPSC amplitude (pA) | 205.72 | 20.30 | 29 | 145.23 | 11.37 | 32 | 0.0099 | Student's unpaired t test |
| PPR (eEPSC2/eEPSC1) | 0.71 | 0.02 | 29 | 0.82 | 0.03 | 32 | 0.0052 | Student's unpaired t test |
| Pves (mean eIPSC/cumulative eIPSC at time 0) | 0.32 | 0.02 | 29 | 0.23 | 0.02 | 32 | 0.0043 | Student's unpaired t test |
The tested connections were divided according to their RRP size. Note that connections with small RRP (N < 7) and connections with large RRP (N≥ 7) were differentially affected by HD. For abbreviations see list on Introduction page.
Paired-pulse ratio of eIPSCs as an easily accessible indicator of HD-related deficits in presynaptic function
In the present experimental conditions (Ca2+/Mg2+= 2), all WT and the vast majority of CAR SONs exhibited paired-pulse depression (PPD) at an interstimulus interval of 50 ms (Fig. 6A), and the PPR was significantly higher in CAR mice (Fig. 6B). The amplitude of the second eIPSC was negatively correlated with that of the first eIPSC (Fig. 6C). In line with previous single-synapse-based observations (Kirischuk et al. 2002), it is suggested that this form of PPD is activity-dependent. One could therefore expect that the PPR values were correlated with other presynaptic indicators. Indeed, PPR exhibited an inverse relationship with the ratio of the mean to maximal eIPSCs (Fig. 6D) and a positive correlation with the failure rate (Fig. 6E). Finally, the use of PPR as a parameter reflecting probability of release was directly validated by negative correlation with Pves (Fig. 6F and G), as estimated on the basis of the 20 and 100 Hz tests. The present results are thus consistent with the hypothesis that in CAR SONs higher PPR values were associated with lower Pves.
Figure 6. Differences in the paired-pulse ratios (PPRs) of unitary synaptic connections of WT and CAR mice indicate HD-related alterations in the probability of vesicle release in R6/2.
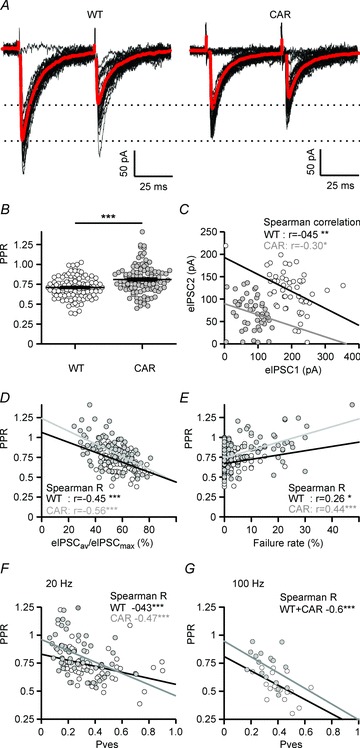
A, sample traces (average in grey) illustrating lower amplitudes of first eIPSCs and higher PPR in CAR mice. B, significantly higher PPR in CAR mice. D–G, validation of PPR as an indicator of presynaptic function. C, negative correlation between the second and first eIPSC amplitude at an interstimulus interval of 50 ms, suggesting that the PPR is release dependent and could therefore be used as an indicator of presynaptic function. D, strong negative correlation between PPR and the eIPSCav/eIPSCmax ratio, in both WT and CAR mice. E, positive correlation between PPR and failure rate. F and G, strong negative correlation between PPR and Pves, as estimated with 20 Hz (F) and 100 Hz trains (G).
As for Q175, the experiments confirmed a significant increase in the PPR of CAR SONs in the total sample (Table 3). The respective values were WT 0.66 ± 0.02, n= 31 vs. CAR 0.77 ± 0.03, n= 33 (P= 0.007). It should be pointed out that the present results from R6/2 heterozygotes at the age of 2–3 months and Q175 homozygotes at 10–12 months may not apply to exactly the same stage of the disease. Nonetheless, it is remarkable that the direction of changes was the same in almost all tested parameters. In Table 3, the respective results are presented as the percentage difference between WT and CAR mice. Together, these data underscore the existence of an HD-related presynaptic alteration of GABAergic synaptic transmission and argue against a postsynaptic deficit as the main cause of reduced eIPSC amplitudes in CAR SONs.
Metabotropic glutamate receptor- and cannabinoid type 1 receptor-mediated depression of synaptic GABA release in CAR but not WT mice
In order to clarify further the mechanism of presynaptic depression in CAR mice, we examined the role of metabotropic glutamate receptors (mGluRs) by presenting LY341495 at a concentration sufficient to block both group I and group II mGluRs. Indeed, with a concentration of LY341495 of 40 μm, the amplitudes of first eIPSCs in CAR SONs increased and the PPR decreased and almost reached the WT level (Fig. 7A–C). When applied at a lower concentration (0.1 μm) to limit the block to group II mGluRs, LY341495 was not effective (not illustrated).
Figure 7. Huntington's disease-related alterations in the presynaptic modulation of synaptic GABA release by metabotropic glutamate receptors (mGluRs) and cannabinoid type 1 (CB1) receptors in R6/2.
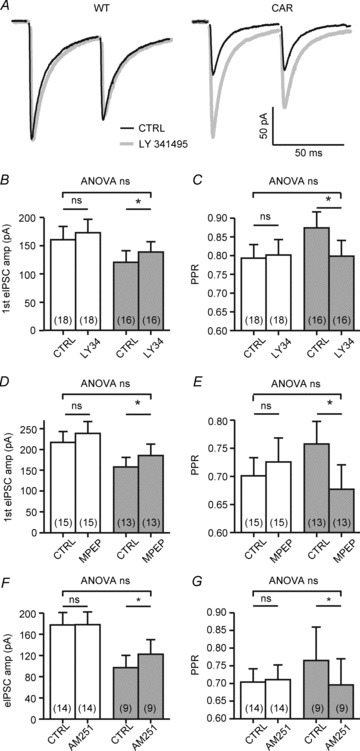
A, sample traces illustrating the effect of the group I mGluR blocker LY341495 (40 μm) on the first eIPSCP amplitudes and PPR. Note that the mGluR block increased the first eIPSCP amplitudes and reduced PPR in CAR but not WT mice. B and C, quantification of results. D and E, similar results were obtained with the specific mGluR5 blocker MPEP (1 μm). F and G, effects of the CB1 receptor blocker AM251 (10 μm) on the first eIPSCP amplitudes and PPR. Note that AM251 increased the first eIPSCP amplitudes and reduced PPR in CAR but not WT mice.
Next we examined the actions of the more specific group I mGluR antagonists AIDA (300 μm) and MPEP (1 μm) and found that the specific mGluR1 blocker AIDA had no effect, while the mGluR5 blocker MPEP produced a partial recovery of synaptic GABA release (Fig. 7D and E). It is concluded that mGluR5 are involved in the tonic depression of synaptic GABA release in HD mice.
Although the mGluR5 block rescued synaptic GABA release, this effect does not necessarily require a presynaptic localization of mGluRs. We therefore considered additional factors, such as presynaptic cannabinoid type 1 (CB1) receptors and the possibility that tonic stimulation of mGluR5 activity could facilitate endocannabinoid release as a retrograde modulator with suppressive action on synaptic GABA release. The CB1 antagonist AM251 (10 μm) was applied in R6/2 slices. Again, recovery from presynaptic depression was observed only in CAR mice, where the first eIPSC increased (Fig. 7F) and PPR decreased (Fig. 7G) under the influence of AM251 treatment.
Similar results were obtained with AM251 in Q175 mice (Fig. 8A–D). In these experiments, we also tested the possibility that the effects of AM251 and MPEP were additive. It was found that in Q175 AM251 produced a nearly complete recovery of eIPSC characteristics (not in the case of failure rate), and subsequent MPEP application did not add to this action, suggesting that the mGluR-mediated depression of GABA release was entirely implemented via CB1.
Figure 8. The HD-related suppression of synaptic GABA release is abolished by CB1 block and inactivation of postsynaptic G-protein signalling in Q175.
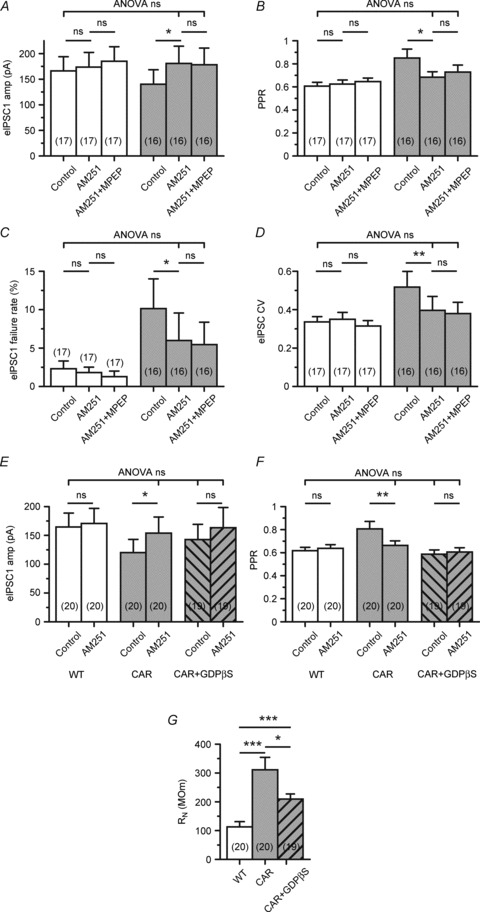
A–D, quantification of experiments in which the mGluR5 blocker MPEP was added after the CB1 blocker AM251. Note that in Q175 homozygotes CB1 block restored all parameters to WT levels (except failure rate), without MPEP adding to the effect of AM251. E and F, block of postsynaptic G-protein signalling by perfusion of the postsynaptic neuron with GTPβS prevents the suppression of synaptic GABA release in CAR mice and, accordingly, an effect of AM251 on the amplitude and PPR of eIPSCs. G, input resistance is also recovered, but not completely back to the WT level.
The possibility remained that the GABAergic terminals innervating any given SON could be suppressed by eCBs released from other cells, such as astrocytes that also express mGluR5 (Ciccarelli et al. 1997) and produce eCBs (Walter et al. 2004). To clarify this point, we perfused the recorded SONs for 10 min with GDPβS, which is a non-hydrolysable GDP analogue that prevents G-protein-mediated signalling by freezing the G-protein in an inactive conformation. The results of this test are presented in Fig. 8E–G. In conditions of postsynaptic G-protein block, CAR eIPSC amplitudes and PPR were no longer different from WT, and AM241 failed to increase release probability. As in R6/2, intracellular GDPβS decreased RN (Fig. 8G), which makes it unlikely that the recovery of amplitude would be due to enhanced charge transfer from dendrites.
One can conclude that the HD-related suppression of synaptic GABA release relies on a retrograde mGluR5/CB1-dependent signalling pathway.
Discussion
By using two mouse models of HD and by verifying the paired-pulse ratio as a reliable indicator of presynaptic depression of GABAergic inputs to SONs, we have identified a set of HD-related alterations of synaptic GABA release in the striatum. The changes described can be referred to as a glutamate-induced form of suppression of inhibition that is similar to but not identical to the well-known depolarization-induced suppression of inhibition (for an update, see Alger, 2012). In contrast to some forms of depolarization-induced suppression of inhibition, where suppression of inhibition had been induced by excessive activation of glutamatergic synaptic afferents (Chevaleyre & Castillo, 2003; Henneberger et al. 2007) or strong depolarization of the postsynaptic neuron (Narushima et al. 2006), the presently discussed mechanism is active at rest, i.e. in the absence of evoked glutamatergic synaptic input.
Although HF activation of synaptic glutamate release is not required to induce depression in the HD striatum, the likelihood of detecting it in in vitro conditions may depend on the capacity of SONs to generate large AP-dependent sEPSCs. In a previously described case of mGluR5/CB1-dependent suppression of synaptic GABA release in the visual system (Henneberger et al. 2007), the mere presence of visual cortex explants in contact with dissociated GABAergic tectal neurons enabled both AP-dependent sEPSC generation and tonic, but reversible, depression of synaptic GABA release. At least in our hands, this critical AP-dependent fraction of large sEPSCs was smaller in horizontal or coronal slices, as used in preceding studies on GABAergic synaptic transmission in HD (Cepeda et al. 2004; Centonze et al. 2005). Thus, differences in the preservation of glutamatergic fibres in the striatum may affect the results obtained for GABAergic synapses.
The hypothetical cause of tonic mGluR5 activity in HD and the following steps in the pathophysiological scenario leading to suppression of GABA release are summarized in Fig. 9, disregarding, for the moment, additional HD-related changes on the postsynaptic side. The underlying assumption is that the HD-related suppression of inhibition reflects a state of imbalance between glutamate and GABA.
Figure 9. Signals involved in the HD-related suppression of inhibition in the murine striatum.
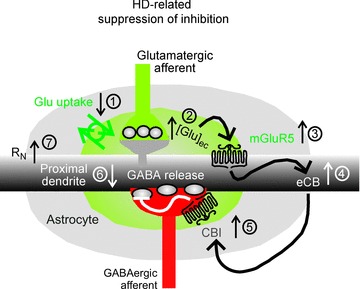
The tonic HD-related suppression of inhibition is conceived as a possible consequence of impaired astrocytic glutamate uptake (1) leading to an elevation of perisynaptic glutamate concentration (2) sufficient to activate mGluR5 (3), which in turn stimulates the formation and release of an endocannabinoid (eCB; 4). The eCB retrogradely activates CB1 on GABAergic synaptic terminals (5). The final result is a reduced probability of synaptic GABA release (6), as evidenced by reduced eIPSC amplitude and increased paired-pulse ratio. This response is non-homeostatic with respect to the HD-induced change of RN (7). Our present results provide support for steps 3–7 in HD but not WT mice. For abbreviations see list on Introduction page.
Increased intrinsic excitability and reduced synaptic GABA release as a basis of higher levels of striatal output activity
It is already well known that R6/2 SONs experience a massive growth of RN and, consequently, a rise of intrinsic excitability (Klapstein et al. 2001; Cepeda et al. 2001, 2004). The Q175 SONs did not make an exception to this rule. As the increase of RN combines with a reduced efficacy of GABAergic inhibition, one could predict an increase in the spontaneous network activity, as recently reported for the striatum of awake R6/2 mice (Miller et al. 2011). Our approach, although indirect, suggests that striatal AP frequency is also enhanced in HD slices.
The cause of RN elevation has remained unclear. A factor to be considered in this regard is the dopamine deficiency in the striatum. Although R6/2 mice were produced with the aim of providing a model for HD, R6/2 heterozygotes at the age of 2–3 months are akinetic rather than choreic. Their striatum exhibits a significant reduction of dopamine release (Johnson et al. 2006), along with a substantial downregulation of dopamine D1 receptor expression and signalling (Cha et al. 1998; Azdad et al. 2009). Experimental dopamine depletion seems to increase the excitability of SONs (for instance, see Azdad et al. 2009). At the same time, D1 activation is known to depress a group of potassium channels that are specifically engaged in the transition from the strongly hyperpolarized ‘down’ state to the more depolarized ‘up’ state, an effect promoted by the D1-mediated increase of RN (see Surmeier et al. 2007). Our experiments with GDPβS are in line with the recently proposed dominant role of G-protein-coupled inwardly rectifying potassium channels (GIRK) in defining the resting membrane conductance of medium spiny neurons in the nucleus accumbens (Podda et al. 2010).
Validation of the paired-pulse ratio of eIPSC amplitudes for estimation of presynaptic modulatory actions
Our conclusions regarding the HD-related suppression of inhibition in the striatum rely largely on paired-pulse analysis and its validation by quantal analysis. We have used a relatively unconventional method for extracting the quantal parameters N, P and Q, the method of HF-induced depletion (for details, see Schneggenburger et al. 2002; Grantyn et al. 2011), while recent studies on GABAergic synaptic transmission in the striatum have mainly applied variance-mean analysis to synaptic responses recorded from neuron pairs (Koos & Tepper, 1999; Taverna et al. 2008; Tecuapetla et al. 2009). In comparison with the Q values obtained by previous studies and our own unpublished material from adult C57Bl6 mice (A. Dvorzhak & R. Grantyn, unpublished observations) the present Q values deduced from dIPSC histograms after 100 Hz trains (Table 2) are generally lower by about 30%, which could be one of the reasons why our RRP values are in general somewhat higher than the ‘number of sites’ obtained by Tepper and colleagues for interneuron–SON connections (Koos & Tepper, 1999; Tecuapetla et al. 2009). Although there could be method-based differences in the estimates obtained for Q and RRP (N), which would prevent direct comparison with other studies, it appears very likely that HD-related differences in the number of postsynaptic receptors or the number of vesicles available for release are small, if present at all. This also argues against defects in vesicle recycling in the still functional interneuron–SON connections. The observed HD-related differences in GABAergic synaptic transmission primarily reflect differences in Pves, a parameter that can be estimated without knowing Q. In any case, the consistency of results with a whole battery of functional indicators (mean/maximal eIPSC amplitude, CV, failure rate, PPR and Pves) leaves little doubt that the HD state is associated with a deficit in synaptic GABA release.
Glutamate-induced retrograde eCB signalling as the mechanism underlying the tonic suppression of synaptic inhibition in HD mice
The most likely cause of tonic mGluR5 activity is an insufficiency of astrocytic glutamate uptake, as reported for HD mice by others (Liévens et al. 2001; Estrada-Sánchez et al. 2009) and supported by our own unpublished observations of reduced glutamate transporter currents in striatal astrocytes of R6/2 mice (A. Dvorzhak and R. Grantyn). If this deficit is strong enough to elevate glutamate concentrations and to activate mGluR5 in the vicinity of GABAergic synapses, this may induce neuronal release of eCBs.
It is known that neuronal mGluR5 are mostly, but not exclusively, located perisynaptically on dendrites (Kuwajima et al. 2007), but presynaptic mGluR5 do exist in the rodent striatum (Romano et al. 1995), and there might be mGluR5 on astrocytes. The production of 2-arachidonoylglycerol in response to ATP was shown in cultured astrocytes, and 2-arachidonoylglycerol has been proposed to act as a gliotransmitter (Walter et al. 2004). Cultured striatal astrocytes were found to respond to cannabinoid stimulation (Venance et al. 1995), and astrocytes in the hippocampus were shown to express CB1, which stimulates the astrocytic release of glutamate (Navarrete & Araque, 2010).
Sensitivity of synaptic GABA release to pharmacological CB1 activation has been reported both for interneuron– SON and for SON–SON connections (Köfalvi et al. 2005; Freiman et al. 2006; Centonze et al. 2007; Narushima et al. 2007; Adermark & Lovinger, 2007), although the effect was more obvious in the former. We used the method of unblocking to identify the tonic endogenous suppression of synaptic GABA release and observed that the CB1-dependent suppression of synaptic GABA release is active in CAR, but not in WT mice. This is interesting because it has repeatedly been suggested that in HD mice CB1 receptor expression is downregulated (see Denovan-Wright & Robertson, 2000 for recent data on CB1 at GABAergic synaptic terminals in the striatum of R6/2). In view of the present results, the HD-related decrease of CB1 is tentatively regarded as an adaptive response that, to some degree, counteracts the high excitability of SONs.
In view of the findings described above, one may consider the following four principal and not mutually exclusive possibilities for how the mGluR5/ CB1- dependent suppression of inhibition could be initiated or enhanced: (i) activation of postsynaptic mGluR5 in SONs and subsequent release of an eCB as a retrograde messenger to CB1 on GABAergic terminals; (ii) direct activation of presynaptic mGluR5 by ambient glutamate, in addition to (i); (iii) neuronal endocannabinoid release, activation of astrocytic CB1, Ca2+-dependent release of glutamate from astrocytes and presynaptic mGluR5-dependent depression of GABAergic terminals; and (iv) astrocytic mGluR5 activity and release of an astrocytic eCB.
To elucidate the relative significance of the above mechanisms, it was necessary to address the following two most critical issues. Are there any suppressive mGluR5 actions adding to the CB1 effect on synaptic GABA release? Does postsynaptic block of Gq signalling prevent the CB1-dependent suppression, thereby excluding other than postsynaptic sources of eCB? It was found that mGluR block did not add to the eCB block with AM251; therefore we excluded a contribution of presynaptic mGluR5 on GABAergic terminals and disregarded mechanisms (ii) and (iii). By demonstrating the absence of CB1-dependent depression of GABA release and loss of HD-related differences after intracellular treatment with GDPβS, we also excluded other cells as source of eCBs in the signalling pathway of HD-related suppression of inhibition and disregarded mechanism (iv). The remaining and currently most compelling hypothesis is that, for reasons of proximity, eCBs preferentially suppress GABAergic terminals in direct contact with the given neuronal source of eCB.
Possible region- and cell-type-dependent differences in the alteration of synaptic GABA release by expression of mhtt
Recordings from the cerebral cortex unravelled a presynaptic deficit of GABAergic synaptic transmission in HD mice (Gu et al. 2005; Cummings et al. 2009), but it was assumed that regional or cell-type-specific differences could influence the susceptibility of GABAergic terminals to HD-related alterations (Cummings et al. 2009). Our data provide preliminary support to this idea by showing that only connections with large N exhibit the mhtt-related depression of synaptic GABA release.
Of course, our separation of GABAergic connections according to N can only be regarded as tentative. It reflects the currently prevailing understanding that, compared with SON–SON connections, interneuron–SON connections are stronger with regard to coupling incidence, failure rates and number of involved release sites (for review, see Tepper et al. 2008). It became clear, however, that SON–SON connections might be more heterogeneous than initially envisaged. Notably, some D2–D2 SON pairs were shown to produce large eIPSCs as well (Tecuapetla et al. 2009); therefore, they may also be part of the present ‘large N’ sample.
Conclusion
This study has focused on presynaptic aspects of GABA signalling in the striatum and provides new evidence for a form of glutamate-induced suppression of inhibition regulating the balance between ambient glutamate levels and strength of GABA release. Central to this effect is the tonic activity of mGluR5 and the retrograde action of eCB(s), as observed in two mouse models of HD but not in normal mice. The role of deficient glutamate uptake in the maintenance of tonic mGluR activity needs further research.
Acknowledgments
We thank our colleagues David Betances MA and Anna Wojtowicz PhD for their helpful comments on the manuscript. Anna Wojtowicz contributed to the recordings of Fig. 2E–G. This work was supported by the CHDI foundation (A-2644 and A-4480), the German Research Council DFG (Gr986/9-7, Gr986/10-1 and Exc 257/1) and Charité Research Funds (09/42592).
Glossary
- ACSF
artificial cerebrospinal fluid
- AIDA
(RS)-1-aminoindan-1,5-dicarboxylic acid
- aIPSCs
asynchronous inhibitory postsynaptic currents
- AP
action potential
- APV
DL-2-amino-5-phosphonopentanoic acid
- CAR mice
mice carrying a mutant form of huntingtin
- CB1 receptor
cannabinoid type 1 receptor
- CV
coefficient of variation
- dIPSCs
delayed inhibitory postsynaptic currents
- DNQX
6,7-dinitroquinoxaline-2,3(1H,4H)-dione
- eCB
endocannabinoid
- ECl
chloride reversal potential
- eIPSC
evoked inhibitory postsynaptic current
- Freq
frequency
- HD
Huntington's disease
- HF
high frequency
- mIPSC
miniature inhibitory postsynaptic current
- MPEP
2-methyl-6-(phenylethynyl)pyridine hydrochloride
- PPD
paired-pulse depression
- PPR
paired-pulse ratio
- PSC
postsynaptic current
- RN
whole cell input resistance
- RRP
readily releasable vesicle pool
- sIPSC
spontaneous inhibitory postsynaptic current
- SNR
substantia nigra pars reticulata
- SON
striatal output neuron
- Str
striatum
- Vh
holding potential
- WT
wild-type. Parameters of quantal analysis
- Q
quantal size of postsynaptic current
- N
number of available vesicles (or readily releasable vesicle pool, RRP)
- Pves
average probability that a vesicle of a unitary vesicle pool is released
- m
average quantal content of a postsynaptic response
Author contributions
The experiments were performed in the Berlin laboratory directed by R.G. Conception, design and interpretation of the experiments were done by R.G. Collection, analysis and interpretation of data was done by A.D. M.S. contributed some data to Fig. 2 and participated in data analysis. Drafting the article and revising it critically was done jointly by R.G. and D.S.F. All authors approved the final version of the manuscript.
References
- Ade KK, Janssen MJ, Ortinski PI, Vicini S. Differential tonic GABA conductances in striatal medium spiny neurons. J Neurosci. 2008;28:1185–1197. doi: 10.1523/JNEUROSCI.3908-07.2008. [DOI] [PMC free article] [PubMed] [Google Scholar]
- Adermark L, Lovinger DM. Retrograde endocannabinoid signaling at striatal synapses requires a regulated postsynaptic release step. Proc Natl Acad Sci U S A. 2007;104:20564–20569. doi: 10.1073/pnas.0706873104. [DOI] [PMC free article] [PubMed] [Google Scholar]
- Alger BE. Endocannabinoids at the synapse a decade after the dies mirabilis (29 March 2001): what we still do not know. J Physiol. 2012;590:2203–2212. doi: 10.1113/jphysiol.2011.220855. [DOI] [PMC free article] [PubMed] [Google Scholar]
- Azdad K, Chàvez M, Don BP, Wetzelaer P, Marescau B, De Deyn PP, Gall D, Schiffmann SN. Homeostatic plasticity of striatal neurons intrinsic excitability following dopamine depletion. PLoS One. 2009;4:e6908. doi: 10.1371/journal.pone.0006908. [DOI] [PMC free article] [PubMed] [Google Scholar]
- Bosch C, Mailly P, Degos B, Deniau JM, Venance L. Preservation of the hyperdirect pathway of basal ganglia in a rodent brain slice. Neuroscience. 2012;215:31–41. doi: 10.1016/j.neuroscience.2012.04.033. [DOI] [PubMed] [Google Scholar]
- Centonze D, Rossi S, Prosperetti C, Gasperi V, De Chiara V, Bari M, Tscherter A, Febbraro F, Bernardi G, Maccarrone M. Endocannabinoids limit metabotropic glutamate 5 receptor-mediated synaptic inhibition of striatal principal neurons. Mol Cell Neurosci. 2007;35:302–310. doi: 10.1016/j.mcn.2007.03.005. [DOI] [PubMed] [Google Scholar]
- Centonze D, Rossi S, Prosperetti C, Tscherter A, Bernardi G, Maccarrone M, Calabresi P. Abnormal sensitivity to cannabinoid receptor stimulation might contribute to altered gamma-aminobutyric acid transmission in the striatum of R6/2 Huntington's disease mice. Biol Psychiatry. 2005;57:1583–1589. doi: 10.1016/j.biopsych.2005.03.008. [DOI] [PubMed] [Google Scholar]
- Cepeda C, Ariano MA, Calvert CR, Flores-Hernández J, Chandler SH, Leavitt BR, Hayden MR, Levine MS. NMDA receptor function in mouse models of Huntington disease. J Neurosci Res. 2001;66:525–539. doi: 10.1002/jnr.1244. [DOI] [PubMed] [Google Scholar]
- Cepeda C, Cummings DM, André VM, Holley SM, Levine MS. Genetic mouse models of Huntington's disease: focus on electrophysiological mechanisms. ASN Neuro. 2010;2:e00033. doi: 10.1042/AN20090058. [DOI] [PMC free article] [PubMed] [Google Scholar]
- Cepeda C, Starling AJ, Wu N, Nguyen OK, Uzgil B, Soda T, Andre VM, Ariano MA, Levine MS. Increased GABAergic function in mouse models of Huntington's disease: reversal by BDNF. J Neurosci Res. 2004;78:855–867. doi: 10.1002/jnr.20344. [DOI] [PubMed] [Google Scholar]
- Cha JH, Kosinski CM, Kerner JA, Alsdorf SA, Mangiarini L, Davies SW, Penney JB, Bates GP, Young AB. Altered brain neurotransmitter receptors in transgenic mice expressing a portion of an abnormal human Huntington disease gene. Proc Natl Acad Sci U S A. 1998;95:6480–6485. doi: 10.1073/pnas.95.11.6480. [DOI] [PMC free article] [PubMed] [Google Scholar]
- Chevaleyre V, Castillo PE. Heterosynaptic LTD of hippocampal GABAergic synapses: a novel role of endocannabinoids in regulating excitability. Neuron. 2003;38:461–472. doi: 10.1016/s0896-6273(03)00235-6. [DOI] [PubMed] [Google Scholar]
- Ciccarelli R, Sureda FX, Casabona G, Di Iorio P, Caruso A, Spinella F, Condorelli DF, Nicoletti F, Caciagli F. Opposite influence of the metabotropic glutamate receptor subtypes mGlu3 and -5 on astrocyte proliferation in culture. Glia. 1997;21:390–398. doi: 10.1002/(sici)1098-1136(199712)21:4<390::aid-glia6>3.0.co;2-7. [DOI] [PubMed] [Google Scholar]
- Cummings DM, André VM, Uzgil BO, Gee SM, Fisher YE, Cepeda C, Levine MS. Alterations in cortical excitation and inhibition in genetic mouse models of Huntington's disease. J Neurosci. 2009;29:10371–10386. doi: 10.1523/JNEUROSCI.1592-09.2009. [DOI] [PMC free article] [PubMed] [Google Scholar]
- Denovan-Wright EM, Robertson HA. Cannabinoid receptor messenger RNA levels decrease in a subset of neurons of the lateral striatum, cortex and hippocampus of transgenic Huntington's disease mice. Neuroscience. 2000;98:705–713. doi: 10.1016/s0306-4522(00)00157-3. [DOI] [PubMed] [Google Scholar]
- Estrada-Sánchez AM, Montiel T, Segovia J, Massieu L. Glutamate toxicity in the striatum of the R6/2 Huntington's disease transgenic mice is age-dependent and correlates with decreased levels of glutamate transporters. Neurobiol Dis. 2009;34:78–86. doi: 10.1016/j.nbd.2008.12.017. [DOI] [PubMed] [Google Scholar]
- Freiman I, Anton A, Monyer H, Urbanski MJ, Szabo B. Analysis of the effects of cannabinoids on identified synaptic connections in the caudate-putamen by paired recordings in transgenic mice. J Physiol. 2006;575:789–806. doi: 10.1113/jphysiol.2006.114272. [DOI] [PMC free article] [PubMed] [Google Scholar]
- Gauthier LR, Charrin BC, Borrell-Pagès M, Dompierre JP, Rangone H, Cordelières FP, De Mey J, MacDonald ME, Lessmann V, Humbert S, Saudou F. Huntingtin controls neurotrophic support and survival of neurons by enhancing BDNF vesicular transport along microtubules. Cell. 2004;118:127–138. doi: 10.1016/j.cell.2004.06.018. [DOI] [PubMed] [Google Scholar]
- Gertler TS, Chan CS, Surmeier DJ. Dichotomous anatomical properties of adult striatal medium spiny neurons. J Neurosci. 2008;28:10814–10824. doi: 10.1523/JNEUROSCI.2660-08.2008. [DOI] [PMC free article] [PubMed] [Google Scholar]
- Grantyn R, Henneberger C, Jüttner R, Meier JC, Kirischuk S. Functional hallmarks of GABAergic synapse maturation and the diverse roles of neurotrophins. Front Cell Neurosci. 2011;5:13. doi: 10.3389/fncel.2011.00013. [DOI] [PMC free article] [PubMed] [Google Scholar]
- Gu X, Li C, Wei W, Lo V, Gong S, Li SH, Iwasato T, Itohara S, Li XJ, Mody I, Heintz N, Yang XW. Pathological cell-cell interactions elicited by a neuropathogenic form of mutant Huntingtin contribute to cortical pathogenesis in HD mice. Neuron. 2005;46:433–444. doi: 10.1016/j.neuron.2005.03.025. [DOI] [PubMed] [Google Scholar]
- Hackam AS, Singaraja R, Wellington CL, Metzler M, McCutcheon K, Zhang T, Kalchman M, Hayden MR. The influence of huntingtin protein size on nuclear localization and cellular toxicity. J Cell Biol. 1998;141:1097–1105. doi: 10.1083/jcb.141.5.1097. [DOI] [PMC free article] [PubMed] [Google Scholar]
- Henneberger C, Kirischuk S, Grantyn R. Brain-derived neurotrophic factor modulates GABAergic synaptic transmission by enhancing presynaptic glutamic acid decarboxylase 65 levels, promoting asynchronous release and reducing the number of activated postsynaptic receptors. Neuroscience. 2005;135:749–763. doi: 10.1016/j.neuroscience.2005.06.044. [DOI] [PubMed] [Google Scholar]
- Henneberger C, Redman SJ, Grantyn R. Cortical efferent control of subcortical sensory neurons by synaptic disinhibition. Cereb Cortex. 2007;17:2039–2049. doi: 10.1093/cercor/bhl112. [DOI] [PubMed] [Google Scholar]
- Johnson MA, Rajan V, Miller CE, Wightman RM. Dopamine release is severely compromised in the R6/2 mouse model of Huntington's disease. J Neurochem. 2006;97:737–746. doi: 10.1111/j.1471-4159.2006.03762.x. [DOI] [PubMed] [Google Scholar]
- Kirischuk S, Clements JD, Grantyn R. Presynaptic and postsynaptic mechanisms underlie paired pulse depression at single GABAergic boutons. J Physiol. 2002;543:99–116. doi: 10.1113/jphysiol.2002.021576. [DOI] [PMC free article] [PubMed] [Google Scholar]
- Kirischuk S, Jüttner R, Grantyn R. Time-matched pre- and postsynaptic changes of GABAergic synaptic transmission in the developing mouse superior colliculus. J Physiol. 2005;563:795–807. doi: 10.1113/jphysiol.2004.081216. [DOI] [PMC free article] [PubMed] [Google Scholar]
- Kirmse K, Kirischuk S, Grantyn R. Activity of the GABA transporter 1 regulates GABAergic synaptic transmission in striatal projection neurons. J Physiol. 2008;586:5665–5678. doi: 10.1113/jphysiol.2008.161943. [DOI] [PMC free article] [PubMed] [Google Scholar]
- Klapstein GJ, Fisher RS, Zanjani H, Cepeda C, Jokel ES, Chesselet MF, Levine MS. Electrophysiological and morphological changes in striatal spiny neurons in R6/2 Huntington's disease transgenic mice. J Neurophysiol. 2001;86:2667–2677. doi: 10.1152/jn.2001.86.6.2667. [DOI] [PubMed] [Google Scholar]
- Köfalvi A, Rodrigues RJ, Ledent C, Mackie K, Vizi ES, Cunha RA, Sperlágh B. Involvement of cannabinoid receptors in the regulation of neurotransmitter release in the rodent striatum: a combined immunochemical and pharmacological analysis. J Neurosci. 2005;25:2874–2884. doi: 10.1523/JNEUROSCI.4232-04.2005. [DOI] [PMC free article] [PubMed] [Google Scholar]
- Koos T, Tepper JM. Inhibitory control of neostriatal projection neurons by GABAergic interneurons. Nat Neurosci. 1999;2:467–472. doi: 10.1038/8138. [DOI] [PubMed] [Google Scholar]
- Kremer B, Squitieri F, Telenius H, Andrew SE, Theilmann J, Spence N, Goldberg YP, Hayden MR. Molecular analysis of late onset Huntington's disease. J Med Genet. 1993;30:991–995. doi: 10.1136/jmg.30.12.991. [DOI] [PMC free article] [PubMed] [Google Scholar]
- Kuwajima M, Dehoff MH, Furuichi T, Worley PF, Hall RA, Smith Y. Localization and expression of group I metabotropic glutamate receptors in the mouse striatum, globus pallidus, and subthalamic nucleus: regulatory effects of MPTP treatment and constitutive Homer deletion. J Neurosci. 2007;27:6249–6260. doi: 10.1523/JNEUROSCI.3819-06.2007. [DOI] [PMC free article] [PubMed] [Google Scholar]
- Levine MS, Cepeda C, Hickey MA, Fleming SM, Chesselet MF. Genetic mouse models of Huntington's and Parkinson's diseases: illuminating but imperfect. Trends Neurosci. 2004;27:691–697. doi: 10.1016/j.tins.2004.08.008. [DOI] [PubMed] [Google Scholar]
- Li XJ, Li S. Proteasomal dysfunction in aging and Huntington disease. Neurobiol Dis. 2011;43:4–8. doi: 10.1016/j.nbd.2010.11.018. [DOI] [PMC free article] [PubMed] [Google Scholar]
- Liévens JC, Woodman B, Mahal A, Spasic-Boscovic O, Samuel D, Kerkerian-Le Goff L, Bates GP. Impaired glutamate uptake in the R6 Huntington's disease transgenic mice. Neurobiol Dis. 2001;8:807–821. doi: 10.1006/nbdi.2001.0430. [DOI] [PubMed] [Google Scholar]
- Lu XH. BAC to degeneration bacterial artificial chromosome (BAC)-mediated transgenesis for modeling basal ganglia neurodegenerative disorders. Int Rev Neurobiol. 2009;89:37–56. doi: 10.1016/S0074-7742(09)89002-8. [DOI] [PubMed] [Google Scholar]
- Mangiarini L, Sathasivam K, Seller M, Cozens B, Harper A, Hetherington C, Lawton M, Trottier Y, Lehrach H, Davies SW, Bates GP. Exon 1 of the HD gene with an expanded CAG repeat is sufficient to cause a progressive neurological phenotype in transgenic mice. Cell. 1996;87:493–506. doi: 10.1016/s0092-8674(00)81369-0. [DOI] [PubMed] [Google Scholar]
- Menalled L, El Khodor BF, Patry M, Suárez-Fariñas M, Orenstein SJ, Zahasky B, Leahy C, Wheeler V, Yang XW, MacDonald M, Morton AJ, Bates G, Leeds J, Park L, Howland D, Signer E, Tobin A, Brunner D. Systematic behavioral evaluation of Huntington's disease transgenic and knock-in mouse models. Neurobiol Dis. 2009;35:319–336. doi: 10.1016/j.nbd.2009.05.007. [DOI] [PMC free article] [PubMed] [Google Scholar]
- Menalled LB. Knock-in mouse models of Huntington's disease. NeuroRx. 2005;2:465–470. doi: 10.1602/neurorx.2.3.465. [DOI] [PMC free article] [PubMed] [Google Scholar]
- Menalled LB, Sison JD, Dragatsis I, Zeitlin S, Chesselet MF. Time course of early motor and neuropathological anomalies in a knock-in mouse model of Huntington's disease with 140 CAG repeats. J Comp Neurol. 2003;465:11–26. doi: 10.1002/cne.10776. [DOI] [PubMed] [Google Scholar]
- Miller BR, Walker AG, Barton SJ, Rebec GV. Dysregulated neuronal activity patterns implicate corticostriatal circuit dysfunction in multiple rodent models of Huntington's disease. Front Syst Neurosci. 2011;5:26. doi: 10.3389/fnsys.2011.00026. [DOI] [PMC free article] [PubMed] [Google Scholar]
- Milnerwood AJ, Cummings DM, Dallérac GM, Brown JY, Vatsavayai SC, Hirst MC, Rezaie P, Murphy KP. Early development of aberrant synaptic plasticity in a mouse model of Huntington's disease. Hum Mol Genet. 2006;15:1690–1703. doi: 10.1093/hmg/ddl092. [DOI] [PubMed] [Google Scholar]
- Milnerwood AJ, Gladding CM, Pouladi MA, Kaufman AM, Hines RM, Boyd JD, Ko RW, Vasuta OC, Graham RK, Hayden MR, Murphy TH, Raymond LA. Early increase in extrasynaptic NMDA receptor signaling and expression contributes to phenotype onset in Huntington's disease mice. Neuron. 2010;65:178–190. doi: 10.1016/j.neuron.2010.01.008. [DOI] [PubMed] [Google Scholar]
- Morfini GA, You YM, Pollema SL, Kaminska A, Liu K, Yoshioka K, Björkblom B, Coffey ET, Bagnato C, Han D, Huang CF, Banker G, Pigino G, Brady ST. Pathogenic huntingtin inhibits fast axonal transport by activating JNK3 and phosphorylating kinesin. Nat Neurosci. 2009;12:864–871. doi: 10.1038/nn.2346. [DOI] [PMC free article] [PubMed] [Google Scholar]
- Narushima M, Uchigashima M, Fukaya M, Matsui M, Manabe T, Hashimoto K, Watanabe M, Kano M. Tonic enhancement of endocannabinoid-mediated retrograde suppression of inhibition by cholinergic interneuron activity in the striatum. J Neurosci. 2007;27:496–506. doi: 10.1523/JNEUROSCI.4644-06.2007. [DOI] [PMC free article] [PubMed] [Google Scholar]
- Narushima M, Uchigashima M, Hashimoto K, Watanabe M, Kano M. Depolarization-induced suppression of inhibition mediated by endocannabinoids at synapses from fast-spiking interneurons to medium spiny neurons in the striatum. Eur J Neurosci. 2006;24:2246–2252. doi: 10.1111/j.1460-9568.2006.05119.x. [DOI] [PubMed] [Google Scholar]
- Navarrete M, Araque A. Endocannabinoids potentiate synaptic transmission through stimulation of astrocytes. Neuron. 2010;68:113–126. doi: 10.1016/j.neuron.2010.08.043. [DOI] [PubMed] [Google Scholar]
- Paxinos G, Franklin KBJ. The Mouse Brain in Stereotaxic Coordinates. Academic Press, London; 2012. [Google Scholar]
- Podda MV, Riccardi E, D’Ascenzo M, Azzena GB, Grassi C. Dopamine D1-like receptor activation depolarizes medium spiny neurons of the mouse nucleus accumbens by inhibiting inwardly rectifying K+ currents through a cAMP-dependent protein kinase A-independent mechanism. Neurosci. 2010;167:678–690. doi: 10.1016/j.neuroscience.2010.02.075. [DOI] [PubMed] [Google Scholar]
- Romano C, Sesma MA, McDonald CT, O’Malley K, van den Pol AN, Olney JW. Distribution of metabotropic glutamate receptor mGluR5 immunoreactivity in rat brain. J Comp Neurol. 1995;355:455–469. doi: 10.1002/cne.903550310. [DOI] [PubMed] [Google Scholar]
- Ross CA, Tabrizi SJ. Huntington's disease: from molecular pathogenesis to clinical treatment. Lancet Neurol. 2011;10:83–98. doi: 10.1016/S1474-4422(10)70245-3. [DOI] [PubMed] [Google Scholar]
- Rozas JL, Gómez-Sánchez L, Tomás-Zapico C, Lucas JJ, Fernández-Chacón R. Presynaptic dysfunction in Huntington's disease. Biochem Soc Trans. 2010;38:488–492. doi: 10.1042/BST0380488. [DOI] [PubMed] [Google Scholar]
- Sakaba T, Schneggenburger R, Neher E. Estimation of quantal parameters at the calyx of Held synapse. Neurosci Res. 2002;44:343–356. doi: 10.1016/s0168-0102(02)00174-8. [DOI] [PubMed] [Google Scholar]
- Santhakumar V, Jones RT, Mody I. Developmental regulation and neuroprotective effects of striatal tonic GABAA currents. Neuroscience. 2010;167:644–655. doi: 10.1016/j.neuroscience.2010.02.048. [DOI] [PMC free article] [PubMed] [Google Scholar]
- Schneggenburger R, Sakaba T, Neher E. Vesicle pools and short-term synaptic depression: lessons from a large synapse. Trends Neurosci. 2002;25:206–212. doi: 10.1016/s0166-2236(02)02139-2. [DOI] [PubMed] [Google Scholar]
- Shirendeb U, Reddy AP, Manczak M, Calkins MJ, Mao P, Tagle DA, Reddy PH. Abnormal mitochondrial dynamics, mitochondrial loss and mutant huntingtin oligomers in Huntington's disease: implications for selective neuronal damage. Hum Mol Genet. 2011;20:1438–1455. doi: 10.1093/hmg/ddr024. [DOI] [PMC free article] [PubMed] [Google Scholar]
- Snell RG, MacMillan JC, Cheadle JP, Fenton I, Lazarou LP, Davies P, MacDonald ME, Gusella JF, Harper PS, Shaw DJ. Relationship between trinucleotide repeat expansion and phenotypic variation in Huntington's disease. Nat Genet. 1993;4:393–397. doi: 10.1038/ng0893-393. [DOI] [PubMed] [Google Scholar]
- Surmeier DJ, Ding J, Day M, Wang Z, Shen W. D1 and D2 dopamine-receptor modulation of striatal glutamatergic signaling in striatal medium spiny neurons. Trends Neurosci. 2007;30:228–235. doi: 10.1016/j.tins.2007.03.008. [DOI] [PubMed] [Google Scholar]
- Tang TS, Slow E, Lupu V, Stavrovskaya IG, Sugimori M, Llinás R, Kristal BS, Hayden MR, Bezprozvanny I. Disturbed Ca2+ signaling and apoptosis of medium spiny neurons in Huntington's disease. Proc Natl Acad Sci U S A. 2005;102:2602–2607. doi: 10.1073/pnas.0409402102. [DOI] [PMC free article] [PubMed] [Google Scholar]
- Taverna S, Ilijic E, Surmeier DJ. Recurrent collateral connections of striatal medium spiny neurons are disrupted in models of Parkinson's disease. J Neurosci. 2008;28:5504–5512. doi: 10.1523/JNEUROSCI.5493-07.2008. [DOI] [PMC free article] [PubMed] [Google Scholar]
- Tecuapetla F, Koos T, Tepper JM, Kabbani N, Yeckel MF. Differential dopaminergic modulation of neostriatal synaptic connections of striatopallidal axon collaterals. J Neurosci. 2009;29:8977–8990. doi: 10.1523/JNEUROSCI.6145-08.2009. [DOI] [PMC free article] [PubMed] [Google Scholar]
- Tepper JM, Bolam JP. Functional diversity and specificity of neostriatal interneurons. Curr Opin Neurobiol. 2004;14:685–692. doi: 10.1016/j.conb.2004.10.003. [DOI] [PubMed] [Google Scholar]
- Tepper JM, Wilson CJ, Koos T. Feedforward and feedback inhibition in neostriatal GABAergic spiny neurons. Brain Res Rev. 2008;58:272–281. doi: 10.1016/j.brainresrev.2007.10.008. [DOI] [PMC free article] [PubMed] [Google Scholar]
- The Huntington's Disease Collaborative Research Group. A novel gene containing a trinucleotide repeat that is expanded an unstable on Huntington's disease chromosomes. Cell. 1993;72:971–983. doi: 10.1016/0092-8674(93)90585-e. [DOI] [PubMed] [Google Scholar]
- Tobin AJ, Signer ER. Huntington's disease: the challenge for cell biologists. Trends Cell Biol. 2000;10:531–536. doi: 10.1016/s0962-8924(00)01853-5. [DOI] [PubMed] [Google Scholar]
- Trushina E, Singh RD, Dyer RB, Cao S, Shah VH, Parton RG, Pagano RE, McMurray CT. Mutant huntingtin inhibits clathrin-independent endocytosis and causes accumulation of cholesterol in vitro and in vivo. Hum Mol Genet. 2006;15:3578–3591. doi: 10.1093/hmg/ddl434. [DOI] [PubMed] [Google Scholar]
- Van Raamsdonk JM, Murphy Z, Slow EJ, Leavitt BR, Hayden MR. Selective degeneration and nuclear localization of mutant huntingtin in the YAC128 mouse model of Huntington disease. Hum Mol Genet. 2005;14:3823–3835. doi: 10.1093/hmg/ddi407. [DOI] [PubMed] [Google Scholar]
- Venance L, Piomelli D, Glowinski J, Giaume C. Inhibition by anandamide of gap junctions and intercellular calcium signalling in striatal astrocytes. Nature. 1995;376:590–594. doi: 10.1038/376590a0. [DOI] [PubMed] [Google Scholar]
- Walter L, Dinh T, Stella N. ATP induces a rapid and pronounced increase in 2-arachidonoylglycerol production by astrocytes, a response limited by monoacylglycerol lipase. J Neurosci. 2004;24:8068–8074. doi: 10.1523/JNEUROSCI.2419-04.2004. [DOI] [PMC free article] [PubMed] [Google Scholar]
- Yrjanheikki JM, Puoliväli J, Lehtimäki K, Park LC, Howland D, Kontkanen O, Heikkinen T. 2011. Characterization of behavioral changes, MRI brain volumetry and MRI spectroscopy in q175 knock in mouse model of Huntington's disease. Society for Neuroscience Abstracts.
- Zuccato C, Cattaneo E. Brain-derived neurotrophic factor in neurodegenerative diseases. Nat Rev Neurol. 2009;5:311–322. doi: 10.1038/nrneurol.2009.54. [DOI] [PubMed] [Google Scholar]