Abstract
The local elasticity of glasses is known to be inhomogeneous on a microscopic scale compared to that of crystalline materials. Their vibrational spectrum strongly deviates from that expected from Debye's elasticity theory: The density of states deviates from Debye's law, the sound velocity shows a negative dispersion in the boson-peak frequency regime and there is a strong increase of the sound attenuation near the boson-peak frequency. By comparing a mean-field theory of shear-elastic heterogeneity with a large-scale simulation of a soft-sphere glass we demonstrate that the observed anomalies in glasses are caused by elastic heterogeneity. By observing that the macroscopic bulk modulus is frequency independent we show that the boson-peak-related vibrational anomalies are predominantly due to the spatially fluctuating microscopic shear stresses. It is demonstrated that the boson-peak arises from the steep increase of the sound attenuation at a frequency which marks the transition from wave-like excitations to disorder-dominated ones.
The high-frequency vibrational dynamics of glasses (in the regime of a few THz or meV) is in the focus of experimental, theoretical and computational work for already half a century1,2. Whereas the crystalline-lattice dynamics is well understood in terms of the symmetry-related phonon dispersions, supplemented by the consideration of phonon-phonon interactions3, the theoretical interpretation of vibrational spectra of glasses, which differ considerably from those of crystals, is a matter of fierce controversies. The anomalous features are (i) an enhancement of the density of states g(ω) over Debye's g(ω) ∝ ω2 law in a regime, where elasticity theory should still hold, i.e. 1/10 of a Debye frequency, (“boson peak”, BP)2,4, please see Ref. 2 for further references]; (ii) a frequency dependence of the sound attenuation (width of the Brillouin line) which shows a strong increase near the BP frequency; (iii) a negative dispersion of the sound velocities followed by a characteristic minimum near the BP frequency5,6,7,8.
These features can be related to anomalies in the temperature dependence of the specific heat C(T)9 and the thermal conductivity κ(T)10. The former - if plotted as C(T)/T 3 shows a peak near ~10 K, which is also called boson peak, and the latter shows a characteristic shoulder at the BP temperature, which has been shown to be essentially an “upside-down” BP11. The Raman spectra of glasses show also an anomalous maximum near the BP frequency (which is is also called boson peak). Its relation to the other vibrational anomalies has been discussed recently12,13,14.
Models for the BP and the associated anomalies15 range from assuming quasi-local vibrational states, produced by soft anharmonic potentials16,17,18 over elastic heterogeneities11,19,20,21,22,23 to broadened and shifted van-Hove-singularities24,25.
However, a number of recent inelastic scattering experiments5,6,7,8,26,27 and molecular-dynamics (MD) simulations28,29,30,31,32,33,34,35,36 gave valuable insights into the nature of the high-frequency and small-scale vibrational properties of glasses. It emerges that the disorder-affected transverse degrees of freedom of local elasticity play a key role for producing the anomalies.
By analyzing the acoustical properties of 2- and 3-dimensional model glass systems it was found29,34,35 that the BP frequency corresponds to the transverse Ioffe-Regel (IR) frequency, i.e. the frequency at which the wavelength of a transverse excitation is equal to its mean-free path. Such a coincidence of the BP frequency with the transverse IR frequency is found also in our data to be presented below. In metallic glasses37 the BP position also coincides with the transverse Ioffe-Regel frequency, whereas in a number of other glasses coincidence with the longitudinal IR frequency is found38. By a fundamental principle of wave mechanics this implies that vibrational states with frequencies above the BP frequency cannot be labelled with a wave vector k. Therefore, above the Ioffe-Regel frequency, there is no reason for the existence of a Debye law. This is - in a nutshell - already the explanation of the BP phenomenon.
As a matter of fact, such a scenario appears quite naturally if one assumes that the local elastic moduli fluctuate from location to location in space (elastic heterogeneity)11,23. The existence of elastic heterogeneities in glasses have been postulated already for a long time39,40,41. There exists by now both experimental42,43 as well as simulational33,36,44,45,46 evidence - including the data to be presented below - for the existence of elastic heterogeneity in glasses. The computational data reveal that, in fact, the shear-elastic fluctuations are dominant.
Most of the papers dealing with the BP and the other vibrational anomalies of glasses start with the sentence “Although much scientific work has been done on the vibrational anomalies the origin of the boson peak remains elusive” or so. This is in spite of a large body of investigations, which show that the anomalies are related to (and caused by) the structural disorder of the glassy materials1,2,11,15,16,17,18,19,20,21,22,23,28,30,31,32,33,34,35,36.
In the present contribution we show by comparing a simulation of a very large soft-sphere glassy system with the heterogeneous-elasticity theory11,23 that the spatial fluctuations of the elastic constants on a microscopic length scale produce the boson peak and the other elastic anomalies. By evaluating the eigenvalues of the Born-Kelvin stiffness matrix within the simulation we verify for the first time quantitatively the correctness of the model assumptions of the theory. The theory is also shown to account for the non-affine character of disordered shear elasticity31,32. We further demonstrate that the vibrational anomalies are mainly due to the fluctuations of the shear stresses. This is achieved by investigating the frequency dependence of the macroscopic elastic moduli.
Results
Vibrational spectra of a soft-sphere glass
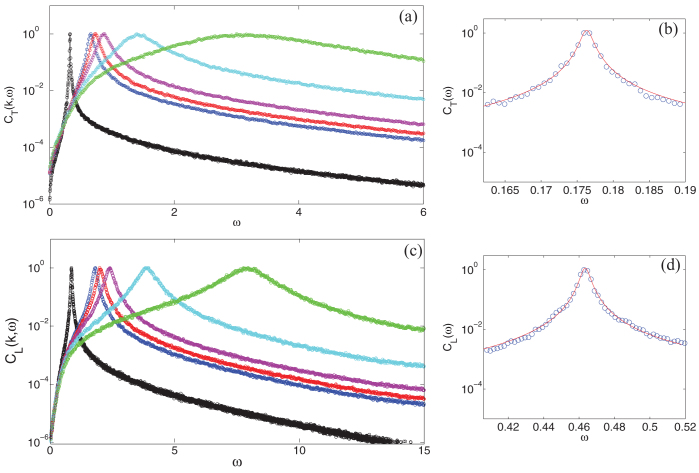
In order to extract the vibrational properties of our model glass we have calculated the longitudinal (L) and transverse (T) current-current correlation functions CL,T (k, ω) as well as the vibrational density of states (DOS) g(ω), obtained via the local velocity autocorrelation functions47. In Fig. 1 we show examples for CL,T (k, ω) data.
Figure 1. Longitudinal (a–b) and transverse (c–d) current-current correlation functions CL,T for k = 0.14, 0.30, 0.33, 0.39, 0.63, 1.2 (LJ units).
In the panels b and d, we provided an example of the fit with the DHO function given by Eq. (1) for k = 0.076 (solid line). Fit data are ΩT = 0.176, ΩL = 0.464, ΓT = 1.5 · 10−3, ΓL = 5.4 · 10−3.
The CL,T (k, ω) data could well be fitted by a damped-harmonic oscillator function (DHO)
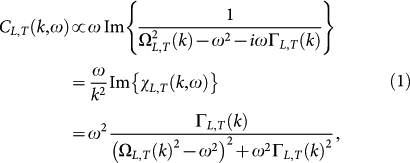 |
where we have introduced the longitudinal and transverse Brillouin resonance frequencies ΩL,T(k), the corresponding Brillouin line widths ΓL,T(k) (sound attenuation coefficients) and the complex longitudinal and transverse dynamic susceptibilities χL,T(k, ω). The resonance frequencies ΩL,T turned out to be essentially linear in the investigated regime (kmin = 0.031 ≤ k ≤ kmax = 1.426), i.e. ΩL,T = vL,Tk. Therefore we find it appropriate to represent the data – as in optics – in terms of complex, frequency-dependent sound velocities:
The real parts  of the complex sound velocities represents the apparent sound velocities in the low-frequency regime, their imaginary parts are related to the sound attenuation. It is worthwhile remarking that the approximation leading to Eq. (2c) is valid for ΓL,T/ΩL,T ≪ 1. As can be seen from Fig. 2 this ratio does not exceed ≈0.15 for the longitudinal and ≈0.3 for the transverse case.
Figure 2. Resonance frequencies ΩL,T(k) (straight lines) and Brillouin line widths ΓL,T(k), multiplied with π for three temperatures T1 = 5 · 10−5 (circles), T2 = 5 · 10−4 (triangles), T3 = 5 · 10−3 (diamonds).
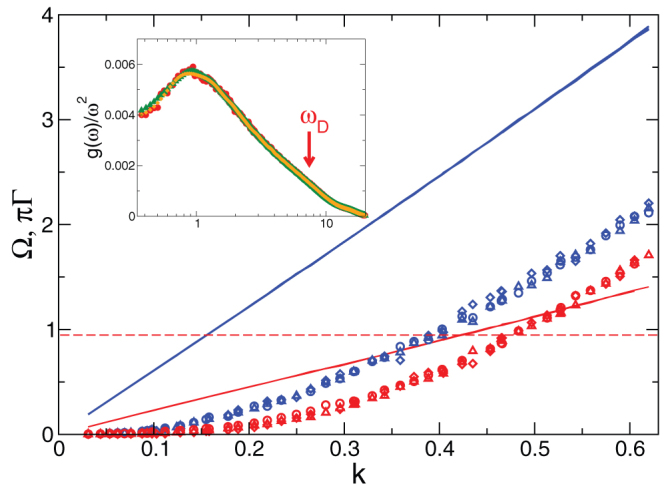
Upper (blue) curves: longitudinal, lower (red) curves: transverse. The three curves for ΩL,T(k) lie on top of each other. The dashed line indicates the BP position, which is near the transverse Ioffe-Regel crossing. Insert: Reduced density of states g(ω)/ω2 as obtained from the velocity autocorrelation function for the three temperatures T1 (red circles), T2 (green triangles), T3 (orange diamonds). The arrow indicates the Debye frequency ωD = 7.54 in LJ units.
In the low-frequency regime one can calculate from the complex sound velocities  frequency-dependent wavelengths λ and mean-free paths
  of the longitudinal and transverse wave-like excitations as
  and
and  . When these lengths are equal to each other, the Ioffe-Regel regime Ω = πΓ is reached. Near and beyond this regime the vibrational excitations are no more wave-like, and k cannot be used for labeling the vibrational excitations.
In the inset of Fig. 2 the reduced density of states g(ω)/ω2 is shown for the three temperatures considered (see Fig. 2 and “Methods”). The reduced DOS shows the BP anomaly typical for glasses. From Fig. 2 we see that the Ioffe-Regel limit is reached for the transverse waves near ΩT ≈ 1, which is roughly the BP frequency, i.e. the frequency, where the density of states g(ω) is no more Debye-like. This is understood easily if one realizes that g(ω) is essentially given by the k sum of the combination CL(k, ω) + 2CT(k, ω) (see Eq. (8) below). As the weighting factors are the inverse cubes of the sound velocities the spectrum is dominated by the transverse part. For small k where  is much larger than λ, CL,T(k, ω) are proportional to δ(ω − ΩL,T), which gives a Debye spectrum. Near the Ioffe-Regel limit CT(k, ω) deviates strongly from a sharply peaked function, which explains the non-Debye behavior: The BP is due to the breakdown of homogeneous elasticity in the transverse channel.
In Fig. 3 we have plotted the sound velocities  and the Brillouin line widths ΓL,T as a function of frequency. It is very striking that the velocities have a characteristic minimum near the frequency ω ≈ 1 (in Lennard-Jones LJ units, see “Methods”), where the reduced DOS has its maximum (boson peak). These findings are similar to those found experimentally5,6 and by simulation35 previously. Below the BP frequency there is a strong increase of the line widths with increasing frequency, which, in the transverse case, is almost as strong as Rayleigh's ω4 law. Above the BP frequency the frequency dependence is much weaker. In the longitudinal case there is also a rapid increase of the attenuation below the BP frequency, but not as strong as ω4.
Figure 3. Frequency dependence of the longitudinal and transverse sound velocities (a) and (b) and corresponding sound attenuation coefficients (c) and (d), as extracted from the current-current autocorrelation functions using the damped-harmonic-oscillator parametrization, Eq. (1) for the three temperatures specified in Fig. 2.
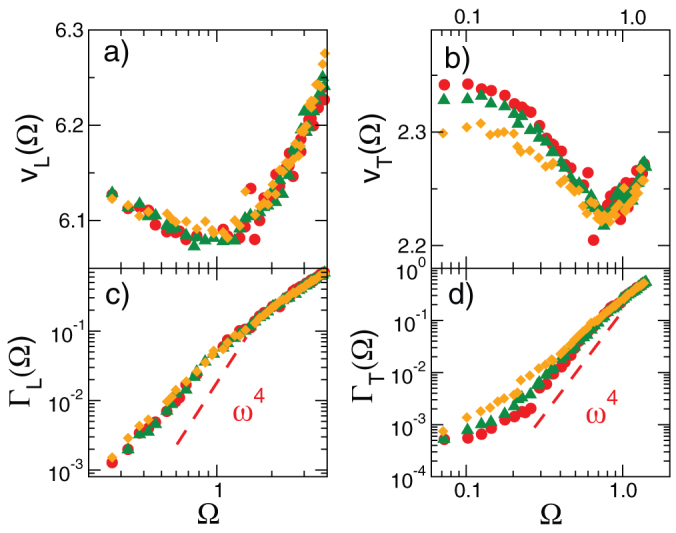
How does the strong frequency dependence, which leads to the breakdown of Debye elasticity at the BP frequency, come about? It is well known since the time of Lord Rayleigh48,49 that inhomogeneities in a medium, which supports waves, lead to elastic scattering of the Rayleigh type, i.e.  50,51,52,53. In glasses at low frequencies this disorder-induced frequency dependency can be masked by anharmonic damping phenomena. However, there is now experimental5,6 and numerical evidence34 [and Fig. 3d] for the existence of the Rayleigh scattering mechanism in glasses between the anharmonic regime and the BP.
Using the complex sound velocities we now introduce complex macroscopic elastic moduli, namely the shear modulus  , the longitudinal modulus
  and the bulk modulus
  (ρ is the mass density).
Let us now discuss the frequency dependence of the moduli, displayed in Fig. 4. If we do the subtraction  it turns out that the real part of
  is frequency independent and its imaginary part is almost zero. It can be seen clearly from Fig. 4 that the real and imaginary part of the quantity
  , where
  is the frequency-independent reduced bulk modulus, exhibits the same frequency dependence as those of the complex longitudinal modulus
  . The observation that the macroscopic bulk modulus is frequency independent, as we shall argue below, points to the fact that the vibrational anomalies in our model glass are predominantly due to spatially fluctuating shear stiffnesses. A frequency-independent bulk modulus has been found recently in a simulation of a LJ glass35 pointing to the conclusion that quite generally in central-potential glasses the BP producing elastic heterogeneities are dominated by the shear degrees of freedom.
Figure 4. Frequency dependence of the real parts (top) and imaginary parts (bottom) of the elastic moduli:  (full symbols) and
  (open symbols) with
  for the three temperatures specified in Fig. 2.
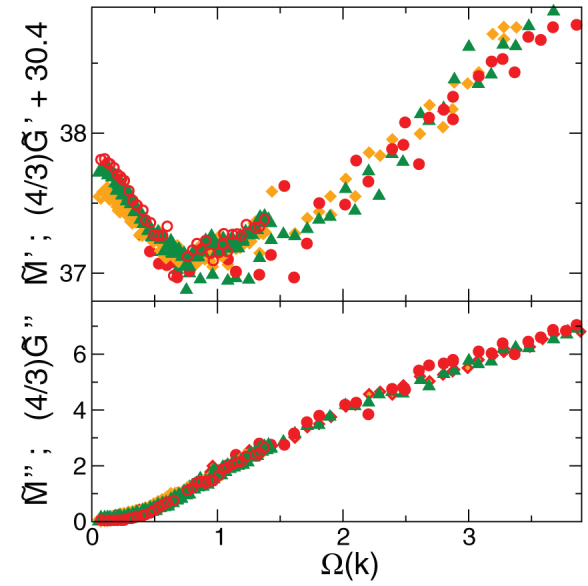
The imaginary part of  turned out to be zero in all cases.
Heterogeneous-elasticity theory
Let us now discuss these findings in terms of heterogeneous-elasticity theory11,23. The equation of motion for a Cartesian component of a local displacement vector u(r, ω) can be written in terms of the stress tensor σij (where i, j = 1, 2, 3 are the Cartesian indices) as
with ∂j ≡ ∂/∂xj. Hooke's law, which relates σij to the strain tensor  in an isotropic system can be written in two different ways:
where we have introduced the trace-free strain tensor
The representation (4b) implies a separation between pure dilatational and pure shear stresses. The quantity  is the traceless tensor of dilatational-free stresses. On a small scale the elastic constants K and G may depend on the spatial location r, which is the definition of elastic heterogeneity. The assumption of spatial statistical fluctuations of the shear modulus according to a Gaussian distribution with mean G0 and variance 〈ΔG2〉 is the basis of heterogeneous-elasticity theory11,23.
On a large scale the spatial fluctuations transform into a frequency dependence including a real and imaginary part. Within the Ioffe-Regel regime (Debye regime) this frequency dependence of the large-scale complex elastic moduli are induced by scattering from the elastic inhomogeneities. Due to the macroscopic homogeneity of the system the microscopic inhomogeneities of the stress tensor are mapped to a frequency dependence of the macroscopic stresses.
In the original formulation of the theory11,23 the first term in Eq. (4a) (Lamé's λ parameter) was assumed not to fluctuate spatially which leads to a frequency-dependent macroscopic bulk modulus. As such a frequency dependence is not observed, our conclusion is that in glasses with frequency-independent bulk modulus the BP-related vibrational anomalies are entirely produced by shear stresses. The present version of our theory is therefore formulated in such a way that the shear modulus G that appears in the second term of Eq. (4b) fluctuates with a Gaussian distribution of the deviation ΔG from the mean G0, i.e. the bulk modulus K is not assumed to fluctuate.
It is very important to emphasize that the disorder-induced frequency dependence of the elastic moduli M and G has nothing to do with dissipation. In a disordered harmonic solid there is no damping. The apparent frequency dependence is due to the fact that with increasing frequency the concepts of macroscopic elasticity theory, namely the labeling of the vibrational states by wavenumbers breaks gradually down, until it becomes entirely meaningless at the Ioffe-regel limit. This is the reason, why crystalline concepts like van-Hove singularities24,25, which rely on well-defined dispersion relations (with no imaginary part involved), are not very helpful in discussing the vibrational states of a glass.
The mean-field theory for heterogeneous shear elasticity gives the following self-consistent equations for the macroscopic moduli (self-consistent Born approximation, SCBA):
 |
with χL,T(k, ω) given by Eq. (2a). The influence of the disorder is given by the complex self-energy function Σ(ω). The k summation  is restricted to values smaller than the Debye wavenumber
  . N is the number of atoms and V is the volume of the sample.
is the disorder parameter, where Vc is the coarse-graining volume used to calculate the local shear modulus G. The second parameter of the theory is the ratio K/G0. The density of states is given by
 |
Due to the assumption of a Gaussian distribution of microscopic shear fluctuations there exists a critical value of the disorder parameter γc beyond which the system is unstable. The instability arises because of the presence of negative shear stiffnesses. (As a matter of fact, there is evidence from numerical work on metallic glasses33,40 for the existence of Gaussian distributions of local shear stiffnesses, which extend to negative values.) γc depends weakly on the ratio K/G0 and is of the order of 0.2. As noted already earlier11,20,23 the vibrational anomalies can be interpreted as precursor phenomena of the instability, which occurs at lower density or higher temperature54.
In Fig. 5 the real and imaginary parts of  are compared to the result of the theory with γc − γ = 0.008. and K/G0 = 3.166. In Fig. 6 the reduced DOS of the simulation is compared with the prediction of the theory for the same parameters. The agreement is striking! At very low frequencies, where the data are temperature dependent and deviate from the Rayleigh law, anharmonic physics becomes distinct. We shall discuss this frequency regime in a forthcoming paper.
Figure 5. Real parts (upper panel) and imaginary parts (lower panel) of the frequency-dependent shear modulus  and the quantity
  for all three temperatures with
  .
.
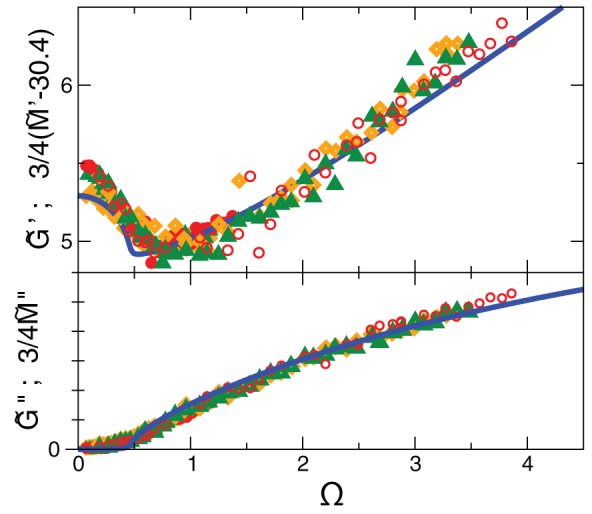
Symbols: simulation data for all three temperatures (same code as in Fig. 3). Full line: SCBA calculation of  (which equals
  ) with γc − γ = 0.008 and K/G0 = 3.166.
Figure 6. Reduced density of states.
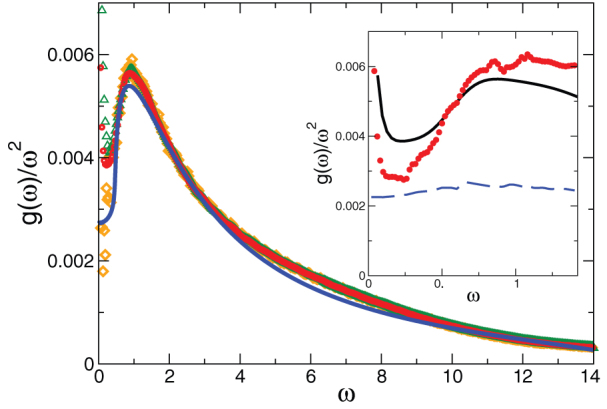
Symbols: simulation data as obtained from the velocity autocorrelation function for all three temperatures. Full line: Theory with the same value of γ as in Fig. 5. Insert: reduced density of states for the lowest temperature (full line), compared with the approximate reduced quantity calculated from the fit parameters  and ΓL,T(ω) of the simulated current-correlation functions using Eq. (9) (red dots). The dashed blue line is the Debye contribution corresponding to the first summand in Eq. (9).
Local elasticity fluctuations
In order to further test the reliability of the theory we have calculated the local 6 eigenvalues C1 … C6 of the matrix of the Born-Kelvin stiffness coefficients (see “Methods”) for different coarse-graining volumes Vc. In an isotropic system C1 = 3K and Ci = 2G, i ≥ 2. The results are displayed in Fig. 7. In the main body of the figure the distribution of the Ci are shown for Vc = 45 and Vc = 2000 (the total volume is V = 8.3·106 in LJ units). In the insert the mean values and γ parameters, defined as in Eq. (7) are plotted against Vc. The value of 〈C1〉 ≈ 100 for large Vc essentially agrees with the value  (ρ = 1.2 in LJ units) extracted from the frequency-dependent moduli (Fig. 4). The mean values of the shear eigenvalues are ≈33, giving 〈G〉 ≈ 16. This nicely corresponds to G0/K ≈ 3 used in our fits. However 〈G〉 does not agree to the macroscopic value of
  (Figs. 3,5). The reason is that the Born expressions for the stiffness coefficients Cij rely on the assumption of affinity of the dilatational and shear elasticity of the solids. As demonstrated in detail in a series of simulations31,32, this assumption does not hold for shear elasticity in glasses; the shear modulus is lowered by the presence of non-affine processes as compared to the Born expectation. This reduction of G is included in the predictions of our theory and is induced by the ω = 0 value of the self energy Σ. For γ ≈ γc we have Σ(0) ≈ 0.5G0, which gives a reduction of a factor 0.5 in agreement with the simulation. As the function Σ(ω) describes the BP-related vibrational anomalies, we can state that the appearance of the boson peak and the reduction of the shear modulus by the non-affine processes are both due to the elastic heterogeneities, viz. the structural disorder.
Figure 7. Histogram of the 6 eigenvalues Ci of the Kelvin stiffness tensor Cij evaluated using Born's force constants for a tiling of the total volume into 573 boxes (Vc = 44, red dashes) and into 163 boxes (Vc = 2000, blue lines).
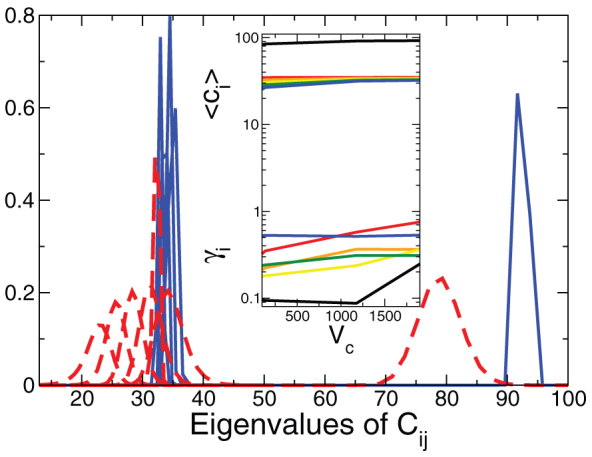
The total volume is V = 8.3 · 106. Insert: Mean values 〈Ci〉 (top group) and disorder parameters  (bottom group) vs. coarse-graining volume Vc. The top and bottom black lines correspond to
  , the others to
  .
.
From Fig. 7 we see that all distributions of the Ci are Gaussian and that the γ value of C1 is much lower than those of the shear moduli. The latter are of the order or somewhat larger than γc ≈ 0.2. We see that the model assumptions and parameters of our theory are quite realistic. We also see that on the microscopic scale spatial fluctuations of the compression modulus exist, but the relative fluctuations, represented by the γ value, are much smaller. This corresponds to similar findings in Refs. 31, 32. If the fluctuations of K would be stronger this would lead to a frequency-dependent K(ω) and a further modification of the DOS in the BP regime. It is remarkable that also in the disorder-induced sound attenuation via tunneling systems the transverse degrees of freedom appear to be dominant, see e.g., G. Belessa, J. Phys. (Paris) 41, C8-723 (1980); J. F. Berret and M. Meissner, Z. Phys. B - Condensed Matter 70, 65 (1988).
Discussion
We have argued that beyond the Ioffe-Regel limit, i.e. beyond the BP frequency there is no reason, why g(ω) should exhibit a Debye law. But why is the disordered g(ω) larger than the Debye density of states? We can answer this question by using a decomposition of the integrands in Eq. (8) as follows23:
Within the Ioffe-Regel regime i.e. for ω below the BP position we approximately replace the denominator of the response functions  by
by  . This leads to a reduced density of states of the form
 |
Now we can take our fit functions  and ΓL,T(ω) as determined from the simulated current correlation spectra and insert them into the formula. The results (for the lowest temperature T1) are the red symbols in the insert of Fig. 6. The straight line is g(ω)/ω2 as obtained from the velocity-autocorrelation function. The blue dashed line is the Debye-like contribution given by the first summand of Eq. (9). The difference between the symbols and the dashed line is entirely due to the broadening of the Brillouin line. The proportionality of the excess DOS to the sound attenuation constant in the sound-like regime has been pointed out already in Ref. 23.
We can now draw an important conclusion from considering the insert in Fig. 6. Monaco and Mossa35 have argued that the BP is produced by the minimum in the real part of the frequency-dependent sound velocities assuming a Debye law as given by the first term in our equation (9). But this term just gives the rather weak maximum of the dashed curve. As pointed out above, the BP, instead, arises from the steep increase of the sound attenuation. The dip in the real part of the sound velocity is just the faint echo of this increase due to the Kramers-Kronig relations between the real and imaginary parts of the moduli.
We would like to emphasize again that the vibrational spectrum beyond the BP frequency cannot be described by concepts borrowed from Debye's theory: The disorder is dominant in this regime. It has been shown previously that the vibrational states in this regime obey the statistics of random matrices20. The eigenvalues exhibit level repulsion24, i.e. there are no degeneracies. This absence of degeneracies can be traced to the microscopic breakdown of the translational and rotational symmetry. We conclude that the vibrational states near and above the BP are of random-matrix type55.
We also would like to comment on the vibrational anomalies of SiO2 glass, a material very-well investigated both experimentally and by computer simulation (please see Ref. 8 for an extensive bibliography on SiO2). A recent inelastic X-ray study8 reveals that the elastic anomalies of this material can be qualitatively but not quantitatively explained in terms of elastic-heterogeneity theory (as presented in refs. 11, 23 and presently). To be specific, the measured excess density of states exceeds that predicted by the theory. Therefore an additional mechanism contributing to the boson peak was invoked. On the other hand, in recent theoretical work56 the present theory, which is based on the assumption of a Gaussian distribution of the fluctuating elastic constants, has been generalized to include non-Gaussian distributions. This is achieved by using an off-lattice version of the coherent-potential approximation (CPA), which has been derived in Ref. 56. We convinced ourselves that non-Gaussian distributions produce a much stronger excess of the density of states than Gaussian ones. In particular the enhancement of the density of states of SiO2 can be accounted for by assuming a power-law distribution, which can be derived from interatomic forces varying exponentially with distance. So the strong elastic anomalies of network-forming glasses can be explained by non-Gaussian heterogeneous elasticity.
Let us summarize our findings. By comparing a simulation of a very large model of a soft-sphere glass with the mean-field theory of elastic heterogeneous shear fluctuations we have obtained compelling evidence that the excess of the density of states over the Debye prediction (boson peak), the negative dispersion of the sound velocities and the steep increase in the Brillouin line width in the boson-peak region are produced by spatial fluctuations of dilatation-free shear stresses. More generally this points to the conclusion that in glasses the boson peak and the associated anomalies are induced by spatial fluctuations of elastic constants induced by the structural disorder. The strong Rayleigh-like scattering from the local inhomogeneities causes the breakdown of a wave-like description in favor of random-matrix type vibrational states. A theory has been formulated, which satisfactorily describes all anomalous features, including the frequency independence of the bulk modulus and the non-affine shear elasticity of glasses.
Methods
We simulated a 20:80 binary mixture of N = 107 particles AxB1−x with x = 0.2, interacting through a soft-sphere potential. By choosing such a mixture crystallization is avoided, when the system is supercooled57. The two types of particles, A and B, have same masses, mA = mB = 1, but different soft-sphere potential parameters for the AA, AB and BB interactions. The interaction potential is (we use standard LJ units):
with σAA = 1, σAB = σBA = 0.80, σBB = 0.88 and  ,
,  ,
,  . rij is the distance between particles i, j of species α and β, respectively. This parametrization defines the standard molecular-dynamics units. The soft-sphere potential is continuously cut-off at rc = 1.1856. At this value, with a mass density of ρ = 1.2, it guarantees a sufficiently large interaction distance to observe the formation of a super-cooled liquid. We performed an extremely massively campaign (about 20M of single-cpu computational hours) of parallel molecular dynamic simulations using the recently developed Billions-Body Molecular Dynamics (BBMD) package, which was specifically designed for massively parallel studies of amorphous materials58. We considered three different temperatures (in the standard MD units) T1 = 5 · 10−3, T2 = 5 · 10−4, T3 = 5 · 10−5, which are well below the glass transition temperature that is estimated to be Tg ~ 0.1. The glass is formed by a controlled canonical evolution, where an input body-cubic lattice configuration is initially heated up to T = 3, and then slowly cooled down with a temperature decreasing linearly with time. The duration of the heating phase was Δth = 20 (i.e., 20000 time steps), while the cooling period had a length of Δtc = 2420 (i.e., 2.42·106 time steps). The temperature of the system was adjusted by velocity rescaling every 10 time units (104 elementary time steps). The collective motions have been studied by the calculation of the correlation functions
of the longitudinal and transverse current density vectors  , jT(k, t) = j(k, t) − jL(k, t) with
  and rl and vl are particle position and velocity, respectively. The vibrational density of state g(ω), conversely, was calculated by evaluating the local velocity autocorrelation function47 of an ensemble of 16000 different particles.
g(ω) has been normalized to unity.
The local Hookean stiffness coefficients defined by  have been evaluated using the Born formula59
 |
where the derivative is with respect to r = |r| and xα is the αth component of r. The sum runs over all pairs of particles separated by the vector r, where one or both are inside a given coarse-graining box of volume Vc. rin is the proportion of r which lies inside the volume. Switching to the Voigt notation  (xx = 1, yy = 2, zz = 3, yz = 4, xz = 5, xy = 6) the Kelvin matrix Cij is defined by
  ;
;  ;
;  . For an isotropic system the 6 eigenvalues of Cij are 3K (non-degenerate) and 2G (five-fold degenerate)33,36.
Author Contributions
A.M., A.F., W.S. and G.R. work at the simulations and field theoretical analysis. A.M., A.F., W.S. and G.R. reviewed the manuscript.
Acknowledgments
W. S. is grateful for helpful discussions with J.-L. Barrat and H. R. Schober. For parallel computing, this research used the resources of the Supercomputing Laboratory and the Primalight group at KAUST University.
References
- Elliott S. R. Physics of amorphous materials (Wiley, New York, 1984). [Google Scholar]
- Kob W. & Binder K. Glassy Materials and Disordered Solids: An Introduction (World Scientific, London, 2011). [Google Scholar]
- Maradudin A. A. Lattice dynamics (Benjamin, New York, 1969). [Google Scholar]
- Buchenau U., Nücker N. & Dianoux A. J. Neutron scattering study of the low-frequency vibrations in vitreous silica. Phys. Rev. Lett. 53, 2316–2319 (1984). [Google Scholar]
- Monaco G. & Giordano V. M. Breakdown of the debye approximation for the acoustic modes with nanometric wavelengths in glasses. PNAS 106, 3659–3663 (2009). [DOI] [PMC free article] [PubMed] [Google Scholar]
- Baldi G., Giordano V. M., Monaco G. & Ruta B. Sound attenuation at terahertz frequencies and the boson peak of vitreous silica. Phys. Rev. Lett. 104, 195501 (2010). [DOI] [PubMed] [Google Scholar]
- Ruta B. et al. Communication: High-frequency acoustic excitations and boson peak in glasses: A study of their temperature dependence. The Journal of Chemical Physics 133, 041101 (2010). [DOI] [PubMed] [Google Scholar]
- Baldi G., Giordano V. M. & Monaco G. Elastic anomalies at terahertz frequencies and excess density of vibrational states in silica glass. Phys. Rev. B 83, 174203 (2011). [Google Scholar]
- Zeller R. C. & Pohl R. O. Thermal conductivity and specific heat of noncrystalline solids. Phys. Rev. B 4, 2029–2041 (1971). [Google Scholar]
- Alexander S., Entin-Wohlman O. & Orbach R. Phonon-fracton anharmonic interactions: The thermal conductivity of amorphous materials. Phys. Rev. B 34, 2726–2734 (1986). [DOI] [PubMed] [Google Scholar]
- Schirmacher W. Thermal conductivity of glassy materials and the boson peak”. Europhys. Lett. 73, 892–898 (2006). [Google Scholar]
- Schmid B. & Schirmacher W. Raman scattering and the low-frequency vibrational spectrum of glasses. Phys. Rev. Lett. 100, 137402–(4) (2008). [DOI] [PubMed] [Google Scholar]
- Unruh T., Schulte A., Guo Y., Schirmacher W. & Schmid B. Inelastic neutron and low-frequency raman scattering in a niobium-phosphate glass for raman gain applications. J. Non-Cryst. Sol. 357, 506–509 (2011). [Google Scholar]
- Schulte A., Schirmacher W., Schmid B. & Unruh T. Inelastic neutron and low-frequency raman scattering in niobium-phosphate glasses: the role of spatially fluctuating elastic and elasto-optic constants. J. Phys. Condens. Matter 23, 254212–(25) (2011). [Google Scholar]
- Zorn R. The boson peak demystified? Physics 4, 44–45 (2011). [Google Scholar]
- Buchenau U., Galperin Y. M., Gurevich V. L. & Schober H. R. Anharmonic potentials and vibrational localization in glasses. Phys. Rev. B 43, 5039–5045 (1991). [DOI] [PubMed] [Google Scholar]
- Gurevich V. L. & Schober H. R. Decay of mesoscopically localized vibrational eigenstates in porous materials. Phys. Rev. B 57, 11295–11302 (1998). [Google Scholar]
- Gurevich V. L., Parshin D. A. & Schober H. R. Anharmonicity, vibrational instability, and the boson peak in glasses. Phys. Rev. B 67, 094203–(10) (2003). [Google Scholar]
- Duval E., Mermet A. & Saviot L. Boson peak and hybridization of acoustic modes with vibrations of nanometric heterogeneities in glasses. Phys. Rev. B 75, 024201–(9) (2007). [Google Scholar]
- Schirmacher W., Diezemann G. & Ganter C. Harmonic vibrational excitations in disordered solids and the “boson peak”. Phys. Rev. Lett. 81, 136–139 (1998). [Google Scholar]
- Götze W. & Mayr M. R. Evolution of vibrational excitations in glassy systems. Phys. Rev. E 61, 587–606 (2000). [DOI] [PubMed] [Google Scholar]
- Kantelhardt J. W., Russ S. & Bunde A. Excess modes in the vibrational spectrum of disordered systems and the boson peak. Phys. Rev. B 63, 064302–(4) (2001). [Google Scholar]
- Schirmacher W., Ruocco G. & Scopigno T. Acoustic attenuation in glasses and its relation with the boson peak. Phys. Rev. Lett. 98, 025501–(4) (2007). [DOI] [PubMed] [Google Scholar]
- Taraskin S. N., Loh Y. L., Natarajan G. & Elliott S. R. Origin of the boson peak in systems with lattice disorder. Phys. Rev. Lett. 86, 1255–1258 (2001). [DOI] [PubMed] [Google Scholar]
- Chumakov A. I. et al. Equivalence of the boson peak in glasses to the transverse acoustic van hove singularity in crystals. Phys. Rev. Lett. 106, 225501–(5) (2011). [DOI] [PubMed] [Google Scholar]
- Bove L. E. et al. Brillouin neutron scattering of -. Europhys. Lett. 71, 563–569 (2005). [Google Scholar]
- Caponi S. et al. Raman-scattering measurements of the vibrational density of states of a reactive mixture during polymerization: Effect on the boson peak. Phys. Rev. Lett. 102, 027402–(4) (2009). [DOI] [PubMed] [Google Scholar]
- Horbach J., Kob W. & Binder K. High frequency sound and the boson peak in amorphous silica. Eur. Phys. J. B 19, 531–543 (2001). [Google Scholar]
- Schober H. R. Vibrations and relaxations in a soft sphere glass: boson peak and structure factors. J. Phys. Condens. Matter 16, S2659–S2670 (2004). [Google Scholar]
- Pilla O. et al. The low energy excess of vibrational states in v – sio2: the role of transverse dynamics. J. Phys. Condens. Matter 16, 8519–8530 (2004). [Google Scholar]
- Leonforte F., Boissière R., Tanguy A., Wittmer J. P. & Barrat J.-L. Continuum limit of amorphous elastic bodies. iii. three-dimensional systems. Phys. Rev. B 72, 224206–(11) (2005). [Google Scholar]
- Léonforte F., Tanguy A., Wittmer J. P. & Barrat J.-L. Inhomogeneous elastic response of silica glass. Phys. Rev. Lett. 97, 055501–(4) (2006). [DOI] [PubMed] [Google Scholar]
- Mayr S. G. Relaxation kinetics and mechanical stability of metallic glasses and supercooled melts. Phys. Rev. B 79, 060201–(4) (2009). [Google Scholar]
- Shintani H. & Tanaka H. Universal link between the boson peak and transverse phonons in glass. Nature Materials 7, 870–877 (2008). [DOI] [PubMed] [Google Scholar]
- Monaco G. & Mossa S. Anomalous properties of the acoustic excitations in glasses on the mesoscopic length scale. PNAS 106, 16907–16912 (2009). [DOI] [PMC free article] [PubMed] [Google Scholar]
- Derlet P. M., Maass R. & Löffler J. F. The boson peak of model galss systems and its relation to atomic structure. Eur. Phys. J. B 85, 148–168 (2012). [Google Scholar]
- Scopigno T., Suck J.-B., Angelini R., Albergamo F. & Ruocco G. High-frequency dynamics in metallic glasses. Phys. Rev. Lett. 96, 135501–(4) (2006). [DOI] [PubMed] [Google Scholar]
- Rufflé B., Guimbretière G., Courtens E., Vacher R. & Monaco G. Glass-specific behavior in the damping of acousticlike vibrations. Phys. Rev. Lett. 96, 045502–(4) (2006). [DOI] [PubMed] [Google Scholar]
- Srolovitz D., Maeda K., Vitek V. & Egami T. Structural defects in amorphous solids statistical analysis of a computer model. Philos. Mag. A 44, 847–866 (1981). [Google Scholar]
- Egami T. & Srolovitz D. Local structural fluctuations in amorphous and liquid metals: a simple theory of the glass transition. J. Phys. F: Metal Physics 12, 2141–2163 (1982). [Google Scholar]
- Duval E., Boukenter A. & Achibat T. Vibrational dynamics and the structure of glasses. J. Phys. Condens. Matter 2, 10227–10234 (1990). [Google Scholar]
- Russell E. V. & Israeloff N. E. Direct observation of molecular cooperativity near the glass transition. Nature 408, 695–698 (2000). [DOI] [PubMed] [Google Scholar]
- Wagner H. et al. Local elastic properties of a metallic glass. Nature Materials 10, 439–442 (2011). [DOI] [PubMed] [Google Scholar]
- Luchnikov V. A., Medvedev N. N., Naberukhin Y. I. & Novikov V. N. Inhomogeneity of the spatial distribution of vibrational modes in a computer model of amorphous argon. Phys. Rev. B 51, 15569–15572 (1995). [DOI] [PubMed] [Google Scholar]
- Vollmayr-Lee K., Kob W., Binder K. & Zippelius A. Dynamical heterogeneities below the glass transition. J. Chem. Phys. 116–125, 5158 (2002). [Google Scholar]
- Tsamados M., Tanguy A., Goldenberg C. & Barrat J.-L. Local elasticity map and plasticity in a model lennard-jones glass. Phys. Rev. E 80, 026112–(17) (2009). [DOI] [PubMed] [Google Scholar]
- Rahman A., Mandell M. J. & McTague J. P. Molecular dynamics study of an amorphous lennardjones system at low temperature. J. Chem. Phys. 64–69, 1564 (1976). [Google Scholar]
- Strutt, J. W. (Lord Rayleigh) On the transmission of light through an atmosphere containing small particles in suspension, and on the origin of the blue of the sky. Philos. Magazine 47, 375–384 (1903). [Google Scholar]
- Jackson J. D. Classical Electrodynamics (Wiley, New York, 1975). [Google Scholar]
- Klemens P. G. The thermal conductivity of dielectric solids at low temperatures. Proc. Phys. Soc. London, Ser. 208, 108–133 (1951). [Google Scholar]
- Akkermans E. & Maynard R. Weak localization and anharmonicity of phonons. Phys. Rev. B 32, 7850–7862 (1985). [DOI] [PubMed] [Google Scholar]
- Elliott S. R. A unified model for the low-energy vibrational behaviour of amorphous solids. Europhys. Lett. 19, 201–206 (1992). [Google Scholar]
- Ganter C. & Schirmacher W. Rayleigh scattering, long-time tails, and the harmonic spectrum of topologically disordered systems. Phys. Rev. B 82, 094205–(7) (2010). [Google Scholar]
- Zanatta M. et al. Debye to non-debye scaling of the boson peak dynamics: Critical behavior and local disorder in vitreous germania. J. Chem. Phys. 135, 174506–(5) (2011). [DOI] [PubMed] [Google Scholar]
- Beltukov Y. M. & Parshin D. A. Theory of sparse random matrices and vibrational spectra of amorphous solids. Physics of the Solid State 53, 151–162 (2011). [Google Scholar]
- Köhler S. Diploma thesis (Univ. Mainz, unpublished, 2011). [Google Scholar]
- Kob W. & Andersen H. C. Scaling behavior in the β-relaxation regime of a supercooled lennard-jones mixture. Phys. Rev. Lett. 73, 1376–1379 (1994). [DOI] [PubMed] [Google Scholar]
- Allsopp N., Ruocco G. & Fratalocchi A. Molecular dynamics beyonds the limits: Massive scaling on 72 racks of a bluegene/p and supercooled glass dynamics of a 1 billion particles system. Journal of Computational Physics 231, 3432 – 3445 (2012). [Google Scholar]
- Ashcroft N. W. & Mermin N. D. Solid State Physics (Holt, Rinehart, Winston, New York, 1976). [Google Scholar]


