

Abstract
Benthic cyanobacterial communities from Guadarrama River (Spain) biofilms were examined using temperature gradient gel electrophoresis (TGGE), comparing the results with microscopic analyses of field-fixed samples and the genetic characterization of cultured isolates from the river. Changes in the structure and composition of cyanobacterial communities and their possible association with eutrophication in the river downstream were studied by examining complex TGGE patterns, band extraction, and subsequent sequencing of 16S rRNA gene fragments. Band profiles differed among sampling sites depending on differences in water quality. The results showed that TGGE band richness decreased in a downstream direction, and there was a clear clustering of phylotypes on the basis of their origins from different locations according to their ecological requirements. Multivariate analyses (cluster analysis and canonical correspondence analysis) corroborated these differences. Results were consistent with those obtained from microscopic observations of field-fixed samples. According to the phylogenetic analysis, morphotypes observed in natural samples were the most common phylotypes in the TGGE sequences. These phylotypes were closely related to Chamaesiphon, Aphanocapsa, Pleurocapsa, Cyanobium, Pseudanabaena, Phormidium, and Leptolyngbya. Differences in the populations in response to environmental variables, principally nutrient concentrations (dissolved inorganic nitrogen and soluble reactive phosphorus), were found. Some phylotypes were associated with low nutrient concentrations and high levels of dissolved oxygen, while other phylotypes were associated with eutrophic-hypertrophic conditions. These results support the view that once a community has been characterized and its genetic fingerprint obtained, this technique could be used for the purpose of monitoring rivers.
INTRODUCTION
Nutrient enrichment by humans is recognized as a leading cause of eutrophication and degradation of the ecological integrity of streams in the United States (1, 2). Establishing nutrient criteria has become the focus of a national effort to regulate nutrient content in all water body types in all regions of the United States (2). In order to protect and restore all aquatic ecosystems, the European Water Framework Directive (3) incorporates biological parameters in addition to widely used physicochemical metrics to establish the concept of ecological quality status of waters. Current challenges consist of determining reliable indicators for monitoring the ecological status of rivers in order to measure and assess the levels of environmental impacts such as eutrophication. Several methods have been developed for the purpose of monitoring rivers (4). However, it has been suggested that some specific features, for instance, in upland river sites with highly variable nutrient concentrations and ratios, require new or revised methods for monitoring purposes (4). Consequently, there is a continuous need to develop and apply novel and effective techniques to monitor the quality of running waters.
Our previous studies have shown changes in the structure and composition of epilithic cyanobacterial communities in response to eutrophication in watercourses (5–7). We found that cyanobacterial diversity decreased downstream, increasing the abundance of some tolerant species that proliferate because they are well adapted to high nutrient concentrations. Therefore, this phototrophic community has been proposed as being suitable for monitoring eutrophication in rivers (5, 8). However, to be effective, these methods require a high level of accuracy of taxonomic identification, but this is often time-consuming to achieve due to difficulties identifying species that exhibit extreme morphological variability and whose taxonomy is controversial (9). In addition, in many cases, samples have to be identified by comparison with isolated strains, which generate more problems due to culture selectivity, and because of the fact that many species often develop anomalous morphological states in culture (9, 10). Therefore, we aimed to find and develop a method to detect and analyze changes in cyanobacterial community composition from running waters with a faster and simpler yet still accurate technique.
Molecular fingerprint analyses using temperature gradient gel electrophoresis (TGGE)/denaturing gradient gel electrophoresis (DGGE) techniques have been widely used to determine changes in bacterial communities in different environments (11, 12) and to compare temporal and spatial population dynamics (13). In addition, advances in molecular methods for evaluating microbial diversity in natural environments have led to the use of new technical approaches for identification and quantification of microorganisms in contaminated waters that challenge traditional culture-based and microscopic techniques (14). However, molecular studies concerning the microbial ecology of lotic ecosystems (rivers and streams) are still rare compared with those of lakes and marine habitats (15, 16). A preliminary study using TGGE fingerprints, conducted in the Guadarrama River (central Spain), showed a decrease in cyanobacterial diversity along a pollution gradient during one climatological season (17). However, these TGGE profiles did not generate information on community composition or establish the phylogenetic relationships and called for further in-depth studies. The aim of this study was to assess changes in cyanobacterial communities regarding variations in nutrient concentrations in the Guadarrama River using this molecular approach, in parallel with microscopic analyses of field-fixed samples and the genetic characterization of cultured isolates. Biofilm samples were analyzed over 1 year to observe seasonal changes in the community structure of different sampling sites, and to detect possible associations with changing chemical and physical parameters. This study was supplemented by excising TGGE bands, sequence analyses of PCR reamplified products from 16S rRNA genes, and further phylogenetic analysis.
MATERIALS AND METHODS
Sampling.
Samples were collected from the rocks of Guadarrama River, located in central Spain, near Madrid. Sampling sites were selected in order to include locations (above and below populated areas) with different water quality characteristics. Sampling site 1 (UTM 30TVL4500407) is unaffected by human influence and is located upstream of an industrial and populated area; site 2 (UTM30TVK4486420) and site 3 (UTM30TVK4474419), 22 km and 38 km downstream, respectively, receive industrial and domestic sewage from the nearby human settlements. The samples were seasonally collected over 1 year (2006 to 2007). Three stones were selected at random at depths of 0.1 to 0.3 m from a submerged part of the riverbank at each sampling location. The attached cyanobacteria were removed by brushing an area of 16 cm2 of the stone and collected in sterile plastic bottles. Subsamples were separated for microscopic examination (fixed with formaldehyde at a final concentration of 4%), cyanobacterial isolation (aliquots kept at 4°C and at room temperature), and molecular analysis (frozen in liquid nitrogen). Samples of water were taken in 1-liter wide-mouthed polyethylene jars and kept cool in the dark. Nutrient chemical measurements were made in the field within 1 h of collection using a DRELL 2010 portable laboratory (Hach Company). Water was sampled in the first hours after dawn, and each sample was analyzed in triplicate.
Water analysis.
Dissolved oxygen, temperature, pH, and conductivity were measured in situ at every sampling site. The following electrodes were used and set up on the riverbank: for conductivity measurements, Crison CDTM-523 (Barcelona, Spain); for temperature and dissolved oxygen measurements, WTW OXI196 (Wissenschaftliche Technische Werkstetten, Weilheim, Germany); for pH measurements, WTW pH-96; and for discharge measurements, an FP 101-201 global water flow probe (Gold River). Nutrient chemical concentrations (NH4+-N, NO3−-N, NO2−-N, PO43−-P) were determined using colorimetric methods, adapted from Standard Methods for the Examination of Water and Wastewater (18), as previously described (19). Ammonium-N was measured by the Nessler method (estimated detection limit, 0.05 mg liter−1; precision, ±0.015 mg liter−1), reading the absorbance at 425 nm. When values were close to the detection limit (0.01 mg liter−1), the salicylate method was used, reading absorbance at 655 nm. NO3−-N was analyzed using a modification of the cadmium reduction protocol, using gentisic acid instead of 1-naphthylamine (estimated detection limit, 0.5 mg liter−1), reading absorbance at 500 nm. Samples below that detection limit were measured by a low-range method, which is an expanded modification of the former method, using a chromotropic acid indicator (estimated detection limit, 0.05 mg liter−1; precision, ±0.01 mg liter−1) and reading at the same wavelength. NO2−-N was determined colorimetrically using chromotropic and sulfanilic acids as indicators (estimated detection limit, 0.01 mg liter−1; precision, ±0.01 mg liter−1) and reading absorbance at 507 nm. PO43−-P was measured by a modification of the molybdenum blue procedure (estimated detection limit, 0.01 mg liter−1; precision, ±0.01 mg liter−1) and reading absorbance at 890 nm. Every analysis was performed three times. The standard deviations of the pseudoreplicate data remained within the typical precision ranges of each method.
Microscopic observation.
Cyanobacteria were identified under a dissecting microscope (Leica; Leica Microsystems) and an Olympus BH2-RFCA photomicroscope equipped with phase-contrast, epifluorescence, and video camera systems (Leica DC camera; Leica Microsystems). The percentage of abundance in natural samples was evaluated by counting the cells in a filament or as equal numbers of individual cells.
Isolation of genomic DNA and amplification of the 16S rRNA gene.
Total genomic DNA from frozen field samples of cyanobacteria was extracted using a modification of the protocol by Rodríguez et al. (17). A previous step was added at the beginning of the protocol: 1.5-ml aliquots of cell suspensions of each culture were homogenized and exposed to three freeze-thaw cycles, alternating immersion in liquid nitrogen and heating to 60°C. Cyanobacterial cells were lysed by a hot extraction procedure performed with 4% sodium dodecyl sulfate, 250 mM NaCl, 100 mM EDTA, and 350 mM guanidine isothiocyanate at 68°C, after vortex mixing for 1 min and sonication for 2 min. After incubation, the suspension was centrifuged for 15 min at 13,000 × g (Eppendorf Minifuge), and 600 μl of the supernatant phase was mixed with 75 μl of 5 M potassium acetate, 250 μl of 40% polyethylene glycol 8000, and 10 μg of glycogen. Crude DNA extracts were partially cleaned using hexadecyltrimethylammonium bromide (CTAB), chloroform extraction, isopropanol precipitation, and filtration with Microcon 100 microconcentrators (Amicon, Beverly, MA).
Approximately 450 bp of the 16S rRNA gene fragments (corresponding to Escherichia coli positions 358 to 805) were amplified using two sets of cyanobacterium-specific primers (20): primer pair CYA359F (with a 20-nucleotide GC clamp at the 5′ end) and CYA781R(a) and primer pair CYA359F (with a GC clamp) and CYA781R(b), as described by Boutte et al. (21). Thus, two PCR products were amplified for each sample and run on separate lanes in TGGE. The reverse primers CYA781R(a) and CYA781R(b), which differ by one base, amplify mainly heterocystous cyanobacteria and Chroococcales-Oscillatoriales, respectively. Thermocycling was performed using a Perkin-Elmer GeneAmp 2400 PCR system, and denaturation was carried out as previously described by Rodríguez et al. (17).
TGGE.
A temperature gradient gel electrophoresis (TGGE) Maxi system (Biometra) was used for sequence-specific separation of PCR products. Electrophoresis was performed by loading 6 μl of PCR product in a gel containing 5% acrylamide–bisacrylamide, 8 M urea, 2% glycerol, 20% formamide, and 1% Tris-acetate-EDTA (TAE), as described previously (17), with a gradient ranging from 38.5 to 49°C. A TGGE ladder was prepared by mixing equal amounts (3 μl) of the PCR products obtained from the DNA extracted from reference strains. This marker consisted of a PCR mix of 16S rRNA gene fragments from five cyanobacterial strains (Aphanocapsa muscicola UAM 385, Chamaesiphon investiens UAM 386, Aphanocapsa rivularis UAM 390, Leptolyngbya boryana UAM 391, and Cyanobium sp. UAM 406) previously isolated from the field samples.
The gels were then stained following a routine silver-staining protocol (22). Digital images of the gels were analyzed using the Quantity One software package (Bio-Rad Laboratories; Hercules, CA). TGGE banding patterns were characterized by the computer-assisted method described by Fromin et al. (12): after background subtraction and normalization, bands were described by their standardized position (Y, in pixels, on the image file), and its relative intensity in the profile (Pi), which is calculated by the relative surface of the peak in the profile (Pi = ni/N, where ni is the surface of the peak i and N is the sum of the surfaces for all the peaks within the profile). The data obtained on relative abundances and positions were then statistically analyzed (see below). A total of 400 bands were carefully excised from TGGE gels using an autoclaved surgical scalpel. Excised bands were resuspended as described by Sanguinetti et al. (22) and reamplified with the same primers without a GC clamp. The products were purified using a Real Clean Spin kit (Real) and commercially sequenced in both directions.
Phylogenetic analyses.
For the phylogenetic analysis, 16S rRNA gene sequences were aligned using the ClustalW program (23). Pairwise similarities were calculated with the EzTaxon server, a freely available web-based tool (http://eztaxon-e.ezbiocloud.net/). The alignment was checked and corrected manually with Bioedit (version 7.0.5.3) (24). The Mallard program (25) was used to identify chimeras and other anomalies in 16S rRNA gene sequences within multiple sequence alignments. Sequences were subjected to a BLAST search (http://www.ncbi.nlm.nih.gov/blast), and representative sequences assigned to known cyanobacterial taxa were added to the alignment. The phylogenetic trees were computed using neighbor-joining (NJ; Tajima and Nei model), maximum-parsimony (MP; close-neighbor-interchange search model with random tree addition), and maximum-likelihood (ML; general time-reversible model) analyses conducted in Mega 5.0 (26). Complete deletion handling of gaps and confidence levels were calculated via bootstrapping (27) using resampling numbers of 1,000 for NJ and MP and 100 for ML. Similar clustering results were obtained with the NJ, MP, and ML methods, so we have chosen to show here only the 16S rRNA sequence relationships with the neighbor-joining tree (450 bp).
Statistical analysis.
The similarities among TGGE band patterns from field samples were calculated by cluster analysis using Jaccard's coefficient (28) based on the presence or absence of TGGE bands at certain positions in each lane of the gel, and applying the unweighted-pair group method using average linkages (UPGMA). This generates a dendrogram depicting the genetic relationships among samples using the open-source program R (http://www.r-project.org/) with the prabclus (29) and phangorn (30) packages. ANOVA (Kruskal-Wallis one-way analysis of variance on ranks) was used to determine the significance of differences in band richness at different sampling sites. Canonical correspondence analysis (CCA), a multivariate statistical method, was used to examine associations between different TGGE banding patterns and environmental variables. This takes into account the environmental factors and the presence or absence of individual bands and the relative intensity of each band compared with the total band intensity in the lane. To estimate correlations between cyanobacterial abundance and the physicochemical variables of waters, each band on the TGGE gel was treated as an individual species. The analyses were carried out using the CANOCO program for Windows, version 4.5 (31).
Nucleotide sequence accession numbers.
The nucleotide sequences obtained in this work have been deposited in the GenBank database (accession numbers JX413386 to JX413497).
RESULTS
Water analysis.
The physical and chemical properties of water at sampling locations from the Guadarrama River are summarized in Fig. 1. There were marked differences between sampling sites, mainly with respect to nutrient content (dissolved inorganic nitrogen [DIN] and soluble reactive phosphate [SRP]) showing downstream increased eutrophication. SRP values were highest at sampling sites 2 and 3 (0.81 and 1.12 mg liter−1, respectively), which can be attributed to agricultural and domestic waste disposal. The highest levels of DIN were also detected at downstream locations. Nutrient concentrations also showed differences depending on the season, with the highest levels of phosphate and dissolved inorganic nitrogen at the downstream zone in summer and spring.
Fig 1.

Physicochemical parameters measured at each sampling point in the Guadarrama River during 1 year. DIN, dissolved inorganic nitrogen; SRP, soluble reactive phosphorus. Error bars indicate standard deviation (n = 3). Sampling sites: 1, white bars; 2, gray bars; 3, black bars.
Microscopic analysis.
Table S1 in the supplemental material lists the cyanobacteria observed at different sampling points, with their corresponding taxonomic assignments and their percentages of abundance. Species distributions and community structures differed between sampling sites according to differences in the nutrient concentrations at different locations. For instance, unicellular species were abundant at all sampling sites but some species were observed mainly at a specific site, such as Chamaesiphon investiens and Chroococcus minor at oligotrophic-mesotrophic upstream sites, and Cyanobium sp. at eutrophic downstream sites. Regarding the representatives of Oscillatoriales, Phormidium autumnale and Pseudanabaena catenata were more abundant at downstream sites, and Phormidium sp. appeared exclusively at downstream sites. In contrast, Leptolyngbya tenuis and Leptolyngbya nostocorum mainly appeared at upstream sites, while Leptolyngbya boryana was more abundant at sites 2 and 3. Abundance of heterocystous species decreased at downstream sites; some of them, such as Nostoc piscinale, Nostoc punctiforme, and Tolypothrix tenuis, as well as other nonheterocystous cyanobacteria, such as Leptolyngbya tenuis, Chroococcus minor, and Chamaesiphon investiens, were never found at site 3, emerging as potential bioindicators of changes in water quality.
TGGE fingerprinting analyses.
In order to evaluate fingerprinting differences among the different sampling sites, 24 TGGE gels were run, giving similar results for each sampling site and season over the year. Eight representatives of these are shown in Fig. 2, corresponding to two sets of cyanobacterium-specific primers in each of the four seasons. Some cyanobacteria may have more than one 16S rRNA gene copy, and their sequences may not be identical, with the consequence that they can yield more than one band in TGGE. For this reason, 13 strains isolated from this river were analyzed by TGGE, corresponding to the genera Chamaesiphon, Aphanocapsa, Pleurocapsa, Cyanobium, Pseudanabaena, Leptolyngbya, Phormidium, Nostoc, and Tolypothrix. All of them showed one band, except Tolypothrix sp., which had two bands (data not shown). In the gels, sampling sites 1, 2, and 3 were represented by three replicates (a, b, and c) that corresponded to three stones collected at each sampling point (Fig. 2). Band richness clearly differed among locations with distinct levels of eutrophication (significant differences, P < 0.001); more bands were present in samples from upstream than in those from downstream sites. A hierarchical cluster analysis was carried out based on the TGGE band positions in order to evaluate differences between genetic profiles among the different sites and seasons analyzed. A dendrogram was obtained (Fig. 3) showing clusters corresponding to sampling sites and seasons, indicating that banding patterns obtained from the three replicates had the same overall band distribution, although some differences were found in the profiles of site 2 in summer, possibly in relation to more variability in the water depth covering the stones during this dry season.
Fig 2.

Comparative analysis of TGGE genetic profiles of PCR-amplified fragments of 16S rRNA genes obtained from epilithic biofilms collected from the Guadarrama River. In the gels, three sampling points (1, 2, and 3) with three replicates (stones a, b, and c) during the different climatological seasons are represented. TGGE gels obtained with primer set CYA359F and CYA781R(b) (A) and using primers CYA359F and CYA781R(a) (B) are shown. A mixture of PCR products derived from five cyanobacterial strains isolated from the epilithon was applied as a reference marker (M) (from top to bottom: Aphanocapsa muscicola UAM 385, Chamaesiphon investiens UAM 386, A. rivularis UAM 390, Leptolyngbya boryana UAM 391, and Cyanobium sp. UAM 406).
Fig 3.

UPGMA dendrogram obtained from the cluster analysis performed among sampling sites over 1 year, based on the TGGE bands. Seasons: A, autumn; W, winter; Sp, spring; S, summer. Sampling sites: 1, white circles, 2, gray circles; 3, black circles. Replicates: stones a, b, and c. Dark vertical lines correspond to clustered sites at 50% similarity.
Biphasic relationships were found between the TGGE band number and nutrient concentrations (DIN and SRP) and conductivity (Fig. 4). More bands were recorded at the upstream site with low concentrations of DIN and SRP and low conductivity than at the downstream sites (P < 0.05). Beyond a threshold of nutrient concentrations or conductivity, as seem in the downstream sites, the number of bands approached a minimum, with no significant variation between the two sites (P > 0.05).
Fig 4.
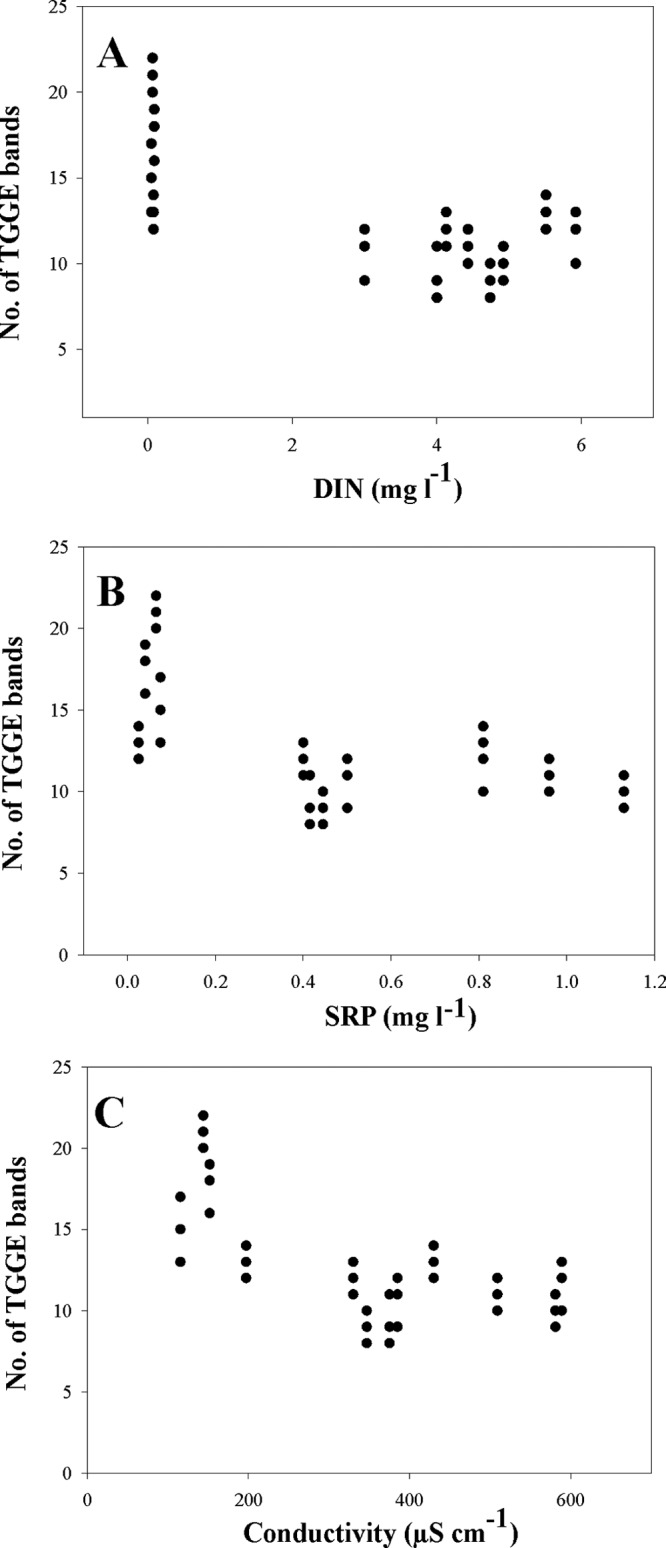
Relationship between TGGE band richness and (A) dissolved inorganic nitrogen (DIN), (B) soluble reactive phosphorus (SRP), and (C) conductivity.
Phylogenetic analysis.
16S rRNA gene sequences from the excised bands were compared with those of cyanobacterial strains and field samples from the Guadarrama and other Spanish rivers that had previously been genetically analyzed, and with other sequences obtained from GenBank. A total of 112 bands were successfully sequenced from a total of 200 excised and reamplified bands and used for phylogenetic analysis. Two phylogenetic trees were built: one for unicellular cyanobacteria (Fig. 5A) and the other for filamentous species and plastids (Fig. 5B). Six main groups were identified in the phylogenetic tree of the unicellular cyanobacteria (Fig. 5A). Group I was associated with the genus Chamaesiphon, of which several subclusters were distinguished. The similarities between these subclusters ranged from 97.7% to 98.7%. Groups A and C comprised bands from sampling site 1, while group D represented a phylotype that appeared in the three sampling sites, and subcluster B included two bands from site 2. Subcluster C also included a sequence of Chamaesiphon subglobosus PCC 7430 from GenBank (98.8% to 99.5% sequence similarity). Cluster II comprised bands from site 3, which did not exhibit more than 93.0% similarity to any of the cyanobacterial sequences available in the databases. Cluster III comprised a TGGE band from site 3 and the sequence of the cyanobacterium isolated from this river, which was identified as Aphanocapsa rivularis, as well as Synechocystis sequences from databases (99.5% to 100% similarity). Close to this group, TGGE bands from sites 1 and 3 and the isolated culture identified as A. muscicola were grouped (99.1% to 100% sequence similarity) (cluster IV). Cluster V was represented by sequences belonging to Pleurocapsa sp. and bands corresponding to sites 1 and 2 (95.7% to 100% similarity). Cluster VI contained sequences from the GenBank database of Cyanobium and Synechococcus grouped with a band from site 3 and the Cyanobium sp. isolate (95.8% to 96.0% sequence similarity).
Fig 5.


Neighbor-joining trees representing (A) unicellular cyanobacteria and (B) filamentous cyanobacteria and plastids based on the analysis of the 16S rRNA gene, showing the TGGE band sequences obtained in the present study (in bold). Numbers near nodes indicate bootstrap values greater than or equal to 60% in neighbor-joining (NJ), maximum-likelihood (ML), and maximum-parsimony (MP) analyses. TGGE bands were named according to the climatological seasons (A, autumn; W, winter; Sp, spring; S, summer), sampling sites (1 [white circles], 2 [gray circles], and 3 [black circles]), and replicates (stones a, b, and c).
In the phylogenetic tree of the filamentous cyanobacteria and plastids (Fig. 5B), the first cluster represented by 16 bands from sites 2 and 3 (99.5% similarity) belongs to the genus Pseudanabaena. In cluster II, corresponding to Phormidium-like cyanobacteria, it was possible to distinguish three subclusters (A, B, and C). Subcluster A included bands from site 1 and sequences from Phormidium, mainly from polar regions (99.3% to 99.8% sequence similarity), while subclusters B and C included bands from sites 2 and 3, respectively. Cluster III included novel populations represented by a large number of bands with sequence similarities ranging from 96.0% to 98.0% with no clear matches identified from a BLAST search of the database. The closest relative was Leptolyngbya frigida, but this had less than 94.0% similarity. Differences in the locations of bands belonging to the genus Leptolyngbya were also observed in the phylogenetic analysis. Bands from site 1 and the isolate identified as Leptolyngbya nostocorum together with sequences from the databases constituted cluster IV (99.3% sequence similarity), while bands of sites 2 and 3 clustered together with the isolated strain identified as Leptolyngbya boryana, as well as with Leptolyngbya boryana sequences retrieved from databases (99.5% to 100% sequence similarity) in cluster V. Cluster VI corresponded to plastid sequences, which were not taken into account in subsequent analyses. No sequences belonging to heterocystous cyanobacteria were obtained from any of the samples analyzed.
Banding patterns.
On the basis of genetic profiles and phylogenetic analysis, we can infer the banding patterns for the different locations, thereby revealing the changes in the populations of cyanobacteria along the river (Fig. 6). Bands from different lanes and similar electrophoretic migration patterns were sequenced in order to confirm that they corresponded to the same sequence: e.g., B45 (14 bands), B35 (8 bands), B27 (8 bands), B1 (6 bands), B14 (5 bands), B4, B29, and B43 (3 bands from each one), and B21 and B41 (2 bands from each one). All the bands at the same position had the same nucleotide composition or were nearly identical (99.3% to 100% similarity), as we found in a similar study in another Spanish river (Guadalix River; unpublished data). Consequently, bands with the same electrophoretic position were considered the same phylotype as reported by other authors (15, 32–37). Only three phylotypes corresponding to Chamaesiphon had different electrophoretic migration profiles with almost the same sequence, although most sequences recovered corresponded to the same position. For instance, in the case of phylotype D, 7 of the 10 identical sequences were from the same position.
Fig 6.

Diagram of the TGGE banding profiles after computer-assisted characterization and phylogenetic analyses of excised bands.
Banding patterns differed, whereby some bands appeared only in certain sampling sites while others appeared in all of them. Bands corresponding to some phylotypes of Cyanobium sp. and Phormidium sp. were present only at sites 2 and 3, while others of these genera were found only at site 1. In the case of Leptolyngbya, bands corresponding to phylotypes assigned to L. boryana appeared at all sampling sites, but with greater intensity at sites 2 and 3, while bands corresponding to L. nostocorum were found at site 1. Bands corresponding to Pseudanabaena, Aphanocapsa, and Pleurocapsa were observed at all sampling points, where they exhibited spatiotemporal variability. A number of bands with no clear phylogenetic affiliation had different banding patterns, whereby some appeared mainly or exclusively upstream, others appeared only downstream, and some were observed at all sites, although with a higher intensity downstream (Fig. 6).
Relationship between TGGE band profiles and environmental variables.
CCA was performed to examine the relationship between the banding pattern and environmental variables, such as soluble reactive phosphorus (SRP) and dissolved inorganic nitrogen (DIN) concentrations, water temperature, and discharge and dissolved oxygen levels (Fig. 7). The first two axes accounted for 36.8% of the variance (axis 1, 22.2%; axis 2, 14.6%). The Monte Carlo unrestricted permutation test on the first eigenvalue indicated that the abiotic factors were significantly associated with the first axis (P < 0.01), and the results of the test for all canonical axes were also statistically significant (P < 0.01). The first axis was correlated mainly with discharge, dissolved oxygen, and water temperature (intraset correlation coefficients, 0.75, 0.67, and 0.34); the second axis was mainly defined by DIN, conductivity, and SRP (intraset correlation coefficients, 1.00, 0.88, and 0.84, respectively). Sampling points were defined according to their physical-chemical parameters: site 1 is located in the upper side of the graph, defined by a high level of dissolved oxygen and a low nutrient load; in contrast, sites 2 and 3 are located in the lower quadrants, both being defined by high nutrient load, conductivity, and discharge. The spread of data supports differences between the oligotrophic conditions in the upper part of the graph and the eutrophic-hypertrophic conditions in the lower part of the figure. Therefore, four band groups were defined. Bands present only at site 1 appear together in the upper side of the figure (groups A and B). Group A comprised bands found mainly at site 1 (oligotrophic-mesotrophic conditions), B18, B23, B26, and B34. According to the phylogenetic analysis, these bands were associated with Chamaesiphon phylotypes A and D. In addition to these, two bands were observed (B41 and B43) whose sequences belonged to the genus Phormidium, in particular, to phylotype A. Similarly, group B is situated at the upper right side of the graph, close to site 1S (summer), possibly related to a lower discharge rate. This group included bands affiliated with the genus Chamaesiphon (B9 and B24), phylotype A and cluster II, respectively. In addition, the phylogenetic analysis indicated some bands affiliated with Leptolyngbya nostocorum (B42). Finally, there were some positions within group B corresponding to uncultured cyanobacteria (B33).
Fig 7.

Canonical correspondence analysis biplot based on the TGGE bands, with respect to environmental variables. DIN, dissolved inorganic nitrogen; SRP, soluble reactive phosphorus; DO, dissolved oxygen. Climatological seasons: A, autumn; W, winter; Sp, spring; S, summer. Sampling sites: 1, white circles; 2, gray circles; 3, black circles. Bands are indicated with black triangles.
In contrast, group C was located in the lower quadrants of the graph next to sites 2 and 3, with high concentrations of nutrients (DIN and SRP), conductivity, and discharge. Within this group, there was a large group of bands corresponding to the genus Phormidium, particularly phylotypes B (B49) and C (B46), according to the phylogenetic analysis. Other bands were also observed affiliated to Cyanobium sp. (B50), Leptolyngbya boryana (B36), Pseudanabaena sp. (B45), and Chamaesiphon sp., which belong to phylotype D (B27). Another group of bands was clustered in the lower right quadrant (group D) which was associated with temperature. These bands were identified as Pleurocapsa sp. (B8 and B31), Aphanocapsa muscicola (B4), and Chamaesiphon sp., from phylotype D (B25). We observed some positions of bands in the center of the graph whose distribution could not be associated with a specific sampling point or environmental condition. These bands were identified as belonging to the genera Pseudanabaena (B47), Leptolyngbya (B37), Aphanocapsa (B28), and Chamaesiphon (B19, B29, and B30).
DISCUSSION
Changes in TGGE band profiles.
Genetic profiles of TGGE reflected changes in the structure and composition of benthic cyanobacterial communities in the Guadarrama River regarding increases in the nutrient content downstream. Our analysis revealed differences in the phylotypes present at each sampling site. We found specific fingerprinting patterns with characteristic band profiles for each site, which enables the different samples to be compared directly. The cluster analysis performed with the genetic profiles was consistent with these differences between sampling sites and seasons. Moreover, TGGE band richness decreased in a downstream direction, in parallel with the reduction in the number of species at lower locations observed by microscopic analysis, as has been found in previous studies in this river (17). Fingerprinting approaches based on comparisons of microbial communities in biofilms have been used to evaluate and characterize the ecological responses to differences in stream water quality (38). However, certain limitations, such as comigration of different DNA fragments and the presence of different bands with the same sequence in a single lane, have been noted that can introduce bias into the analysis and, therefore, jeopardize the correct interpretation of the data (39). The present study found no evidence for comigration of different DNA fragments; instead, bands in the community patterns could be unambiguously assigned to a single phylotype, since comigrating bands had identical or almost identical sequences, as previously found in several DGGE/TGGE studies (15, 32–37). Although we cannot completely exclude the possibility of identical sequences from different bands in the same lane, the small number of such cases suggests that this is not a major concern for our analysis. In addition, the TGGE fingerprints revealed greater genetic diversity than the morphological observations by microscopy, as has been noted in other studies (33, 40). However, according to the databases, we found many bands that corresponded to uncultured bacteria, as has been observed in other studies using TGGE/DGGE techniques (41, 42). The explanation could be that the organisms isolated and cultivated to date represent only a small fraction of the true microbial diversity (43). This highlights the value of polyphasic approaches for studying cyanobacterial communities so that phenotypic and genotypic information and the contributions of the ecological characteristics thereof can be integrated.
Cyanobacterial phylotypes and water quality.
Band phylogenetic analysis identified separate clusters corresponding to phylotypes from different sampling sites that were associated with differences in water quality. Characteristic phylotypes could be distinguished within the unicellular cyanobacteria (Chroococcales) that appeared at the oligotrophic-mesotrophic sites, while others were observed in downstream sites with eutrophic-hypertrophic waters. Likewise, different phylotypes related to filamentous cyanobacteria without heterocysts (Oscillatoriales) corresponded to different trophic conditions. Similarly, some phylotypes that were not associated with any particular morphotype or database sequence were unevenly distributed, with a group of bands that mainly appeared upstream, and another cluster that was mainly present downstream.
According to the phylogenetic analysis, taxa observed in the microscopic examination of field samples were the most common phylotypes found in TGGE sequences, although new populations (with no clear matches in the databases or in our cultures) were also abundant. However, we could not recover any bands corresponding to heterocystous cyanobacteria. This was probably due to their low abundance in this river, and their even almost disappearing in downstream sites with high nutrient levels, as previously found in other studies (5, 6, 8, 17, 44). Therefore, some TGGE bands from the heterocystous cyanobacteria were probably too weak to be sequenced and so remained anonymous, as noted in other studies (45). Another limitation noted in studies of cyanobacterial communities in soil desert crusts and polar soils (46, 47) was the presence of sheaths in filaments and colonies in their natural environment, which hinder DNA extraction. However, this bias was minimized in the present study by using a soil DNA extraction method modified for benthic cyanobacteria (17). Banding patterns of TGGE analyses of 13 isolated cyanobacteria, including four heterocystous strains, showed that DNA was successfully extracted and amplified (data not shown).
The abundance and distribution of cyanobacteria depend largely on environmental factors. However, we still lack information about the influence of important environmental characteristics on their distribution. A knowledge of the factors that regulate their presence, and the ability to control them, would help us regulate their abundance and use them as indicators of the trophic status of water. In our study, different phylotypes showed various responses to environmental characteristics such as nutrient concentrations (DIN and SRP), conductivity, discharge, and dissolved oxygen. These results are consistent with those of studies in eutrophic lakes (37, 48) and of similar investigations in rivers on bacterial community composition (13, 35, 49), where the dominance of different genotypes largely related to changes in nutrient concentrations and dissolved oxygen has been noted.
Monitoring rivers: the use of cyanobacterial ecotypes as bioindicators.
Despite an increased general awareness of the need to protect all types of aquatic habitats, human impacts continue to impair the services that these ecosystems provide. More-extensive monitoring studies focusing on major biological compartments are needed to quantify the current condition of aquatic resources. Since phototrophic biofilms are directly in contact with the flowing water and relatively sessile, they are potentially good indicators of water quality in the streams at a given place and time. These may therefore be affected and subsequently used to detect the early effects of disturbances in the ecosystem that may arise, integrating these effects over extended periods of time (50, 51). Cyanobacteria, as primary producers with a key role in the N and C cycles, can be useful bioindicators, given that any detrimental effect on this phototrophic community may have a negative effect on nutrient availability to organisms at higher trophic levels. Typically, bioindicators used for assessing water quality in flowing waters are based on macroinvertebrates and diatoms (4). However, the use of benthic cyanobacteria to assess the nutrient status of rivers in various ways has also been proposed (5–8, 17, 44). The suitability of cyanobacteria for assessing water quality in watercourses has been discussed for many years. They have been found as the dominant group in clean waters (52, 53), but, on the other hand, a high relative abundance of filamentous cyanobacteria has been reported in response to eutrophication, organic pollution, or increasing fecal coliform concentration (54–56). Our results from this and previous studies (5–7, 17) as well as literature data from bioindicator lists (57, 58) confirm previous suggestions that there is not always a general response for all cyanobacteria as a group, since the responses of single species can be quite different. Therefore, cyanobacteria provide reliable and interpretable indications of specific changes in water quality, particularly with regard to trophic status, endorsing their use for monitoring rivers.
Biomonitoring, defined as the systematic use of living organisms or their responses to determine the condition of or changes in the environment, has been historically focused on ecological methods and higher levels of organization, e.g., communities and ecosystems (59). Ecological coherence of bacterial taxonomic ranks higher than the species level has led to the suggestion of their use as alternative ecologically meaningful units (60). However, the results of our research show distinct patterns of ecological consistency below the level of the genus. In cyanobacteria (and other bacteria), ecological traits can be taxon specific, leading to differential distribution of natural populations, and closely related cyanobacteria can occupy distinct ecological niches (9, 60). An ecotype-based model of the structure of microbial populations has been proposed (61) in which all related inhabitants of a unique ecological niche are thought to belong to a single, stable ecotype, within which genetic diversity is limited by a cohesive force(s), either periodic selection or genetic drift or both. Ecotypes are equated with true biological groupings and might account for speciation (61, 62). Within this environmental context, our results have allowed us the identification of the occupants of particular ecological niches, so that the particular ecologically relevant taxa, different ecotypes, can be selected as bioindicators of water quality. This supports the use of cyanobacteria for monitoring pollution in running waters.
Monitoring methods: applicability of molecular approaches for assessing water quality.
There is growing interest in the application of molecular methods for studying the microbial communities of environmental systems, in order to identify problem sources and determine the effect of implemented remedial solutions, in an effort to improve our waters (63). Selection of the most suitable monitoring method is of crucial interest for a good assessment of water pollution. Since waterborne pathogens pose a significant threat to human health and a proper assessment of microbial water quality is of urgent need, microbial water quality monitoring has undergone a tremendous transition in recent years, with the novel molecular tools beginning to offer rapid, high-throughput, sensitive, and specific detection of a wide spectrum of microbial pathogens that challenge traditional culture-based techniques. For instance, real-time quantitative PCR (qPCR), high-density microarrays, and pyrosequencing are currently used to achieve simultaneous detection and semiquantification of harmful species in environmental samples (64, 65). However, in waters with no pathogenic microbe contamination, monitoring methods have traditionally been based on molecular fingerprinting approaches. DGGE, in particular, has been widely used to assess microbial community structure in contaminated soil and water (reference 66 and references therein). A few papers have reported the use of new technical approaches, e.g., qPCR, for identifying and counting cyanobacteria in aquatic ecosystems, but it has mainly been used for the specific evaluation of toxigenic cyanobacteria (67–69). Use of DNA arrays for the field detection of cyanobacterial species has also been investigated, and comparison of the microarray data with those obtained by microscopic examination of the same samples revealed consistent results, demonstrating the potential of this approach for monitoring cyanobacteria (14). The results of this study demonstrate the utility of TGGE paired with sequencing and microscopy for the identification of potential bioindicator species. A next logical step, once bioindicator taxa are identified, would be the development of faster, easier methods (e.g., qPCR, antibody capture, etc.) for routine monitoring of a select subset of bioindicator organisms. DGGE/TGGE could be used intermittently to ensure that taxa other than the target bioindicator species are not changing. When combined with other methods, like DGGE, this would provide a comprehensive picture of the internal dynamics of specific cyanobacterial populations, in any given water body, in terms of both quantities and genotype diversity (68). Findings of this study support our previous suggestion (17) that if we need to detect potential new changes in the communities due, for instance, to new sources of pollution, as rapidly as possible, the fingerprint characteristic of a community in a specific place could be used like a bar code that, like a detector or sentinel, would act as an “early warning” device alerting us of the possible presence of pollutants in the environment. The benefits of the implementation of this molecular fingerprinting in biomonitoring are apparent, as it has the potential of an efficient and rapid routine analysis of changes in cyanobacterial communities in response to pollution, allowing us to assess watercourse quality of rivers in surveillance networks. However, demonstrating the broader applicability of the proposed approach will require more studies of fluvial systems in different regions.
Supplementary Material
ACKNOWLEDGMENTS
This work was supported by grants from the Ministerio de Educación y Ciencia, Spain (CGL2008-02397/BOS), and from the Comunidad Autónoma de Madrid, Spain (S2009/AMB-1511).
We thank Daniel Aguirre de Cárcer and Virginia Rodríguez for advice on TGGE technical management, Miguel Redondo for statistical orientation and informatics support, and Philip Mason for correcting the English of the manuscript. We also acknowledge the anonymous reviewers whose constructive criticisms contributed to improvement of the manuscript.
Footnotes
Published ahead of print 21 December 2012
Supplemental material for this article may be found at http://dx.doi.org/10.1128/AEM.03351-12.
REFERENCES
- 1. Malmqvist B, Rundle S. 2002. Threats to the running water ecosystems of the world. Environ. Conserv. 29:134–153 [Google Scholar]
- 2. USEPA (United States Environmental Protection Agency) 2000. Nutrient criteria. Technical guidance manual. Rivers and streams. EPA-822-B-00-002 United States Environmental Protection Agency, Washington, DC [Google Scholar]
- 3. European Communities (EC) 22 December 2000. Directive 2000/60/EC of the European Parliament and of the Council of the 23 October 2000 establishing a framework for community action in the field of water policy. Off. J. Eur. Communities. http://eur-lex.europa.eu/LexUriServ/LexUriServ.do?uri=OJ:L:2000:327:0001:0072:en:PDF
- 4. Whitton BA. 2012. Changing approaches to monitoring during the period of the ‘Use of Algae for Monitoring Rivers’ symposia. Hydrobiologia 695:7–16 [Google Scholar]
- 5. Douterelo I, Perona E, Mateo P. 2004. Use of cyanobacteria to assess water quality in running waters. Environ. Pollut. 127:377–384 [DOI] [PubMed] [Google Scholar]
- 6. Perona E, Bonilla I, Mateo P. 1998. Epilithic cyanobacterial communities and water quality: an alternative tool for monitoring eutrophication in the Alberche River (Spain). J. Appl. Phycol. 10:183–191 [Google Scholar]
- 7. Perona E, Mateo P. 2006. Benthic cyanobacterial assemblages as indicators of nutrient enrichment regimes in a Spanish river. Acta Hydrochim. Hydrobiol. 34:67–72 [Google Scholar]
- 8. Whitton BA. 1999. Perspective on the use of phototrophs to monitor nutrients in running waters. Aquat. Conserv. Mar. Freshw. Ecosyst. 9:545–549 [Google Scholar]
- 9. Komárek J, Anagnostidis K. 1999. Cyanoprokaryota-1. Teil: Chroococcales, p 1–548 In Ettl H, G̈artner G, Heynig H, Mollenhauer D. (ed), Süsswasserflora von Mitteleuropa 19/1. Gustav Fischer, Jena, Germany [Google Scholar]
- 10. Perona E, Aboal M, Bonilla I, Mateo P. 2003. Cyanobacterial diversity in a Spanish river determined by means of isolation of cultures. Morphological variability of isolates in relation to natural populations. Arch. Hydrobiol. Algol. Stud. 109:475–486 [Google Scholar]
- 11. Díez B, Bauer K, Bergman B. 2007. Epilithic cyanobacterial communities of a marine tropical beach rock (Heron Island, Great Barrier Reef): diversity and diazotrophy. Appl. Environ. Microbiol. 73:3656–3668 [DOI] [PMC free article] [PubMed] [Google Scholar]
- 12. Fromin N, Hamelin JS, Tarnawski D, Roesti K, Jourdain-Miserez N, Forestier S, Teyssier-Cuvelle Gillet F, Aragno M, Rossi P. 2002. Statistical analysis of denaturing gel electrophoresis (DGE) fingerprinting patterns. Environ. Microbiol. 4:634–643 [DOI] [PubMed] [Google Scholar]
- 13. Anderson-Glenna MJ, Bakkestuen V, Clipson NJW. 2008. Spatial and temporal variability in epilithic biofilm bacterial communities along an upland river gradient. FEMS Microbiol. Ecol. 64:407–418 [DOI] [PubMed] [Google Scholar]
- 14. Humbert JF, Quiblier C, Gugger M. 2010. Molecular approaches for monitoring potentially toxic marine and freshwater phytoplankton species. Anal. Bioanal. Chem. 397:1723–1732 [DOI] [PubMed] [Google Scholar]
- 15. Brümmer IHM, Felske A, Wagner-Döbler I. 2003. Diversity and seasonal variability of β-proteobacteria in biofilms of polluted rivers: analysis by temperature gradient gel electrophoresis and cloning. Appl. Environ. Microbiol. 69:4463–4473 [DOI] [PMC free article] [PubMed] [Google Scholar]
- 16. Leff LG. 1994. Stream bacterial ecology: a neglected field? ASM News 60:135–138 [Google Scholar]
- 17. Rodríguez V, Aguirre de Cárcer D, Loza V, Perona E, Mateo P. 2007. A molecular fingerprint technique to detect pollution-related changes in river cyanobacterial diversity. J. Environ. Qual. 36:464–468 [DOI] [PubMed] [Google Scholar]
- 18. APHA (American Public Health Association) 1980. Standard methods for the examination of water and wastewater, 15th ed American Public Health Association, Washington, DC [Google Scholar]
- 19. Perona E, Bonilla I, Mateo P. 1999. Spatial and temporal changes in water quality in a Spanish river. Sci. Total Environ. 241:75–90 [Google Scholar]
- 20. Nübel U, Garcia-Pichel F, Muyzer G. 1997. PCR primers to amplify 16S rRNA genes from cyanobacteria. Appl. Environ. Microbiol. 63:3327–3332 [DOI] [PMC free article] [PubMed] [Google Scholar]
- 21. Boutte C, Grubisic S, Balthasart P, Wilmotte A. 2006. Testing of primers for the study of cyanobacterial molecular diversity by DGGE. J. Microbiol. Methods 65:542–550 [DOI] [PubMed] [Google Scholar]
- 22. Sanguinetti CJ, Neto ED, Simpson AJG. 1994. Rapid silver staining and recovery of PCR products separated on polyacrylamide gels. Biotechniques 17:914–918 [PubMed] [Google Scholar]
- 23. Thompson JD, Higgins DG, Gibson TJ. 1994. CLUSTAL W: improving the sensitivity of progressive multiple sequence alignment through sequence weighting, position-specific gap penalties and weight matrix choice. Nucleic Acids Res. 22:4673–4680 [DOI] [PMC free article] [PubMed] [Google Scholar]
- 24. Hall TA. 1999. Bioedit: a user-friendly biological sequence alignment editor and analysis program for Windows 95/98/NT. Nucleic Acids Symp. Ser. 41:95–98 [Google Scholar]
- 25. Ashelford KE, Chuzhanova NA, Fry JC, Jones AJ, Weightman AJ. 2006. New screening software shows that most recent large 16S rRNA gene clone libraries contain chimeras. Appl. Environ. Microbiol. 72:5734–5741 [DOI] [PMC free article] [PubMed] [Google Scholar]
- 26. Tamura K, Peterson D, Peterson N, Stecher G, Nei M, Kumar S. 2011. MEGA5: molecular evolutionary genetics analysis using maximum likelihood, evolutionary distance, and maximum parsimony methods. Mol. Biol. Evol. 28:2731–2739 [DOI] [PMC free article] [PubMed] [Google Scholar]
- 27. Felsenstein J. 1985. Confidence limits on phylogenies: an approach using the bootstrap. Evolution 39:783–791 [DOI] [PubMed] [Google Scholar]
- 28. Jaccard P. 1908. Nouvelles recherches sur la distribution florale. Bull. Soc. Vaud. Sci. Nat. 44:223–270 [Google Scholar]
- 29. Hennig C, Hausdorf B. 2004. Distance-based parametric bootstrap tests for clustering of species ranges. Comput. Stat. Data Anal. 45:875–896 [Google Scholar]
- 30. Schliep KP. 2011. Phangorn: phylogenetic analysis in R. Bioinformatics 27:592–593 [DOI] [PMC free article] [PubMed] [Google Scholar]
- 31. Ter Braak CJF, Šmilauer P. 2002. Canoco reference manual and Cano-Draw for Windows user's guide: software for canonical community ordination (version 4.5). Microcomputer Power, Ithaca, NY [Google Scholar]
- 32. Boutte C, Komárková J, Grubisic S, Znachor P, Bataille A, Zapomělova E, Gullukaya A, Jezberová J, Wilmotte A. 2005. A polyphasic approach to assess the cyanobacterial diversity of summer samples from Czech reservoirs. Arch. Hydrobiol. Algol. Stud. 117:177–195 [Google Scholar]
- 33. Casamayor EO, Pedrós-Alió C, Muyzer G, Amann R. 2002. Microheterogeneity in 16S ribosomal DNA-defined bacterial populations from a stratified planktonic environment is related to temporal changes and to ecological adaptations. Appl. Environ. Microbiol. 68:1706–1714 [DOI] [PMC free article] [PubMed] [Google Scholar]
- 34. Cébron A, Coci M, Garnier J, Laanbroek HJ. 2004. Denaturating gradient gel electrophoretic analysis of ammonia-oxidizing bacterial community structure in the lower Seine River: impact of Paris wastewater effluents. Appl. Environ. Microbiol. 70:6726–6737 [DOI] [PMC free article] [PubMed] [Google Scholar]
- 35. de Figueiredo R, Pereira MJ, Moura A, Silva L, Bárrios S, Fonseca F, Henriques I, Correia A. 2007. Bacterial community composition over a dry winter in meso- and eutrophic Portuguese water bodies. FEMS Microbiol. Ecol. 59:638–650 [DOI] [PubMed] [Google Scholar]
- 36. Gadanho M, Sampaio JP. 2004. Application of temperature gradient electrophoresis to the study of yeast diversity in the estuary of the Tagus River, Portugal. FEMS Yeast Res. 5:253–261 [DOI] [PubMed] [Google Scholar]
- 37. Schiaffino MR, Unrein F, Gasol JM, Farias ME, Estevez C, Balagué V, Izaguirre I. 2009. Comparative analysis of bacterioplankton assemblages from maritime Antarctic freshwater lakes with contrasting trophic status. Polar Biol. 32:923–936 [Google Scholar]
- 38. Vinten AJ, Artz RR, Thomas N, Potts JM, Avery L, Langan SJ, Watson H, Cook Y, Taylor C, Abel C, Reid E, Singh BK. 2011. Comparison of microbial community assays for the assessment of stream biofilm ecology. J. Microbiol. Methods 85:190–198 [DOI] [PubMed] [Google Scholar]
- 39. Sekiguchi H, Tomioka N, Nakahara T, Uchiyama H. 2001. A single band does not always represent single bacterial strains in denaturing gradient gel electrophoresis. Biotechnol. Lett. 23:1205–1208 [Google Scholar]
- 40. Taton A, Grubisic S, Brambilla E, De Wit R, Wilmotte A. 2003. Cyanobacterial diversity in natural and artificial microbial mats of Lake Fryxell (McMurdo Dry Valleys, Antarctica): a morphological and molecular approach. Appl. Environ. Microbiol. 69:5157–5169 [DOI] [PMC free article] [PubMed] [Google Scholar]
- 41. Dorador C, Vila I, Imhoff JF, Witzel KP. 2008. Cyanobacterial diversity in Salar de Huasco, a high altitude saline wetland in northern Chile: an example of geographical dispersion? FEMS Microbiol. Ecol. 64:419–432 [DOI] [PubMed] [Google Scholar]
- 42. Lemke MJ, Lienau EK, Rothe J, Pagioro TA, Rosenfeld J, DeSalle R. 2009. Description of freshwater bacterial assemblages from the Upper Paraná River floodpulse system, Brazil. Microb. Ecol. 57:94–103 [DOI] [PubMed] [Google Scholar]
- 43. Cohan FM. 2011. Are species cohesive? A view from bacteriology, p 43–65 In Walk ST, Feng PCH. (ed), Population genetics of bacteria: a tribute to Thomas S. Whittam. ASM Press, Washington, DC [Google Scholar]
- 44. Branco LE, Pereira JL. 2002. Evaluation of seasonal dynamics and bioindication potential of macroalgal communities in a polluted tropical stream. Arch. Hydrobiol. 155:147–161 [Google Scholar]
- 45. Casamayor EO, Schäfer H, Bañeras L, Pedrós-Alió C, Muyzer G. 2000. Identification of and spatio-temporal differences between microbial assemblages from two neighboring sulfurous lakes: comparison by microscopy and denaturing gradient gel electrophoresis. Appl. Environ. Microbiol. 66:499–508 [DOI] [PMC free article] [PubMed] [Google Scholar]
- 46. Garcia-Pichel F, Lopez-Cortes A, Nübel U. 2001. Phylogenetic and morphological diversity of cyanobacteria in soil desert crusts from the Colorado Plateau. Appl. Environ. Microbiol. 67:1902–1910 [DOI] [PMC free article] [PubMed] [Google Scholar]
- 47. Turicchia S, Ventura S, Schütte U, Soldati E, Zielke M, Solheim B. 2005. Biodiversity of the cyanobacterial community in the foreland of the retreating glacier Midtre Lovènbreen, Spitsbergen, Svalbard. Arch. Hydrobiol. Suppl. 117:427–440 [Google Scholar]
- 48. Rajaniemi-Wacklin P, Rantala A, Kuuppo P, Haukka K, Sivonen K. 2008. Cyanobacterial community composition in shallow, eutrophic Lake Tuusulanjärvi studied by microscopy, strain isolation, DGGE and cloning. Algol. Stud. 126:137–157 [Google Scholar]
- 49. Beier S, Witzel KP, Marxsen J. 2008. Bacterial community composition in Central European running waters examined by temperature gradient gel electrophoresis and sequence analysis of 16S rRNA genes. Appl. Environ. Microbiol. 74:188–199 [DOI] [PMC free article] [PubMed] [Google Scholar]
- 50. Burns A, Ryder DS. 2001. Potential for biofilms as biological indicators in Australian riverine systems. Ecol. Manage. Restor. 2:53–63 [Google Scholar]
- 51. Sabater S, Guasch H, Ricart M, Romaní A, Vidal G, Klünder C, Schmitt-Jansen M. 2007. Monitoring the effect of chemicals on biological communities. The biofilm as an interface. Anal. Bioanal. Chem. 387:1425–1434 [DOI] [PubMed] [Google Scholar]
- 52. Aboal M. 1989. Epilithic algal communities from River Segura Basin, southeastern Spain. Arch. Hydrobiol. 116:113–124 [Google Scholar]
- 53. Mateo P, Berrendero E, Perona E, Loza V, Whitton BA. 2010. Phosphatase activities of cyanobacteria as indicators of nutrient status in a Pyrenees river. Hydrobiologia 652:255–268 [Google Scholar]
- 54. Necchi Júnior O, Branco HZ, Dip MR. 1994. Uso de microalgas para avaliaçao da poluçião orgânica no Rio Preto, noroeste do estado de São Paulo. Ann. Acad. Bras. Cienc. 66:359–371 [PubMed] [Google Scholar]
- 55. Shaji C, Patel RJ. 1991. Chemical and biological evaluation at pollution in the River Sabarmati at Ahmedabad, Gujrat. Phykos 30:91–100 [Google Scholar]
- 56. Vis C, Hudon C, Cattaneo A, Pinel-Alloul B. 1998. Periphyton as an indicator of water quality in the St. Lawrence River, Québec, Canada. Environ. Pollut. 101:13–24 [DOI] [PubMed] [Google Scholar]
- 57. Rott E, Pfister P, Van Dam H, Pipp E, Pall K, Binder N, Ortler K. 1999. Indikationslisten für Aufwuchsalgen in österreichischen Fließgewässern, Teil 2: Trophieindikation sowie geochemische Präferenz, taxonomische und toxikologische Anmerkungen. Bundesministerium für Land- und Forstwirtschaft, Vienna, Austria [Google Scholar]
- 58. Schneider SC, Lindstrøm EA. 2011. The periphyton index of trophic status PIT: a new eutrophication metric based on non-diatomaceous benthic algae in Nordic rivers. Hydrobiologia 665:143–155 [Google Scholar]
- 59. Li L, Zheng B, Liu L. 2010. Biomonitoring and bioindicators used for river ecosystems: definitions, approaches and trends. Proc. Environ. Sci. 2:1510–1524 [Google Scholar]
- 60. Philippot L, Andersson SGE, Battin TJ, Prosser JI, Schimel JP, Whitman WB, Hallin S. 2010. The ecological coherence of high bacterial taxonomic ranks. Nat. Rev. Microbiol. 8:523–529 [DOI] [PubMed] [Google Scholar]
- 61. Cohan FM, Perry EB. 2007. A systematics for discovering the fundamental units of bacterial diversity. Curr. Biol. 17:R373–R386 [DOI] [PubMed] [Google Scholar]
- 62. Achtman M, Wagner M. 2008. Microbial diversity and the genetic nature of microbial species. Nat. Rev. Microbiol. 6:431–440 [DOI] [PubMed] [Google Scholar]
- 63. Simpson JM, Santo Domingo JW, Reasoner DJ. 2002. Microbial source tracking: state of the science. Environ. Sci. Technol. 36:5279–5288 [DOI] [PubMed] [Google Scholar]
- 64. Aw TG, Rose JB. 2012. Detection of pathogens in water: from phylochips to qPCR to pyrosequencing. Curr. Opin. Biotechnol. 23:422–430 [DOI] [PMC free article] [PubMed] [Google Scholar]
- 65. Brankatschk R, Bodenhausen N, Zeyer J, Bürgmann H. 2012. Efficiency of real-time pPCR depends on the template: a simple absolute quatification method correcting for qPCR efficiency vatiations in microbial commnity samples. Appl. Environ. Microbiol. 78:4481–4489 [DOI] [PMC free article] [PubMed] [Google Scholar]
- 66. Malik S, Beer M, Mallavarapu M, Naidu R. 2008. The use of molecular techniques to characterize the microbial communities in contaminated soil and water. Environ. Int. 34:265–276 [DOI] [PubMed] [Google Scholar]
- 67. Churro C, Pereira P, Vasconcelos V, Valério E. 2012. Species-specific real-time PCR cell number quantification of the bloom-forming cyanobacterium Planktothrix agardhii. Arch. Microbiol. 194:749–757 [DOI] [PubMed] [Google Scholar]
- 68. Martins A, Vasconcelos V. 2011. Use of qPCR for the study of hepatotoxic cyanobacteria population dynamics. Arch. Microbiol. 193:615–627 [DOI] [PubMed] [Google Scholar]
- 69. Rasmussen JP, Giglio S, Monis PT, Campbell RJ, Saint CP. 2008. Development and field testing of a real-time PCR assay for cylindrospermopsin-producing cyanobacteria. J. Appl. Microbiol. 104:1503–1515 [DOI] [PubMed] [Google Scholar]
Associated Data
This section collects any data citations, data availability statements, or supplementary materials included in this article.