

Abstract
To form three-dimensional capillary tubes, endothelial cells must establish contacts with the extracellular matrix that provides signals for their proliferation, migration, and differentiation. The transcription factor Fosl1 plays a key role in the vasculogenic and angiogenic processes as Fosl1 knockout embryos die with vascular defects in extraembryonic tissues. Here, we show that Fosl1−/− embryonic stem cells differentiate into endothelial cells but fail to correctly assemble into primitive capillaries and to form tube-like structures. FOSL1 silencing affects in vitro angiogenesis, increases cell adhesion, and decreases cell mobility of primary human endothelial cells (HUVEC). We further show that FOSL1 is a repressor of αv and β3 integrin expression and that the down-modulation of αvβ3 rescues the angiogenic phenotype in FOSL1-silenced HUVEC, while the ectopic expression of αvβ3 alone reproduces the phenotypic alterations induced by FOSL1 knockdown. FOSL1 represses the transcription of both αv and β3 integrin genes by binding together with JunD to their proximal promoter via the transcription factor SP1. These data suggest that FOSL1-dependent negative regulation of αvβ3 expression on endothelial cells is required for endothelial assembly into vessel structures.
INTRODUCTION
Vasculogenesis and angiogenesis are complex processes that, in response to angiogenic stimuli initiated by growth factors, result in a highly organized sequence of events, including cellular proliferation, migration, and formation of primitive endothelial tubes. During these processes endothelial cells (ECs) must proliferate, migrate, and establish highly dynamic cell-cell contacts and interactions with the extracellular matrix (ECM).
Adhesion of endothelial cells with the ECM is mediated by integrins, which have been shown to be required during the vasculogenic and angiogenic processes (1). Mice null for αv die in utero showing vasculature abnormalities in the placenta (2), and neutralizing antibodies to integrin αvβ3 lead to abnormal vessel structures (3). The interaction of endothelial cells with the ECM is essential for endothelial cell proliferation, migration, and survival (4) and is required for tissue organization and differentiation. Moreover, upon interaction with the ECM, integrins form complexes with angiogenic receptors, contributing to their activation (5–10).
Fosl1 (Fos-like 1; also named Fra1) knockout mice die between embryonic day 10.0 (E10.0) and E10.5 showing abnormal yolk sacs with placentas that are largely avascular (11).
Fosl1 is an early gene that belongs to the activator protein 1 (AP-1) family of dimeric transcription factor genes (12). Fosl1 regulation is mediated by an intronic enhancer, which contains an AP-1 consensus and an E-box element next to each other (13–15).
Fos proteins, including Fosl1, bind to the DNA, forming heterodimers with Jun proteins although they cannot homodimerize or heterodimerize with ATF proteins. Fosl1 lacks a transactivation domain. Therefore, its contribution to AP-1-dependent transcription depends on its partner, and it has been previously described as acting also as a negative regulator of AP-1 (13, 16–20). In spite of the lack of a Fosl1 transactivation domain, Fosl1 overexpression in rat fibroblasts induces anchorage-independent growth, invasiveness in vitro, and tumor growth in nude mice (12, 13, 21–23).
Here, we demonstrate that in primary endothelial cells FOSL1 controls the expression of the integrins αv and β3 by binding to their regulatory elements and inducing their down-modulation. FOSL1 does not bind to αv and β3 promoters via an AP-1 consensus site but through the nuclear factor SP1 that binds CG-rich sequences present on these promoters. FOSL1 silencing results in the upregulation of αvβ3 and alteration of in vitro angiogenesis, suggesting that the expression levels of αvβ3 on the surface of endothelial cells is critical for the correct assembly of endothelial cells into capillary-like structures.
MATERIALS AND METHODS
Plasmids DNA constructs.
Silencing of FOSL1 was performed by annealing and cloning the oligonucleotides 5′-TCGAGGAGACTGACAAACTGGAATTCAAGAGATTCCAGTTTGTCAGTCTCCTTTTTCTGCA-3′ (sense) and 5′-GAAAAAGGAGACTGACAAACTGGAATCTCTTGAATTCCAGTTTGTCAGTCTCC-3′ (antisense) into ClaI-SalI sites of the cassette for the expression of small hairpin RNA (shRNA) under the U6 promoter in a lentiviral vector, as previously described (24). As an unrelated silencing control, a lentiviral vector expressing an shRNA targeting green fluorescent protein (shGFP) was used. Integrin-silencing experiments were performed using the retroviral vector pLKO.1 from The RNA Consortium (TRC) lentiviral shRNA library (Open Biosystems, Huntsville, AL) expressing shRNAs for human integrin αv (oligonucleotide TRCN0000003235) and human integrin β3 (oligonucleotide TRCN0000003240). The full-length cDNA of human FOSL1 was amplified with the oligonucleotides FOR (5′-CGCGAGATCTATGTTCCGAGACTTCGGG-3′) and REV (5′-CGCGCTCGAGTCACAAAGCGAGGAGGGT-3′) from a human muscle cDNA library (reference sequence NM_005438). The resulting fragment was cloned in a TOPO PCR cloning vector (Invitrogen, Carlsbad, CA) and then subcloned in the expression retrovirus vector MIGR1, kindly obtained from Guido Franzoso. The shRNA-resistant FOSL1 mutant (rescue construct) was obtained by using a QuickChange site-directed mutagenesis kit (Promega, Madison, WI), changing the ACTGACAAA shRNA core sequence (coding for T-D-K amino acids) to ACCGATAAG (substitutions are underlined). Human αv and β3 promoters were amplified from genomic DNA with the following oligonucleotides: M363 (5′-GAGAGGTACCAACAGTCGCACGGAAGT-3′) and M364 (5′-AAAGCCATCGCCGAAGTG-3′) for the αv promoter; M402 (5′-TACGCAAGCTTGGGATGT-3′) and M403 (5′-TCCAAGTCCGCAACTTGA-3′) for the β3 promoter. The PCR products were digested with the restriction enzymes indicated on Fig. 7A and cloned in the luciferase reporter plasmid pGL3-Basic vector (Promega, Madison, WI).
Fig 7.

FOSL1 is a negative regulator of integrin αv and β3 subunit gene transcription. (A) Schematic representation of the human integrin αv and β3 promoter regions. Numbers shown refer to the distance from the transcription start site. The putative SP1 sites are indicated by ovals; other putative binding sites are represented as rectangles. The nucleotide positions indicate the genomic region cloned upstream of the luciferase reporter gene in the pGL3 plasmid; the restriction sites used are indicated. Arrowheads indicate the locations of the oligonucleotides used for the ChIP assay. (B) Reporter constructs carrying the αv and β3 promoters were cotransfected in HUVEC together with shGFP (control), an shFOSL1-expressing plasmid, or shFOSL1 together with the shRNA-resistant FOSL1 (rescue). Promoter activity values were normalized using Renilla activity, and fold induction was calculated with respect to transfected control samples. Mean values for three experiments ± standard deviations of the means are shown.
Human integrin αv and β3 cDNAs were subcloned in pCCL lentiviral vectors from Addgene plasmids 27290 and 27289, respectively (25).
Cell culture transfection and transduction.
Wild-type and Fosl1 knockout embryonic stem cells (ESC) (11) were grown and differentiated as previously described (26). Human umbilical vein endothelial cells (HUVEC) were grown on gelatin-coated surfaces in M199 medium (Gibco) supplemented with 20% fetal bovine serum (FBS), 50 U/ml penicillin-streptomycin, 10 U/ml heparin, and 100 μg/ml brain extract and filtered through a 0.22-μm-pore-size sterile filter (SCGPU05RE, Stericup-GP Filter Unit; Millipore). Virus preparation and HUVEC infections were previously described (27).
293GPG adenovirus 5-transformed human embryonic kidney 293GPG packaging cells were used for the generation of retrovirus vector particles (28). The 293GPG cells were grown at 37°C and 5% CO2 in high-glucose Dulbecco's modified Eagle medium (DMEM) supplemented with 10% heat-inactivated FBS and 1 μg/ml tetracycline (Sigma).
For transfection, HUVEC were plated on six-well dishes at 1.5 × 10⁵ cells per well. After 24 h cells were transfected using 9 μl of Attractene reagent (Qiagen) and 1.2 μg of total DNA (0.77 μg of luciferase plasmid DNA, 0.07 μg of cytomegalovirus [CMV]-Renilla plasmid DNA [Promega], and 0.36 μg of FOSL1- or shRNA-expressing plasmid DNA). After 6 h the medium was replaced with new complete medium, and 16 h later the cells were starved in M199 medium supplemented with 0.25% bovine serum albumin (BSA) and 0.25% fetal calf serum (FCS). After 24 h cells were analyzed for luciferase and Renilla activity using a Dual-Glo luciferase assay (Promega). Promoter activity values were normalized using Renilla activity, and the fold induction was calculated with respect to the control-transfected sample. Mean values for three independent experiments ± standard deviations (SD) of the means are shown.
Tube formation, adhesion, and wound-healing migration assays.
A tube formation assay was performed as previously described (29). For an integrin inhibition assay, cells were seeded on BD Matrigel and incubated in complete medium in the absence or presence of cilengitide at different concentrations.
For adhesion assays, 96-well plates were coated for 1 h at room temperature with 0.5 μg/ml vitronectin (Invitrogen). After three rinses with phosphate-buffered saline (PBS), wells were blocked with 3% BSA in M199 medium for 1 h at room temperature and rinsed three times before cells were plated. HUVEC were resuspended in culture medium and plated at 4 × 10⁴ cells/well. After incubation at 37°C for 0.5 to 1 h, unattached cells were removed by rinsing the wells with PBS. Attached cells were fixed in 4% paraformaldehyde, stained with 0.5% crystal violet (Sigma), and quantified by optical density (OD) reading at 570 nm. Results are given for each substrate as fold induction of OD values over cells infected with the control vector and represent the means of duplicate wells ± SD (n = 3).
For the wound-healing assays, monolayers were wounded with a sterile pipette tip, washed with culture medium, and incubated in complete medium. Cells were observed under a light microscope and photographed at 0 and 6 or 8 h.
Protein extracts, immunoblotting, and immunofluorescence.
Cells were lysed in radioimmunoprecipitation assay (RIPA) plus buffer (50 mM Tris-HCl [pH 7.2], 100 mM NaCl, 1% Triton X-100, 0.1% SDS, 1% Na-deoxycholate, 50 mM NaF, 2 mM Na-orthovanadate, 1 mM dithiothreitol [DTT], antiprotease and antiphosphatase cocktails [Sigma-Aldrich]), and cell debris was eliminated by centrifugation at 21,000 × g at 4°C for 10 min. Immunofluorescence assays were carried out as previously described (30). The following antibodies were used for immunoblotting and immunofluorescence: anti-Fra1 (sc-605), anti-SP1 (sc-59), anti-integrin αv (sc-6618), anti-focal adhesion kinase (anti-FAK; sc-558), and antipaxillin (sc-5574) from Santa Cruz Biotechnology (Santa Cruz, CA); anti-phospho-FAK (Tyr925) (P∼Y925 FAK; 3284) from Cell Signaling; anti-integrin β3 (AB2984) from Millipore; and anti-β-actin (A5441) from Sigma-Aldrich. Fluorescein isothiocyanate (FITC)-conjugated phalloidin (P1951; Sigma-Aldrich) was used for F-actin labeling.
RNA extraction and quantification.
Total mRNAs were extracted with a PureLink RNA kit (Invitrogen), and quantitative real-time reverse transcription-PCR (RT-PCR) was performed with a SuperScript III Platinum One-Step qRT-PCR kit (Invitrogen) and Rotor-Gene 6000 real-time rotary analyzer (Corbett Life Science). For the specific reverse transcription-quantitative PCR (RT-qPCR), we used the following oligonucleotides: L481 (5′-TTTGGCCTGTGCCCCATTGTA-3′) and L482 (5′-CTTGTGCAGTCCGAGTTGCTA-3′) for the αv integrin transcript; L496 (5′-TTGGCAAGATCACGGGCAAGT-3′) and L497 (5′-TTGCTGGACATGCAGGTGTCA-3′) for β3 integrin transcript; and K400 (5′-GAAGGTGAAGGTCGGAGTC-3′) and K401 (5′-GAAGATGGTGATGGGATTTC-3′) for β3 integrin transcript.
Microarray.
A microarray experiment was performed on an Illumina platform, and data were analyzed using the BeadStudio Gene Expression Module (GX) and normalized using default parameters. Probes with a log2 |FC| (where FC is fold change) of >1 and a P value of <0.05 were selected for further analysis. Heat maps were obtained using the Bioconductor package in R. Differential expression analysis of up- and downregulated genes was obtained by plotting genes on their log2 expression values. Gene ontology for molecular functions was performed by using the PANTHER (protein analysis through evolutionary relationships) database (31).
ChIP assay.
Each chromatin immunoprecipitation (ChIP) experiment was performed in three independent biological samples as previously described (14). Immunoprecipitation was performed with the following antibodies: from Santa Cruz Biotechnology, anti-FRA1 (sc-183) and anti-JunD (sc-74); from Upstate, anti-histone H3 (06-755), anti-acetyl-histone H4 Lys16 (H4K16ac; 06-762), anti-acetyl-histone H4 Lys12 (07-595), anti-acetyl-histone H4 Lys8 (07-328), anti-acetyl-histone H3 Lys5 (07-327), and anti-acetyl-histone H4 (06-598); from Abcam, anti-histone H4 (ab1791), anti-acetyl-histone H3 Lys9 (ab10812), anti-acetyl-histone H3 Lys14 (ab52946), anti-dimethyl H3K9 (ab1220), and anti-integrin β3 (ab2984).
DNA was analyzed by quantitative real-time PCR by using a SYBR GreenER kit (Invitrogen). All experiment values were normalized to those obtained with a nonimmune serum and divided by input, using a previously described procedure (32). The data shown represent triplicate real-time quantitative PCR measurements of the immunoprecipitated DNA. The data are expressed as percentages and express 1/100 of the DNA inputs. For the amplification of immunoprecipitated DNA, we used the following oligonucleotides: M1004 (5′-GAGGGAAGCAAAGGACCG-3′) and M1005 (5′-GCAAGAGGGCTGAGCTTCG-3′) for αV integrin promoter DNA; M1010 (5′-GCTCCCTCTCAGGCG-3′) and M1011 (5′-TGGGTGGGACGCAACG-3′) for β3 integrin promoter DNA; O246 (5′-CCAGGCACACCGTCCTAC-3′) and O247 (5′-AAGGAGGGGCCTTCTGTC-3′) for NOTCH4 promoter DNA.
RESULTS
Fosl1 is involved in the assembly of mouse endothelial cells into primitive capillary tubes in vitro.
Fosl1 knockout embryos die with vascular defects in extraembryonic tissues (11). To verify at which stage of vascular differentiation Fosl1 was required, we induced in vitro differentiation of endothelial cells using wild-type or knockout mouse embryonic stem cells (ESC) following a differentiation protocol previously set up in the laboratory (33). After treatment with vascular endothelial growth factor A (VEGF-A), embryoid bodies (EB) obtained from wild-type ESC organize into large vessel-like structures with central endothelial cells surrounded by smooth muscle cells (Fig. 1A). In contrast, endothelial and mural cells, obtained from Fosl1−/− ESC, although differentiated, were unable to form vessel-like structures but presented an apparent lack of organization (Fig. 1B). Moreover, when plated on Matrigel, endothelial Fosl1 −/− cells were unable to form a capillary-like network (Fig. 1C to E), suggesting that the in vivo defect of placental vascularization by Fosl1 knockout mice (11) was not due to deficient endothelial differentiation; rather, Fosl1 appears to be required for the correct assembly of endothelial cells (ECs) into vessel structures.
Fig 1.

Fosl1−/− ESC differentiating into endothelial cells do not assemble correctly with smooth muscle cells. Indirect immunofluorescence analysis by double staining of endothelial and mural precursors is shown. Wild-type (A) and Fosl1−/− (B) ESC differentiated in the presence of VEGF-A for 5.5 days were stained for the EC markers platelet endothelial cell adhesion molecule 1 (PECAM-1; green) and α-SMA (red). The wild-type cells form a network of primitive capillary tubes, which start to be surrounded by smooth muscle cells, while Fosl1−/− cells are altered in their morphology and unable to organize into primitive capillary tubes. Scale bar, 15 μm. Wild-type (C) and Fosl1−/− (D) ECs were plated on Matrigel to test their in vitro angiogenesis ability (original magnification, ×100). (E) Quantification of tube length was performed based on the results shown in panels C and D. Fosl1 knockdown significantly affected tube formation. Data are presented as means ± SD from four different fields randomly chosen from each group from three sets of experiments.
FOSL1 silencing affects morphology, adhesion on vitronectin, and migration of endothelial cells.
To understand the molecular mechanisms by which Fosl1 contributes to the formation of the vascular tissue and the generality of its function, we used primary HUVEC, which can be cultivated as pure endothelial cells and are a good system to perform functional experiments by gene silencing. FOSL1 knockdown was obtained by expression of a small hairpin RNA targeting FOSL1 (shFOSL1) into a lentiviral vector under the control of the constitutive U6 promoter. FOSL1 silencing reduced FOSL1 expression by about 90% in HUVEC. FOSL1 expression in these cells was reestablished by infection of the FOSL1-silenced cells with a retroviral vector expressing a FOSL1 mutant resistant to the shRNA. This rescue plasmid allowed us to reexpress FOSL1 in the silenced cells to ensure that the phenotypes observed were not due to silencing artifacts (Fig. 2A).
Fig 2.

FOSL1 silencing affects migration and organization of endothelial cells into capillary-like structures. HUVEC were infected with lentiviral vectors expressing unrelated (control) or FOSL1 shRNA (shFOSL1). FOSL1-silenced HUVEC were infected with a viral vector expressing an shRNA-resistant FOSL1 mutant (rescue). (A) FOSL1 expression was analyzed by Western blotting, and β-actin was used to verify equal loading. (B) Representative images of infected primary endothelial cells plated on BD Matrigel and incubated in complete medium for 20 h for in vitro angiogenesis assays (original magnification, ×40). (C) Quantification of tube length was performed based on the results shown in panel B. FOSL1 knockdown significantly affected tube formation. Data are presented as means ± SD from four different fields randomly chosen from each group from three sets of experiments (n = 3). (D) FOSL1 silencing reduced HUVEC migration in wound-healing migration assays. Infected HUVEC monolayers were wounded with a sterile pipette tip, washed with culture medium, and incubated in complete medium. Cells were observed under a light microscope and photographed initially and after 6 h (original magnification, ×100). (E) Migration assay. Cells were seeded in the upper wells of a 48-well microchemotaxis Boyden chamber. The lower wells contained 10 ng/ml VEGF-A. Cells migrating through a polycarbonate filter were quantified by staining the cells with hematoxylin-eosin solution. The results are expressed as the means ± SD of three independent experiments performed in triplicate. (F) HUVEC expressing a control shRNA, shFOSL1, or FOSL1 silencing vector together with an shRNA-resistant FOSL1 were fixed and stained for phalloidin and paxillin. FOSL1 silencing affected the distribution of focal adhesion. Scale bar, 25 μm. (G) HUVEC expressing a control shRNA, shFOSL1, or FOSL1 silencing vector together with an shRNA-resistant FOSL1 were fixed and stained for FAK and phospho-Y925 FAK as indicated. FOSL1 silencing affected the distribution of focal adhesion. Scale bar, 40 μm. (H) Western blot analysis of protein extracts, which shows no differences in paxillin or P∼Y925 FAK protein levels upon FOSL1 silencing.
HUVEC silenced for FOSL1 did not show alteration of cell cycle progression or viability (data not shown). Instead, they showed a reduced ability to form vascular capillary networks on Matrigel and reduced migration, as measured by wound-healing assays (Fig. 2B to D). The altered migration phenotype was confirmed with a migration assay in Boyden chambers, where the FOSL1-silenced cells showed a significantly reduced migration toward VEGF-A (Fig. 2E).
At the morphological level we observed that while control cells presented a regular actin cytoskeleton organized in parallel bundles in HUVEC, FOSL1 silencing induced a high degree of disorganization of the actin cytoskeleton, which was filling the cells in all directions (Fig. 2F).
We further analyzed two proteins of the focal adhesion complex, focal adhesion kinase (FAK) and paxillin, which actively collaborate with the actin cytoskeleton to maintain the normal morphology of the cell. In FOSL1-silenced cells the spatial organization of both proteins was strongly altered, and their organization was partially restored by the expression of the FOSL1 rescue construct (Fig. 2F and G). The same altered distribution was also observed for P∼Y925 FAK, a protein modification associated with the ability of cells to dynamically regulate cell adhesion (29). Beyond this abnormal spatial organization, no alteration of the protein amounts could be detected (Fig. 2H).
FOSL1 controls integrin receptor αvβ3 in endothelial cells.
The above-described experiments suggest that FOSL1 regulates the transcription of genes implicated in the control of cell shape, migration, and adhesion. Gene expression profiling in wild-type and FOSL1-silenced HUVEC revealed that FOSL1 knockdown altered the expression of about 900 genes, of which about 60% were downregulated and 40% were upregulated (Fig. 3A and B; see also Table S1 in the supplemental material).
Fig 3.

FOSL1 is a negative regulator of the expression of integrin αv and β3. (A) Pie chart of microarray analysis showing genes differentially expressed following FOSL1 silencing in HUVEC. (B) Average levels of expression of genes upregulated and downregulated by FOSL1 silencing in HUVEC. (C) Heat map of microarray analysis showing genes up- and downregulated following FOSL1 silencing in HUVEC. Integrin αv and β3 genes are identified in red. (D and E) Expression levels of integrin αv and β3 mRNAs, respectively, were analyzed by RT-qPCR. Results were normalized to glyceraldehyde-3-phosphate dehydrogenase mRNA. Mean values from three independent experiments are shown with standard deviations. (F) Western blot analysis of the expression of integrins αv and β3 and FOSL1 in cells silenced for FOSL1 and in FOSL1-silenced HUVEC infected with a viral vector expressing an shRNA-resistant FOSL1 mutant (rescue). β-Actin was used to verify equal loading.
As expected, the plasma membrane urokinase plasminogen receptor (uPAR) and its activator (uPA) were downregulated by FOSL1 silencing (Fig. 3C). This result is in accordance with previous studies showing that both promoters contain a functional AP-1 site that in different cell lines has been shown to be recognized by FOSL1 (21, 34, 35, 36, 37).
In contrast to observations in Rcho-1 trophoblast stem cells (38), in endothelial cells we did not observe FOSL1-dependent activation of metalloproteinases. The microarray showed only an increase of matrix metalloproteinase 9 (MMP-9) RNA by FOSL1 silencing (Fig. 3C), and functional analysis did not show variations in metalloprotease activities between wild-type and FOSL1 knockdown cells (data not shown).
In contrast, FOSL1 knockdown produced an increase of both integrins αv (ITGAV) and β3 (ITGB3) (Fig. 3C), which was confirmed by quantitative RT-PCR (Fig. 3D and E) and by Western blotting (Fig. 3F), thereby indicating that FOSL1 represses αv and β3 expression in endothelial cells.
Analysis of the protein distribution showed that FOSL1 silencing produced an augmented distribution of both αv and β3 proteins on the cell surface (Fig. 4A) and a significant increase in adhesion to the αv and β3 substrate vitronectin (Fig. 4B and C). The increased adhesion to vitronectin was due to FOSL1 down-modulation as expression of the FOSL1 rescue construct restored the level of endothelial adhesion to this substrate.
Fig 4.
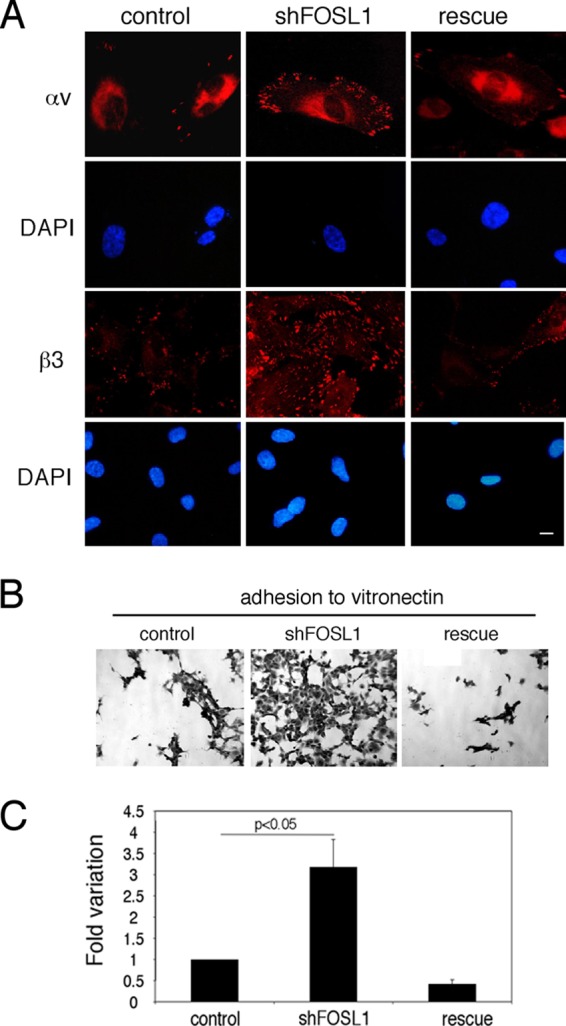
FOSL1 downregulation increases integrin expression on the cell surface and cell adhesion. (A) HUVEC silenced for FOSL1 (shFOSL1) exhibited increased numbers of focal adhesion plaques containing αvβ3. Cell staining of integrins αv and β3 in HUVEC silenced for FOSL1 and in FOSL1-silenced cells infected with a viral vector expressing an shRNA-resistant FOSL1 mutant (rescue) is shown. Scale bar, 10 μm. DAPI (4′,6′-diamidino-2-phenylindole) was used for nuclear staining. (B) HUVEC adhesion to vitronectin-coated filters (original magnification, ×40). (C) Quantification of cell adhesion measured by crystal violet staining. Data are presented as OD values of independent experiments ± SD (n = 3).
To verify whether the increase of αv and β3 expression dependent on FOSL1 silencing was sufficient to alter the endothelial cell phenotype, we expressed αv and β3 in HUVEC by cell infection with lentiviral vectors (Fig. 5A). The ectopic expression of αv and β3 increased endothelial cell adhesion to vitronectin (Fig. 5B), inhibited the migration of HUVEC in a Boyden chamber assay (Fig. 5C) and a wound-healing assay both on vitronectin and on gelatin-coated plates (Fig. 5 D), and reduced the ability of HUVEC to form vascular capillary networks on Matrigel (Fig. 5E and F). Moreover, immunostaining analysis of HUVEC expressing ectopic αv and β3 revealed an alteration in the distribution of FAK and paxillin with an increase of focal adhesion sites, similar to the effect induced by FOSL1 silencing (compare Fig. 2F and 5G).
Fig 5.

Overexpression of integrin αv and β3 subunits increases adhesion and affects migration of endothelial cells. (A) Total cell extracts of HUVEC expressing either GFP (control) or integrin αv and β3 subunits were analyzed by Western blotting using specific antibodies. (B) HUVEC as described in panel A were plated on vitronectin, and adhesion was measured as described in Materials and Methods. Results are given as OD values of crystal violet-stained cells and represent the mean of independent experiments ± SD (n = 3). (C) Migration assay performed in Boyden chambers as described in the legend of Fig. 2E. The results are expressed as the means ± SD of three independent experiments performed in triplicate. (D) HUVEC as described in panel A were wounded with a sterile pipette tip, washed with culture medium, and incubated in complete medium on vitronectin or gelatin-coated plates as indicated. Cells were observed under a light microscope and photographed at 0 and 8 h. A representative experiment is shown (original magnification, ×50). (E) HUVEC as described in panel A were plated on BD Matrigel and incubated in complete medium for 20 h for in vitro angiogenesis assays. (F) Quantification of tube length was performed based on the results shown in panel E. Data are presented as means ± SD from four different fields randomly chosen from each group from three sets of experiments. (G) HUVEC as described in panel A were stained for phalloidin (green) and FAK (red). Scale bar, 30 μm.
To verify whether the reduction of αv and β3 in FOSL1-silenced HUVEC could restore their ability to form in vitro a capillary network, we performed a rescue experiment by reducing αv and β3 expression with increasing concentrations of lentiviral particles expressing shRNAs to silence these two integrins (Fig. 6A).
Fig 6.
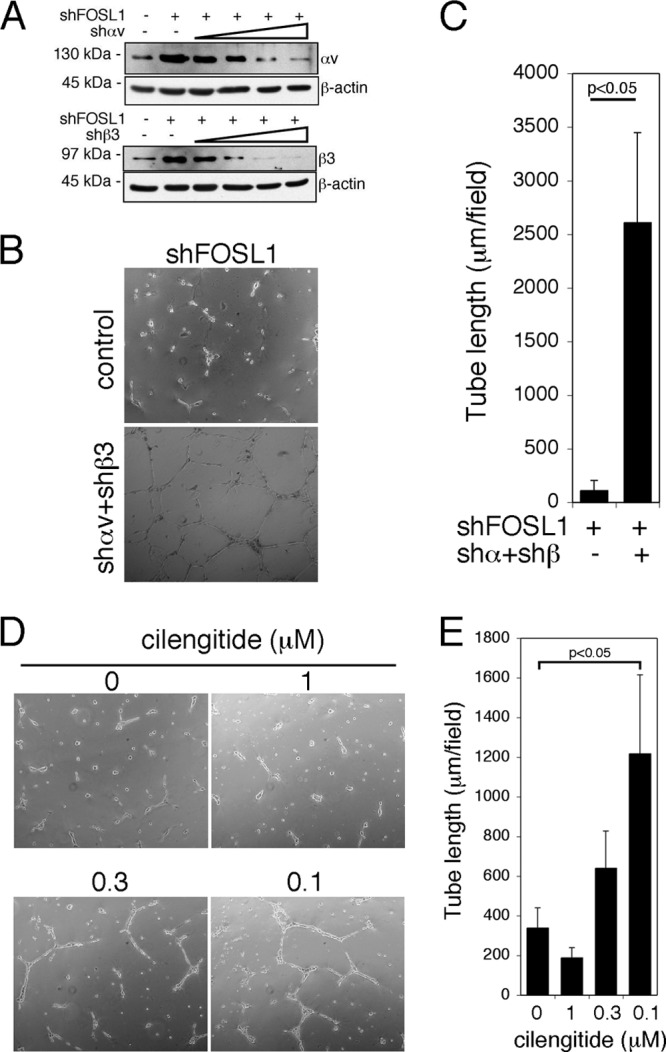
Integrin αv and β3 down-modulation rescues the ability of HUVEC silenced for FOSL1 to form vascular capillary networks on Matrigel. (A) FOSL1-silenced HUVEC were infected with increasing amounts of lentiviral vectors expressing integrin αv and β3 shRNAs (shαv and shβ3) as indicated. Integrin expression was analyzed by Western blotting. β-Actin was used to verify equal loading. (B) HUVEC, with integrin down-modulation to levels comparable to the endogenous wild type by lentiviral silencing, were plated on BD Matrigel for in vitro angiogenesis assays (original magnification, ×40). (C) Tube length quantification was performed based on the results shown in panel B. Data are presented as mean ± SD from four different fields randomly chosen from each group from three independent sets of experiments. (D) HUVEC silenced for FOSL1 were plated on BD Matrigel and incubated in complete medium in the presence of cilengitide at different concentrations. Inhibition of αvβ3 interaction with the ECM by cilengitide at low doses partially restored the tube formation on Matrigel impaired by FOSL1 silencing. (E) Tube length quantification was performed based on the results shown in panel. Data are presented as means ± SD from four different fields randomly chosen from each group from three independent sets of experiments.
The reduction of αv and β3 expression to levels similar to those of control cells rescued FOSL1-silenced HUVEC to form a capillary network on Matrigel (Fig. 6B and C). We also inhibited, in FOSL1-silenced HUVEC, the binding of the αv and β3 to the ECM by the use of increasing concentrations of cilengitide, a cyclic peptide that is a specific inhibitor of the αvβ3 and αvβ5 integrins (39). Cilengitide at a concentration of 0.1 μM restored, at least in part, the ability of the FOSL1-silenced HUVEC to form a capillary-like network in Matrigel (Fig. 6D and E).
Collectively, these results indicate that the overexpression of αv and β3 on the cell surface is a key player in the reduced angiogenic activity observed in endothelial cells upon FOSL1 knockdown.
FOSL1 downregulates the transcription of αv and β3 promoters by indirect binding to their promoters.
Next, we analyzed the mechanism of FOSL1-dependent down-modulation of αv and β3 expression. Inspection of the promoter regions of αv and β3 with the TRANSFAC database (40) revealed that these TATA-less promoters contain putative SP1 and ETS binding sites but not putative AP-1 binding sites (Fig. 7A). To verify whether FOSL1 directly regulates their transcription, we fused the human αv and β3 promoter regions with a luciferase reporter gene and analyzed the expression of the reporter gene in wild-type and FOSL1-silenced cells. FOSL1 knockdown significantly increased the transcriptional activity of both αv and β3 promoters, and this effect was lost in FOSL1-rescued cells (Fig. 7B and C). Thus, FOSL1-dependent down-modulation of αv and β3 is transcriptional, and the FOSL1-responsive elements are contained within the promoter regions included in the constructs used although no AP-1 binding sites were present on these promoters.
As it was previously demonstrated that in chicken embryo fibroblasts the SP1-dependent SPARC (secreted protein, acidic, cysteine rich) promoter is downregulated by v-Jun (41) and in Caco-2 cells the p21 promoter is repressed by Myc interacting with SP1 (42), we further analyzed whether FOSL1 could act as a negative regulator of the αv and β3 promoters via SP1. Chromatin immunoprecipitations (ChIPs) followed by real-time quantitative PCR revealed FOSL1 recruitment to both αv and β3 promoters as well as to the promoter of NOTCH4 (Fig. 8A). NOTCH4 was used as a positive control as it contains an AP-1 site recognized by FOSL1 (43) and putative SP1 consensus sites. We observed a significant reduction in FOSL1 binding to all three promoters following FOSL1 silencing, confirming the specificity of the signal observed (Fig. 8A). SP1 was bound to both integrin promoters and to the NOTCH4 promoter, as predicted by the presence of the consensus sites. SP1 binding specificity was tested with the use of mithramycin A (Fig. 8B), a drug that inhibits SP1 binding by competitively binding to GC-rich motifs (44, 45). Inhibition of SP1 binding to the αv and β3 promoters by mithramycin A also reduced the association of FOSL1 to both promoters while it did not affect its binding to the NOTCH4 promoter (Fig. 8C). Moreover, FOSL1 antiserum coimmunoprecipitated SP1, and the reciprocal immunoprecipitation experiment with SP1 antibodies showed FOSL1 association with SP1 (Fig. 8D). Taken together, these experiments demonstrate that on αv and β3 promoters FOSL1 binds via SP1.
Fig 8.

FOSL1 regulates the integrin αv and β3 promoters indirectly through SP1. (A) Chromatin immunoprecipitation of FOSL1 on αv and β3 and NOTCH4 promoters. FOSL1 silencing (shFOSL1) significantly reduced the signal on all three promoters. Primer positions for the amplification of αv and β3 promoters are reported in Fig. 7A. Amplification of the NOTCH4 promoter region, which is bound by both FOSL1 (directly through an AP-1 binding site) and SP1, was used as a control. (B) Chromatin immunoprecipitation of SP1 on αv and β3 and NOTCH4 promoters. Cell treatment with mithramycin A for 2 h strongly inhibited SP1 binding to all three promoters. (C) Chromatin immunoprecipitation of FOSL1 on αv and β3 and NOTCH4 promoters in cells untreated (Vehicle) or treated with mithramycin A for 2 h. Mithramycin A inhibited the binding of FOSL1 on the on αv and β3 promoters but not the NOTCH4 promoter where FOSL1 binds directly to an AP-1 site. (D) Nuclear extracts obtained from HUVEC were either immunostained (Input) or subjected to immunoprecipitation (IP) with anti-FOSL1 or anti-SP1 antibodies as indicated. (E) Chromatin immunoprecipitation of JunD on αv and β3 promoters. FOSL1 silencing significantly reduced the JunD association on both promoters. (F and G) Chromatin immunoprecipitation analysis of histone modifications on αv and β3 promoters in control cells and in FOSL1-silenced cells. FOSL1 silencing induces a significant increase of H4ac at K16. Mean values from three independent experiments are shown with standard deviations.
Because FOSL1 heterodimerizes with the Jun members of the AP-1 family, we further tested whether the silencing of FOSL1 affects the binding of FOSL1 partners. ChIP analysis revealed that JunD binds to both αv and β3 promoters, and its binding was significantly affected by FOSL1 knockdown (Fig. 8E).
Finally, we measured some histone modifications at αv and β3 promoters in wild-type and FOSL1 knockdown cells. The analysis of H3 and H4 acetylation at the promoter regions of both genes showed a significant increment of H4 acetylation at both αv and β3 promoters following FOSL1 silencing (Fig. 8F and G). The use of antibodies specific for each of the four different H4 acetylated forms revealed a significant variation of H4K16ac at both promoters, suggesting that FOSL1 recruitment to αv and β3 promoters affects the acetylation levels of H4K16.
DISCUSSION
Fosl1 knockout mice die at E10.5 as a result of placental defects due to incorrect assembly of endothelial cells (11). In this report we provide evidence that Fosl1 controls the correct assembly of endothelial cells during the processes of vasculogenesis and angiogenesis as in these cells it regulates the expression of key cellular effectors of adhesion and migration. We observed that Fosl1 knockout stem cells could differentiate into endothelial and smooth muscle cells. However, unlike wild-type cells, they cannot form cord-like tubes surrounded by alpha-smooth muscle actin (α-SMA)-positive cells. Thus, in the absence of Fosl1, endothelial cells cannot fully assemble into vessel-like structures. We also observed defects in in vitro angiogenic assays with HUVEC silenced for FOSL1. Since HUVEC derived from cord blood are an almost pure population of primary endothelial cells, their phenotypic analysis further confirms that the assembly defects observed in FOSL1-silenced cells are due to impairment of endothelial cell regulation and not to cross-signaling of endothelial cells with pericytes or other cells that could be present in the microenvironment of the developing vasculature.
By gene expression profiling, we identified several genes controlled by FOSL1 in endothelial cells. We focused our attention on integrins whose unbalanced expression could explain most of the alterations observed. Indeed, the overexpression of αvβ3 on the cell surface was sufficient to alter cell morphology, increase cell adhesion, and affect migration of endothelial cells in wound-healing assays. The increase in endothelial cell adhesion could be correlated with an increased interaction of cells overexpressing αvβ3 integrins with the integrin-binding site exposed by the substrate as the inhibition of αvβ3 binding to the ECM rescued the endothelial cell phenotype. The major expression of integrins on the surfaces FOSL1-silenced cells and their increased adhesion to the substrate could also explain their altered morphology. In fact, the clustering of integrins on the extracellular surface induces the relocalization and concentration of nonreceptor cytoplasmic proteins on focal adhesion sites controlling cytoskeletal organization and downstream signaling (46). Accordingly, we observed that FOSL1 silencing, besides inducing increased expression of αvβ3 on the cell surface, induced a dramatic alteration in the organization and distribution of the focal adhesion sites, with alteration of the cell morphology. These experiments suggest that the increased expression of αvβ3 might stabilize focal adhesion and/or slow down FAK turnover, resulting in the inhibition of endothelial cell migration, which is a coordinated process involving formation and disassembly of cell adhesion sites. If the expression of αvβ3 on endothelial cells is required for correct angiogenesis and the response to angiogenic stimuli (1, 4, 9), our results demonstrate also that their uncontrolled expression impairs endothelial cell functions.
Although our data demonstrate that the overexpression of αvβ3 impairs angiogenic activity, we cannot exclude the possibility that other FOSL1 targets contribute to the altered phenotype. Indeed, the gene expression profile also highlighted that FOSL1 silencing down-modulates uPAR and uPA. As both uPA and uPAR are involved in the degradation of the ECM, our results support a model by which, in primary endothelial cells, FOSL1, by down-modulating the expression of αvβ3 and upregulating the expression of uPA/uPAR, permits the fine-tuning of the expression of these complexes on the cell surface, controlling in this way the equilibrium between the adhesive versus the migrating state necessary to orchestrate the angiogenic process.
Analysis of the transcriptional regulation driven by αv and β3 promoters together with the ChIP analysis demonstrated that the regulation of αv and β3 is direct and that FOSL1 exerts its negative regulation on both promoters. Unlike proteins such as YY1 that can directly repress transcription binding to the DNA (47), FOSL1 represses the transcription of αv and β3 promoters through SP1. In fact, ChIP analysis show that the inhibition of SP1 association on both αv and β3 promoters resulted in the inhibition of FOSL1 binding, and coimmunoprecipitation experiments showed that FOSL1 forms a nuclear complex with SP1. Thus, FOSL1 acts as a negative modulator of the αv and β3 promoters via SP1, similarly to the regulation of SPARC in chicken embryo fibroblasts, which is downregulated by v-Jun via SP1 (41) and p21, which in turn is inhibited by the interaction of Myc with SP1 (42). In this respect it is worth noting that FOSL1 binds via SP1 on αv and β3 promoters together with JunD, a FOSL1 partner (30) that does not have an activation domain.
Analysis of histone modifications revealed that FOSL1 binding to both αv and β3 promoters produces a reduction in the acetylation of the histone H4 at K16, which is a chromatin marker associated with transcriptional activation. It has been previously shown that FOSL1 overexpression is associated with increased motility, invasiveness, inflammation, and angiogenesis (12, 48). Here, we demonstrate that a physiological function of FOSL1 in endothelial cells is to regulate the expression of key molecules on the cell surface to modulate cell adhesion and motility.
Supplementary Material
ACKNOWLEDGMENTS
This work was supported by Associazione Italiana Ricerca sul Cancro, Regione Toscana Programma Salute, and Istituto Toscano Tumori.
We are in indebted to Guido Tarone and Paola Defilippi for critical reading of the manuscript, members of the laboratory for encouragement and helpful suggestions, and Caterina Parlato for technical support.
Footnotes
Published ahead of print 14 January 2013
Supplemental material for this article may be found at http://dx.doi.org/10.1128/MCB.01054-12.
REFERENCES
- 1. Malinin NL, Pluskota E, Byzova TV. 2012. Integrin signaling in vascular function. Curr. Opin. Hematol. 19: 206– 211 [DOI] [PMC free article] [PubMed] [Google Scholar]
- 2. Bader BL, Rayburn H, Crowley D, Hynes RO. 1998. Extensive vasculogenesis, angiogenesis, and organogenesis precede lethality in mice lacking all alpha v integrins. Cell 95: 507– 519 [DOI] [PubMed] [Google Scholar]
- 3. Drake CJ, Cheresh DA, Little CD. 1995. An antagonist of integrin alpha v beta 3 prevents maturation of blood vessels during embryonic neovascularization. J. Cell Sci. 108: 2655– 2661 [DOI] [PubMed] [Google Scholar]
- 4. Stupack DG, Cheresh DA. 2004. Integrins and angiogenesis. Curr. Top. Dev. Biol. 64: 207– 238 [DOI] [PubMed] [Google Scholar]
- 5. Soldi R, Mitola S, Strasly M, Defilippi P, Tarone G, Bussolino F. 1999. Role of αvβ3 integrin in the activation of vascular endothelial growth factor receptor-2. EMBO J. 18: 882– 892 [DOI] [PMC free article] [PubMed] [Google Scholar]
- 6. Borges E, Jan Y, Ruoslahti E. 2000. Platelet-derived growth factor receptor beta and vascular endothelial growth factor receptor 2 bind to the beta 3 integrin through its extracellular domain. J. Biol. Chem. 275: 39867– 39873 [DOI] [PubMed] [Google Scholar]
- 7. Mahabeleshwar GH, Feng W, Phillips DR, Byzova TV. 2006. Integrin signaling is critical for pathological angiogenesis. J. Exp. Med. 203: 2495– 2507 [DOI] [PMC free article] [PubMed] [Google Scholar]
- 8. Mahabeleshwar GH, Feng W, Reddy K, Plow EF, Byzova TV. 2007. Mechanisms of integrin-vascular endothelial growth factor receptor cross-activation in angiogenesis. Circ. Res. 101: 570– 580 [DOI] [PMC free article] [PubMed] [Google Scholar]
- 9. Serini G, Napione L, Bussolino F. 2008. Integrins team up with tyrosine kinase receptors and plexins to control angiogenesis. Curr. Opin. Hematol. 15: 235– 242 [DOI] [PubMed] [Google Scholar]
- 10. Galvagni F, Pennacchini S, Salameh A, Rocchigiani M, Neri F, Orlandini M, Petraglia F, Gotta S, Sardone GL, Matteucci G, Terstappen GC, Oliviero S. 2010. Endothelial cell adhesion to the extracellular matrix induces c-Src-dependent VEGFR-3 phosphorylation without the activation of the receptor intrinsic kinase activity. Circ. Res. 106: 1839– 1848 [DOI] [PubMed] [Google Scholar]
- 11. Schreiber M, Wang ZQ, Jochum W, Fetka I, Elliott C, Wagner EF. 2000. Placental vascularisation requires the AP-1 component Fra1. Development 127: 4937– 4948 [DOI] [PubMed] [Google Scholar]
- 12. Verde P, Casalino L, Talotta F, Yaniv M, Weitzman JB. 2007. Deciphering AP-1 function in tumorigenesis: Fra-ternizing on target promoters. Cell Cycle 6: 2633– 2639 [DOI] [PubMed] [Google Scholar]
- 13. Bergers G, Graninger P, Braselmann S, Wrighton C, Busslinger M. 1995. Transcriptional activation of the Fra-1 gene by AP-1 is mediated by regulatory sequences in the first intron. Mol. Cell. Biol. 15: 3748– 3758 [DOI] [PMC free article] [PubMed] [Google Scholar]
- 14. Zippo A, De Robertis A, Serafini R, Oliviero S. 2007. PIM1-dependent phosphorylation of histone H3 at serine 10 is required for MYC-dependent transcriptional activation and oncogenic transformation. Nat. Cell Biol. 9: 932– 944 [DOI] [PubMed] [Google Scholar]
- 15. Zippo A, Serafini R, Rocchigiani M, Pennacchini S, Krepelova A, Oliviero S. 2009. Histone crosstalk between H3S10ph and H4K16ac generates a histone code that mediates transcription elongation. Cell 138: 1122– 1136 [DOI] [PubMed] [Google Scholar]
- 16. Suzuki T, Okuno H, Yoshida T, Endo T, Nishina H, Iba H. 1991. Difference in transcriptional regulatory function between c-Fos and Fra-2. Nucleic Acids Res. 19: 5537– 5542 [DOI] [PMC free article] [PubMed] [Google Scholar]
- 17. Groskopf JC, Linzer DI. 1994. Characterization of a delayed early serum response region. Mol. Cell. Biol. 14: 6013– 6020 [DOI] [PMC free article] [PubMed] [Google Scholar]
- 18. Welter JF, Crish JF, Agarwal C, Eckert RL. 1995. Fos-related antigen (Fra-1), junB, and junD activate human involucrin promoter transcription by binding to proximal and distal AP1 sites to mediate phorbol ester effects on promoter activity. J. Biol. Chem. 270: 12614– 12622 [DOI] [PubMed] [Google Scholar]
- 19. Talotta F, Mega T, Bossis G, Casalino L, Basbous J, Jariel-Encontre I, Piechaczyk M, Verde P. 2010. Heterodimerization with Fra-1 cooperates with the ERK pathway to stabilize c-Jun in response to the RAS oncoprotein. Oncogene 29: 4732– 4740 [DOI] [PubMed] [Google Scholar]
- 20. Yoshioka K, Deng T, Cavigelli M, Karin M. 1995. Antitumor promotion by phenolic antioxidants: inhibition of AP-1 activity through induction of Fra expression. Proc. Natl. Acad. Sci. U. S. A. 92: 4972– 4976 [DOI] [PMC free article] [PubMed] [Google Scholar]
- 21. Kustikova O, Kramerov D, Grigorian M, Berezin V, Bock E, Lukanidin E, Tulchinsky E. 1998. Fra-1 induces morphological transformation and increases in vitro invasiveness and motility of epithelioid adenocarcinoma cells. Mol. Cell. Biol. 18: 7095– 7105 [DOI] [PMC free article] [PubMed] [Google Scholar]
- 22. Tkach V, Tulchinsky E, Lukanidin E, Vinson C, Bock E, Berezin V. 2003. Role of the Fos family members, c-Fos, Fra-1 and Fra-2, in the regulation of cell motility. Oncogene 22: 5045– 5054 [DOI] [PubMed] [Google Scholar]
- 23. Casalino L, Bakiri L, Talotta F, Weitzman JB, Fusco A, Yaniv M, Verde P. 2007. Fra-1 promotes growth and survival in RAS-transformed thyroid cells by controlling cyclin A transcription. EMBO J. 26: 1878– 1890 [DOI] [PMC free article] [PubMed] [Google Scholar]
- 24. Salameh A, Galvagni F, Anselmi F, De Clemente C, Orlandini M, Oliviero S. 2010. Growth factor stimulation induces cell survival by c-Jun. ATF2-dependent activation of Bcl-XL. J. Biol. Chem. 285: 23096– 23104 [DOI] [PMC free article] [PubMed] [Google Scholar]
- 25. Takagi J, Petre BM, Walz T, Springer TA. 2002. Global conformational rearrangements in integrin extracellular domains in outside-in and inside-out signaling. Cell 110: 599– 611 [DOI] [PubMed] [Google Scholar]
- 26. Galvagni F, Lestingi M, Cartocci E, Oliviero S. 1997. Serum response factor and protein-mediated DNA bending contribute to transcription of the dystrophin muscle-specific promoter. Mol. Cell. Biol. 17: 1731– 1743 [DOI] [PMC free article] [PubMed] [Google Scholar]
- 27. Salameh A, Galvagni F, Bardelli M, Bussolino F, Oliviero S. 2005. Direct recruitment of CRK and GRB2 to VEGFR-3 induces proliferation, migration, and survival of endothelial cells through the activation of ERK, AKT, and JNK pathways. Blood 106: 3423– 3431 [DOI] [PubMed] [Google Scholar]
- 28. Ory DS, Neugeboren BA, Mulligan RC. 1996. A stable human-derived packaging cell line for production of high titer retrovirus/vesicular stomatitis virus G pseudotypes. Proc. Natl. Acad. Sci. U. S. A. 93: 11400– 11406 [DOI] [PMC free article] [PubMed] [Google Scholar]
- 29. Orlandini M, Nucciotti S, Galvagni F, Bardelli M, Rocchigiani M, Petraglia F, Oliviero S. 2008. Morphogenesis of human endothelial cells is inhibited by DAB2 via Src. FEBS Lett. 582: 2542– 2548 [DOI] [PubMed] [Google Scholar]
- 30. Galvagni F, Cantini M, Oliviero S. 2002. The utrophin gene is transcriptionally up-regulated in regenerating muscle. J. Biol. Chem. 277: 19106– 19113 [DOI] [PubMed] [Google Scholar]
- 31. Thomas PD, Kejariwal A, Campbell MJ, Mi H, Diemer K, Guo N, Ladunga I, Ulitsky-Lazareva B, Muruganujan A, Rabkin S, Vandergriff JA, Doremieux O. 2003. PANTHER: a browsable database of gene products organized by biological function, using curated protein family and subfamily classification. Nucleic Acids Res. 31: 334– 341 [DOI] [PMC free article] [PubMed] [Google Scholar]
- 32. Kouskouti A, Talianidis I. 2005. Histone modifications defining active genes persist after transcriptional and mitotic inactivation. EMBO J. 24: 347– 357 [DOI] [PMC free article] [PubMed] [Google Scholar]
- 33. Zippo A, De Robertis A, Bardelli M, Galvagni F, Oliviero S. 2004. Identification of Flk-1 target genes in vasculogenesis: Pim-1 is required for endothelial and mural cell differentiation in vitro. Blood 103: 4536– 4544 [DOI] [PubMed] [Google Scholar]
- 34. Guerrini L, Casalino L, Corti A, Blasi F. 1996. NF-kappa B-mediated regulation of urokinase gene expression by PMA and TNF-alpha in human A549 cells. FEBS Lett. 393: 69– 73 [DOI] [PubMed] [Google Scholar]
- 35. Lakka SS, Bhattacharya A, Mohanam S, Boyd D, Rao JS. 2001. Regulation of the uPA gene in various grades of human glioma cells. Int. J. Oncol. 18: 71– 79 [PubMed] [Google Scholar]
- 36. Bhattacharya A, Lakka SS, Mohanam S, Boyd D, Rao JS. 2001. Regulation of the urokinase-type plasminogen activator receptor gene in different grades of human glioma cell lines. Clin. Cancer Res. 7: 267– 276 [PubMed] [Google Scholar]
- 37. Jamaluddin MS. 2006. Aspirin upregulates expression of urokinase type plasminogen activator receptor (uPAR) gene in human colon cancer cells through AP1. Biochem. Biophys. Res. Commun. 348: 618– 627 [DOI] [PubMed] [Google Scholar]
- 38. Kent LN, Rumi MA, Kubota K, Lee DS, Soares MJ. 2011. FOSL1 is integral to establishing the maternal-fetal interface. Mol. Cell. Biol. 31: 4801– 4813 [DOI] [PMC free article] [PubMed] [Google Scholar]
- 39. Dechantsreiter MA, Planker E, Matha B, Lohof E, Holzemann G, Jonczyk A, Goodman SL, Kessler H. 1999. N-Methylated cyclic RGD peptides as highly active and selective αVβ3 integrin antagonists. J. Med. Chem. 42: 3033– 3040 [DOI] [PubMed] [Google Scholar]
- 40. Matys V, Kel-Margoulis OV, Fricke E, Liebich I, Land S, Barre-Dirrie A, Reuter I, Chekmenev D, Krull M, Hornischer K, Voss N, Stegmaier P, Lewicki-Potapov B, Saxel H, Kel AE, Wingender E. 2006. TRANSFAC and its module TRANSCompel: transcriptional gene regulation in eukaryotes. Nucleic Acids Res. 34: D108– 110 [DOI] [PMC free article] [PubMed] [Google Scholar]
- 41. Chamboredon S, Briggs J, Vial E, Hurault J, Galvagni F, Oliviero S, Bos T, Castellazzi M. 2003. v-Jun downregulates the SPARC target gene by binding to the proximal promoter indirectly through Sp1/3. Oncogene 22: 4047– 4061 [DOI] [PubMed] [Google Scholar]
- 42. Gartel AL, Ye X, Goufman E, Shianov P, Hay N, Najmabadi F, Tyner AL. 2001. Myc represses the p21(WAF1/CIP1) promoter and interacts with Sp1/Sp3. Proc. Natl. Acad. Sci. U. S. A. 98: 4510– 4515 [DOI] [PMC free article] [PubMed] [Google Scholar]
- 43. Wu J, Iwata F, Grass JA, Osborne CS, Elnitski L, Fraser P, Ohneda O, Yamamoto M, Bresnick EH. 2005. Molecular determinants of NOTCH4 transcription in vascular endothelium. Mol. Cell. Biol. 25: 1458– 1474 [DOI] [PMC free article] [PubMed] [Google Scholar]
- 44. Snyder RC, Ray R, Blume S, Miller DM. 1991. Mithramycin blocks transcriptional initiation of the c-myc P1 and P2 promoters. Biochemistry 30: 4290– 4297 [DOI] [PubMed] [Google Scholar]
- 45. Remsing LL, Bahadori HR, Carbone GM, McGuffie EM, Catapano CV, Rohr J. 2003. Inhibition of c-src transcription by mithramycin: structure-activity relationships of biosynthetically produced mithramycin analogues using the c-src promoter as target. Biochemistry 42: 8313– 8324 [DOI] [PubMed] [Google Scholar]
- 46. Berrier AL, Yamada KM. 2007. Cell-matrix adhesion. J. Cell. Physiol. 213: 565– 573 [DOI] [PubMed] [Google Scholar]
- 47. Galvagni F, Cartocci E, Oliviero S. 1998. The dystrophin promoter is negatively regulated by YY1 in undifferentiated muscle cells. J. Biol. Chem. 273: 33708– 33713 [DOI] [PubMed] [Google Scholar]
- 48. Luo YP, Zhou H, Krueger J, Kaplan C, Liao D, Markowitz D, Liu C, Chen T, Chuang TH, Xiang R, Reisfeld RA. 2010. The role of proto-oncogene Fra-1 in remodeling the tumor microenvironment in support of breast tumor cell invasion and progression. Oncogene 29: 662– 673 [DOI] [PMC free article] [PubMed] [Google Scholar]
Associated Data
This section collects any data citations, data availability statements, or supplementary materials included in this article.