

Abstract
Coronaviruses (CoVs) are positive-sense, single-stranded, enveloped RNA viruses that infect a variety of vertebrate hosts. The CoV nucleocapsid (N) protein contains two structurally independent RNA binding domains, designated the N-terminal domain (NTD) and the dimeric C-terminal domain (CTD), joined by a charged linker region rich in serine and arginine residues (SR-rich linker). An important goal in unraveling N function is to molecularly characterize N-protein interactions. Recent genetic evidence suggests that N interacts with nsp3a, a component of the viral replicase. Here we present the solution nuclear magnetic resonance (NMR) structure of mouse hepatitis virus (MHV) nsp3a and show, using isothermal titration calorimetry, that MHV N219, an N construct that extends into the SR-rich linker (residues 60 to 219), binds cognate nsp3a with high affinity (equilibrium association constant [Ka], [1.4 ± 0.3] × 106 M−1). In contrast, neither N197, an N construct containing only the folded NTD (residues 60 to 197), nor the CTD dimer (residues 260 to 380) binds nsp3a with detectable affinity. This indicates that the key nsp3a binding determinants localize to the SR-rich linker, a finding consistent with those of reverse genetics studies. NMR chemical shift perturbation analysis reveals that the N-terminal region of an MHV N SR-rich linker peptide (residues 198 to 230) binds to the acidic face of MHV nsp3a containing the acidic α2 helix with an affinity (expressed as Ka) of 8.1 × 10³ M−1. These studies reveal that the SR-rich linker of MHV N is necessary but not sufficient to maintain this high-affinity binding to N.
INTRODUCTION
Coronaviruses (CoVs) are positive-sense, single-stranded, enveloped RNA viruses that infect a variety of human and animal hosts. Severe acute respiratory syndrome (SARS) is caused by a human CoV, SARS-CoV, a Betacoronavirus subgroup 2b zoonotic virus that emerged in 2002 from a reservoir population of animal CoVs in bats in southern China (1). SARS-CoV is characterized by its virulence, its ability to cross the species barrier, and a fatality rate of 10% during the pandemic of 2002 to 2003 (2). Although the SARS pandemic is clearly behind us, the significant reservoirs of SARS-CoV-related zoonotic viruses in the wild (3) and the recent identification of nine human cases of severe viral pneumonia (with one death) attributed to a SARS-like CoV (4) reveal that coronaviruses remain a significant threat to human health.
The prototypical coronavirus murine hepatitis virus (MHV) (Betacoronavirus subgroup 2a) is closely related to SARS-CoV and is an established model system for the study of selected aspects of CoV replication and transcription (5). The replication machinery is translated from the genomic RNA (gRNA) as two large polyproteins, pp1a and pp1ab, formed as a result of a −1 ribosomal frameshifting event that involves a complex pseudoknotted RNA structure (6). These polyproteins are then proteolytically processed into 16 nonstructural proteins (nsp1 to nsp16), which assemble to form the coronavirus replicase-transcriptase complex (RTC). Coronaviral replication is a complex process that is poorly understood but is certain to involve a substantial number of highly dynamic protein-protein and protein-RNA interactions. For example, Masters and coworkers have proposed that the initiation of negative-strand synthesis in coronaviruses requires an interaction between a cis-acting RNA pseudoknot in the 3′ untranslated region (3′ UTR) (7) and a complex of multiple replicase proteins (8). Additional structural work has identified RNA hairpins in the 5′ UTR of MHV as essential for replication (9–11). Stem-loop 1 (SL1) has been shown to possess moderately stable base pairing, the dynamics of which is hypothesized to be essential for mediating a long-range interaction between the 5′ and 3′ UTRs, an essential step in the transcription of subgenomic RNAs (sgRNAs).
The nucleocapsid protein (N) has long been suggested to be an important component for both replication and transcription. Antibodies against N have been shown to strongly inhibit RNA transcription (12), while inclusion of N strongly stimulates virus replication early in infection (13). N has also been shown to colocalize with the RTC in the early stages of infection, poising N to function in a regulatory role during viral replication and transcription (14, 15). Recently, N was found to be dynamically associated with the RTC (16). This transient association presumably allows N molecules to change places with one another in order to carry out a variety of distinct functions that may be separated both spatially and temporally during the viral life cycle.
Although N is known to be essential for efficient viral replication, the specific role that N plays in this process remains unknown. Recent genetic evidence (17) suggests that N interacts with the N-terminal domain of the nsp3 polyprotein (5), termed nsp3a, which is a known component of the viral replicase. By use of a reverse genetics system, the gene encoding MHV N was replaced with the closely related (71% sequence identity) bovine coronavirus (BCoV) N gene in a direct open reading frame (ORF)-for-ORF substitution in an otherwise all-MHV genome. Strikingly, this substitution resulted in a severely defective virus, which allowed the recovery of a number of revertant viruses that restored wild-type-like viability and plaque size (17). These mutants are summarized schematically in Fig. 1 (17). Revertants were identified only in two regions in the entire 31,335-nucleotide genome: the N terminus of nsp3 and the serine/arginine (SR)-rich linker region of N that connects the N-terminal domain (NTD) and the dimeric C-terminal domain (CTD) (see Fig. S1 in the supplemental material). This genetic evidence is consistent with the hypothesis that MHV N and MHV nsp3a interact physically. It was also shown that BCoV N poorly stimulates the initiation of infection by transfected MHV genomic RNA, as was found by our group for point mutants with mutations in key RNA binding residues in the NTD (18, 19). This low level of stimulation of infectivity could be efficiently rescued by transfection of in vitro transcripts of BCoV N protein containing the reverting mutations found in the MHV-BCoV N chimeric viruses (17).
Fig 1.
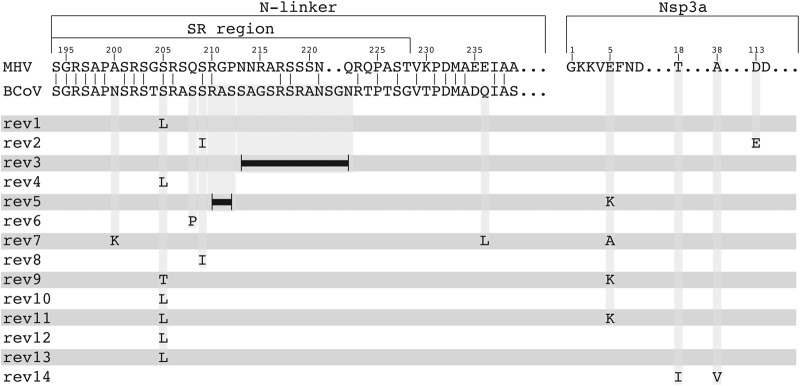
Map of revertant mutations identified when the MHV N gene was replaced by the BCoV N gene in an ORF-for-ORF substitution in an otherwise wild-type MHV A59 genome (17).
Here we employ nuclear magnetic resonance (NMR) spectroscopy and isothermal titration calorimetry (ITC) to evaluate this proposed interaction and to elucidate the determinants of this cognate viral protein-protein interaction. We present the solution structure of MHV nsp3a and show that the NTD of MHV N forms a high-affinity 1:1 complex with MHV nsp3a. The noncognate BCoV N NTD binds MHV nsp3a weakly, in agreement with the results of genetic experiments (17). Additionally, we show that a key determinant of the binding free energy is localized to the SR-rich linker region just C-terminal of the folded NTD and that this region is necessary but not sufficient for high-affinity binding to MHV nsp3a. NMR chemical shift perturbation studies reveal that the N-terminal region of the SR-linker interacts with the central, conserved acidic α2 helix of MHV nsp3a.
(This work was performed by S. C. Keane in partial fulfillment of the requirements for the Ph.D. at Indiana University.)
MATERIALS AND METHODS
Plasmids.
To construct plasmids encoding MHV N1-219 (N residues 1 to 219) and N219 (N residues 60 to 219), the coding sequences were amplified from the full-length MHV N gene using standard PCR methods. The PCR products were digested by NdeI and BamHI and were ligated into a pET3a expression plasmid to create pMHV1-219 and pMHV60-219, respectively. Plasmids encoding the various substitution mutants were prepared using site-directed mutagenesis of pMHV60-219. For plasmids encoding BCoV nucleocapsid protein residues 57 to 216, the coding sequence was amplified from the BCoV pN-SUMO plasmid (obtained from David Brian, University of Tennessee), digested with NdeI and BamHI, and ligated into pET3a to create pBCoV_NTD. The coding sequence for MHV nsp3a residues 1 to 114 was amplified from the pGEX6P-nsp3 plasmid (17) (a gift from Paul Masters, Wadsworth Center, New York State Department of Health), digested with NdeI and BamHI, and ligated into the pET3a expression plasmid to create pNsp3a. The MHV CTD-pGST plasmid (pMHV_CTD) has been described previously (18).
The plasmid used to drive bacterial expression of the recombinant SR-linker peptide (residues 198 to 230) was designed to express an MHV N197 fusion protein containing N197 (N residues 60 to 197) immediately followed by an inserted nonnative cysteine residue and native N residues 198 to 230, with the exception that a single F229-to-Y229 substitution was introduced to eventually quantify peptide concentration. Tobacco etch virus (TEV) protease cleaves immediately N-terminal to the Cys [TEV(cys)] in the expressed protein construct and gives recombinant SR-linker peptide following purification (see Fig. 9C for sequence). Both traditional and overlap extension PCR methodologies were used. First, N residues 60 to 197 were amplified from the pN60-197_MBP plasmid by using a reverse primer that excluded the stop codon and included the TEV protease cleavage sequence containing a C-terminal Cys. This insert was then used as a template for the extension of the linker sequence by overlap extension PCR with a series of overlapping primers. The overall insert was digested with NdeI and BamHI and was ligated into a pET15b plasmid to create pSRlinker. The integrity of all DNA constructs was verified by DNA sequencing performed by the Indiana Molecular Biology Institute.
Fig 9.

(A) 1H,15N HSQC spectrum of the MHV SR-linker peptide, free and in the presence of increasing concentrations of unlabeled MHV nsp3a. Different points in the titration are color coded to represent the molar ratio of nsp3a to the SR-linker peptide as follows: red, 1:0; orange, 1:1; cyan, 1:2; blue, 1:5. (B) Perturbation map of backbone amides of the MHV SR-linker peptide upon the addition of MHV nsp3a. (C) Sequence of the SR-linker peptide used in this study. Underlined residues are nonnative to MHV N. The missense and deletion mutations recovered in the BCoV N coding sequence in multiply passaged wild-type-like BCoVN-MHV chimeric viruses are illustrated schematically (17).
MHV and BCoV N domain purification.
Plasmids pMHV1-219, pMHV60-219, and pBCoV_NTD were transformed into BL21(DE3) cells, expressed, and purified as follows. A single colony from the transformation plate was used to inoculate a 200-ml LB culture containing 100 mg/liter ampicillin and was grown overnight at 25°C with shaking. The starter culture was used to inoculate six 1-liter LB (100 mg/liter ampicillin) cultures such that the 1-liter cultures would have an initial optical density at 600 nm (OD600) of 0.1. Large cultures were grown at 37°C with shaking until the OD600 reached 0.6 to 0.8, at which time expression was induced with the addition of 500 μM isopropyl β-d-1-thiogalactopyranoside (IPTG). Cells were grown at 37°C for an additional 4 h prior to harvesting by centrifugation at low speed. Cell pellets were frozen at −80°C overnight, thawed, resuspended in 200 ml lysis buffer (25 mM KPi, 2 mM EDTA, 500 mM KCl, 0.1 g protease inhibitor cocktail [Sigma] [pH 6.0]), and lysed by sonication. The lysate was clarified by centrifugation, and 0.15% (vol/vol) polyethyleneimine (PEI) was added dropwise to the supernatant with stirring at 4°C to precipitate nucleic acids. After stirring for 2 h, the solution was clarified by centrifugation. The supernatant was then subjected to (NH4)2SO4 precipitation (at 30% and then 70% saturation), and the pellet was resuspended in 30 ml of buffer A (25 mM KPi, 2 mM EDTA [pH 6.0]) and was extensively dialyzed against buffer B (25 mM KPi, 2 mM EDTA, 50 mM KCl [pH 6.0]). The sample was then subjected to purification using an SP-Sepharose cation-exchange column (Pharmacia) equilibrated with buffer B. The dialyzed sample was loaded onto the column and was eluted with a linear gradient of KCl (50 mM to 750 mM) over 20 column volumes. Fractions containing purified N protein were pooled and concentrated to a volume of <5 ml. The sample was then further purified by size exclusion chromatography on a Superdex 75 16/60 column (GE Healthcare) equilibrated with buffer C (50 mM KPi, 100 mM KCl [pH 6.0]).
MHV CTD purification.
Plasmid pMHV_CTD was transformed into BL21(DE3)pLysS cells and was plated onto LB agar containing 100 mg/liter ampicillin and 34 mg/liter chloramphenicol. A single colony from the transformation plate was used to inoculate a 200-ml LB culture containing 100 mg/liter ampicillin and was grown overnight at 25°C with shaking. The starter culture was used to inoculate six 1-liter LB (100 mg/liter ampicillin) cultures such that the 1-liter cultures would have an initial OD600 of 0.1. Large cultures were grown at 37°C with shaking until the OD600 reached 0.6 to 0.8, at which time expression was induced with the addition of 1 mM IPTG. Cells were grown at 37°C for an additional 4 h prior to harvesting by centrifugation at low speed. Cell pellets were frozen at −80°C overnight, thawed, resuspended in 200 ml lysis buffer (25 mM KPi, 2 mM EDTA, 500 mM KCl, 2 mM dithiothreitol [DTT], 0.1 g protease inhibitor cocktail [Sigma] [pH 6.0]), and lysed by sonication. The lysate was clarified by centrifugation, and 0.15% (vol/vol) PEI was added dropwise to the supernatant with stirring at 4°C to precipitate nucleic acids. After stirring for 2 h, the solution was clarified by centrifugation. The supernatant was then subjected to (NH4)2SO4 precipitation (at 30% and then 70% saturation), and the 70% pellet was resuspended in 30 ml of buffer A (25 mM KPi, 2 mM EDTA, 2 mM DTT [pH 6.0]) and was extensively dialyzed against buffer B (25 mM KPi, 2 mM EDTA, 50 mM KCl, 2 mM DTT [pH 6.0]). The sample was then subjected to purification using an SP-Sepharose cation-exchange column (Pharmacia) equilibrated with buffer B. The dialyzed sample was loaded onto the column and was eluted with a linear KCl gradient (50 mM to 750 mM KCl) over 20 column volumes. Fractions containing the CTD–glutathione S-transferase (GST) fusion protein were pooled and were precipitated with the addition of 70% ammonium sulfate. The pellet was resuspended in 20 ml buffer C (25 mM KPi, 2 mM DTT [pH 6.0]), at which point 0.4 ml of TEV protease was added to the sample. The sample was then dialyzed against TEV cleavage buffer (25 mM KPi, 50 mM KCl, 2 mM DTT [pH 6.0]) at 4°C. The progress of TEV cleavage was monitored by sodium dodecyl sulfate-polyacrylamide gel electrophoresis (SDS-PAGE). Once TEV cleavage was judged to be >95% complete, the sample was subjected to purification using an SP-Sepharose cation-exchange column (Pharmacia) equilibrated with buffer B. The dialyzed sample was loaded onto the column and was eluted with a linear KCl gradient (50 mM to 750 mM KCl) over 20 column volumes. Fractions containing the CTD were pooled and concentrated to a volume of <5 ml. The sample was then further purified by size exclusion chromatography on a Superdex 75 16/60 column (GE Healthcare) equilibrated with buffer D (50 mM KPi, 100 mM KCl, 2 mM DTT [pH 6.0]).
Recombinant SR-linker peptide purification.
Plasmid pSRlinker was transformed into Escherichia coli BL21(DE3) competent cells. A single colony from the transformation plate was used to inoculate 200-ml LB cultures containing 100 mg/liter ampicillin and was grown overnight at 25°C with shaking. This starter culture was used to inoculate six 1-liter LB (100 mg/liter ampicillin) cultures such that the 1-liter cultures would have an initial OD600 of 0.1. Large cultures were grown at 37°C with shaking until the OD600 reached 0.6 to 0.8, at which time expression was induced with the addition of 500 μM IPTG. Cells were grown at 37°C for an additional 4 h prior to harvesting by centrifugation at low speed. Cell pellets were frozen at −80°C overnight, thawed, resuspended in 200 ml lysis buffer (25 mM KPi, 2 mM EDTA, 500 mM KCl, 2 mM DTT, 0.1 g protease inhibitor cocktail [Sigma] [pH 6.0]), and lysed by sonication. The lysate was clarified by centrifugation, and 0.15% (vol/vol) PEI was added dropwise to the supernatant with stirring at 4°C to precipitate nucleic acids. After stirring for 2 h, the solution was clarified by centrifugation. The supernatant was then subjected to (NH4)2SO4 precipitation (at 10% and then 80% saturation), and the final 80% pellet was resuspended in 30 ml of buffer A [25 mM Tris, 1 mM tris(2-carboxyethyl)phosphine (TCEP), 10 mM imidazole (pH 8.0)] and was extensively dialyzed against buffer B (25 mM Tris, 1 mM TCEP, 10 mM imidazole, 500 mM NaCl [pH 8.0]). The sample was then subjected to purification by immobilized metal ion affinity chromatography (HisTrap HP; GE Healthcare) with a column equilibrated with buffer B. The dialyzed sample was loaded onto the column and was eluted with a linear imidazole gradient (10 mM to 500 mM imidazole) over 20 column volumes. Fractions containing purified protein were pooled and were precipitated by the addition of ammonium sulfate to 80% saturation. The pellet was then resuspended in 20 ml buffer C (25 mM Tris, 1 mM TCEP, 10 mM imidazole [pH 8.0]) and was dialyzed against buffer D (25 mM Tris, 1 mM TCEP, 10 mM imidazole, 100 mM NaCl [pH 8.0]). The dialyzed sample was then placed in a 50-ml conical tube, and 0.5 ml TEV protease was added to cleave the peptide of interest. The progress of TEV cleavage was monitored by polyacrylamide gel electrophoresis. Once TEV cleavage was judged to be >95% complete, the sample was loaded back onto the HisTrap HP column, and the flowthrough fractions that contained the cleaved peptide were collected. The peptide-containing fractions were then pooled and lyophilized. The dry peptide was resuspended in a minimal volume of water and was dialyzed extensively against buffer E (50 mM KPi, 100 mM KCl, 5 mM TCEP [pH 6.0]) using dialysis tubing with a molecular weight cutoff (MWCO) of 100 to 500 (Spectrapor).
MHV nsp3a purification.
Plasmid pNsp3a was transformed into E. coli BL21(DE3)pLysS competent cells and was plated onto LB agar plates containing 100 mg/liter ampicillin and 34 mg/liter chloramphenicol. A single colony from the transformation plate was used to inoculate a 200-ml LB culture containing 100 mg/liter ampicillin and was grown overnight at 25°C with shaking. The starter culture was used to inoculate six 1-liter LB (100 mg/liter ampicillin) cultures such that the 1-liter cultures would have an initial OD600 of 0.1. Large cultures were grown at 37°C with shaking until the OD600 reached 0.6 to 0.8, at which time expression was induced with the addition of 500 μM IPTG. Cells were grown at 37°C for an additional 4 h prior to harvesting by centrifugation at low speed. Cell pellets were frozen at −80°C overnight, thawed, resuspended in 200 ml lysis buffer (25 mM Tris, 2 mM EDTA, 500 mM NaCl, 5 mM DTT, 0.1 g protease inhibitor cocktail [Sigma] [pH 8.0]), and lysed by sonication. The lysate was clarified by centrifugation, and 0.15% (vol/vol) PEI was added dropwise to the supernatant with stirring at 4°C to precipitate nucleic acids. After stirring for 2 h, the solution was clarified by centrifugation. The supernatant was then subjected to (NH4)2SO4 precipitation (at 50% and then 80% saturation), and the 80% pellet was resuspended in 30 ml of buffer A (25 mM Tris, 2 mM EDTA, 5 mM DTT [pH 8.0]) and was extensively dialyzed against buffer B (25 mM Tris, 2 mM EDTA, 100 mM NaCl, 5 mM DTT [pH 8.0]). The sample was then subjected to purification using a Q-Sepharose anion-exchange column (Pharmacia) equilibrated with buffer B. The dialyzed sample was loaded onto the column and was eluted with a linear NaCl gradient (100 mM to 400 mM NaCl) over 24 column volumes. Fractions containing purified MHV nsp3a were pooled and concentrated to a volume of <5 ml. The sample was then subjected to size exclusion chromatography on a Superdex 75 16/60 column (GE Healthcare) equilibrated with buffer C (50 mM KPi, 100 mM KCl, 5 mM TCEP [pH 6.0]).
Uniformly 15N- and 13C-labeled MHV nsp3a and SR-linker peptide were prepared by growing transformed cultures on a minimal medium containing 1× M9 salts (6 g/liter Na2HPO4, 3 g/liter KH2PO4, 0.5 g/liter NaCl [pH 7.4]), 2 mM MgSO4, 0.1 mM CaCl2, 0.25 mg/liter thiamine hydrochloride, 100 mg/liter ampicillin, 2.5 g/liter [13C]glucose, and 1 g/liter 15NH4Cl. Protein expression was carried out at 25°C with vigorous shaking overnight. Protein purification was carried out as described above for unlabeled proteins. The purity of all final proteins used for structural analyses was estimated to be >95% by inspection of an overloaded Coomassie-stained 18% Tris-glycine SDS-polyacrylamide gel.
Preparation of RNA samples.
Unlabeled transcriptional regulatory sequence (TRS) RNA (10-mer; 5′-gAAUCUAAACU [where the lowercase letter stands for a nonnative nucleotide]) was prepared via in vitro runoff transcription using SP6 polymerase from synthetic double-stranded DNA templates (20). Transcription conditions for individual templates were optimized for the concentrations of nucleotides (2 mM to 8 mM), RNA polymerase (2 ml to 6 ml of prepared stock solution), and magnesium chloride (10 mM to 20 mM) prior to large-scale synthesis. All transcription reaction mixtures contained 5 mM template, 0.05 g/ml of polyethylene glycol (PEG) (molecular weight [MW], 8,000), and 1× transcription buffer (40 mM Tris-HCl [pH 8.0], 5 mM DTT, 1 mM spermidine, 50 mg/ml bovine serum albumin). Reaction mixtures were incubated at 40°C for 8 h, quenched by the addition of 0.5 M EDTA (10%, vol/vol), precipitated with absolute ethanol, and stored at −80°C overnight. Crude RNA was purified using ion-exchange chromatography under denaturing conditions. Immediately upon recovery from the column, RNAs were subjected to additional rounds of ethanol precipitation followed by resuspension in an appropriate buffer.
Isothermal titration calorimetry.
Isothermal titration calorimetry experiments were carried out using a MicroCal VP-ITC calorimeter. A titrant containing a 10-fold molar excess of MHV nsp3a was titrated into 10 to 20 μM N protein at 25.0°C. A single 2-μl injection followed by 69 4-μl injections was used for each experiment. To obtain corrected binding isotherms, each data point was corrected for the heat of dilution by a point-by-point subtraction of data from a control experiment where the buffer was titrated into N protein under otherwise identical conditions. A buffer-into-buffer titration yielded heats of dilution that were small compared to that for the buffer-into-protein titration and thus were not considered in the analysis. Limits on the solubility of MHV nsp3a in the titrant syringe (≤200 μM), coupled with observable precipitation of solutions exceeding an nsp3a-to-N protein molar ratio of 2:1, precluded full saturation of protein-protein complexes in most titrations. To examine the effect of RNA binding on the nsp3a-N protein interaction, 200 μM MHV nsp3a was titrated into a complex of 20 μM N and 25 μM TRS RNA at 25.0°C. All samples were buffer-matched by extensive dialysis (50 mM KPi, 100 mM KCl, 5 mM TCEP [pH 6.0]). The corrected data were fit to a binding model invoking a single class of n binding sites, i.e., a single-site binding model, as described previously using Origin (21). All experiments were carried out in triplicate, and the average values (± standard deviations [SD]) of the fitted parameters obtained from the three replicates are reported.
NMR spectroscopy.
All NMR experiments were acquired on a Varian DDR 600- or 800-MHz spectrometer, equipped with either a cryogenic or a room temperature probe, at the Indiana University METACyt Biomolecular NMR Laboratory. All spectra were acquired at 25°C on ∼200 μM MHV nsp3a or 1.8 mM SR-linker peptide in a buffer containing 50 mM KPi, 100 mM KCl, and 5 mM TCEP (pH 6.0). Proton resonances were referenced to an internal standard, 4,4-dimethyl-4-silapentane-1-sulfonic acid (DSS). Nitrogen and carbon resonances were referenced indirectly on the basis of the proton reference frequency by the equations C0 = 0.251449530·H0 and N0 = 0.101329118·H0, where H0 represents the referenced proton frequency (22). Data were processed using NMRPipe/nmrDraw and were analyzed using Sparky (23, 24). Steady-state 1H,15N heteronuclear Overhouser effect (hNOE) experiments (25) were acquired by setting the relaxation delay (d1) to 5 s before the 1H saturation (relaxT) of 0 s and 5 s for the control and experimental spectra, respectively. The steady-state nuclear Overhouser effect (NOE) values were analyzed as a ratio of peak intensity for each residue with and without proton saturation (equation 1).
| (1) |
The error of the NOE value, σNOE, was determined using the following relationship (equation 2):
| (2) |
where Isat and Iunsat represent the measured intensities of a resonance with and without proton saturation and σsat and σIunsat represent the signal-to-noise level in each experiment. Resonances with a signal-to-noise ratio of 5 or less were excluded from the analysis.
NMR titration experiments.
A 170 μM 15N-labeled MHV nsp3a sample was titrated with increasing amounts of unlabeled SR-linker peptide in 50 mM KPi, 100 mM KCl, 5 mM TCEP (pH 6.0), and 10% D2O, and 1H,15N heteronuclear single quantum coherence (HSQC) spectra were recorded after each addition to the peptide. The change in the MHV nsp3a chemical shift at all resonances was monitored as a function of increasing concentration of SR-linker peptide, and the data were fit to a single-site binding model using global binding analysis with Dynafit (26). Chemical shift perturbations (Δδppm) were calculated as [(Δppm 1H)2 + (Δppm 15N/7)2]1/2.
MHV nsp3a structure calculations.
Backbone and side chain assignments were obtained as reported previously and have been deposited in the BioMagResBank under accession identification (ID) 18587 (27). Distance constraints were derived from 3-dimensional 13C- and 15N-edited nuclear Overhouser effect spectroscopy (NOESY)-HSQC spectra. Backbone amide residual dipolar couplings (RDC), 1DNH, were obtained from the difference in the scalar coupling (1J) measured in an 8% stretched polyacrylamide gel and in isotropic media using 2-dimensional in-phase/antiphase (IPAP)-HSQC spectroscopy (28). NOE-derived distance constraints were assigned in an iterative process using CYANA (29) supplemented by manual assignment of NOE cross peaks. Structure calculations were performed using established protocols in Xplor-NIH (30). Initial structures were calculated by a distance geometry and simulated annealing protocol with Xplor-NIH (30) and were further refined by the addition of RDC restraints. The impact of individual RDC restraints was validated by randomly removing 20% of the restraints and recalculating the global precision of the structure bundle, which was shown not to be affected by this procedure. Initial estimates for the axial component and rhombicity were obtained by fitting the model with the lowest CYANA target function using REDCAT (31) with the final values given in Table 2. Of the 100 structures generated in the final round of calculations, nearly 50% showed good geometry and nonbonded contacts. The bundle of the 20 lowest-energy structures and the mean average solution structure of MHV nap3a have been deposited in the Protein Data Bank (PDB) under accession codes 2M0A and 2M0I, respectively.
Table 2.
Binding affinities of CoV N proteins for MHV nsp3aa
| N protein | n | ΔG (kcal mol−1)b | ΔH (kcal mol−1)b | −TΔS (kcal mol−1 K−1)c | Ka (106 M−1)d | Fold decrease |
|---|---|---|---|---|---|---|
| MHV N60-219 (N219) | 1.2 ± 0.2 | −8.4 ± 0.3 | −13.0 ± 0.6 | 4.6 ± 0.7 | 1.4 ± 0.3 | — |
| MHV N60-197 (N197) | — | — | — | — | ND | ND |
| MHV N1-219 | 1.3 ± 0.2 | −7.1 ± 0.1 | −7.5 ± 0.5 | 0.4 ± 0.5 | 0.17 ± 0.02 | 8 |
| MHV CTD dimer | — | — | — | — | ND | ND |
| MHV S207D N60-219 | 1.2 ± 0.1 | −7.7 ± 0.2 | −15.6 ± 0.3 | 7.9 ± 0.4 | 0.5 ± 0.1 | 3 |
| MHV S218D N60-219 | 1.2 ± 0.1 | −7.6 ± 0.3 | −15.2 ± 0.2 | 7.6 ± 0.4 | 0.4 ± 0.2 | 3 |
| MHV N60-219 + TRS RNA | — | — | — | — | ND | ND |
| BCoV N57-216 | 1.0e | ≤−5.1 | −5.1 ± 0.7 | ND | ≤0.0053 | ≥250 |
Conditions are as follows: 0.15 M KPi, 5 mM TCEP, pH 6.0, 25.0°C. n, number of binding sites; ND, not determined; —, no heat observed.
The errors reported for ΔG and ΔH represent the SD of the average values of Ka and ΔH obtained from three independent titrations.
−TΔS was obtained from ΔG − ΔH, and the error in −TΔS was calculated from the square root of the sum of the squares of the SD in ΔG and ΔH.
Ka values were averaged from multiple ITC titrations and were fit to a model invoking a single class of n binding sites, i.e., a single-site binding model.
Parameter value fixed in the analysis; only ΔH could be estimated from these experiments.
Resonance assignments of the SR-linker peptide.
Sequential backbone resonance assignments for the SR-rich linker were made using a suite of 3-dimensional BEST pulse sequences with a 0.3-s interscan delay (BEST-HNCO, BEST-HNCACO, BEST-HNCA, BEST-HNCACB, BEST-HNCOCACB [32–35]) and the suite of 2-dimensional HADAMAC (Hadamard-encoded amino acid-type editing) experiments (36). Resonance assignments were confidently made for 90% (27 of the expected 30 resonances) of the backbone amides, with A198, R202, and S203 not observed in the spectra. Partial side chain assignments were obtained using the following suite of experiments; HBHA(CO)NH (37), C(CO)NH total-correlation spectroscopy (TOCSY) (38), H(CCO)NH-TOCSY (38, 39), HCCH correlation spectroscopy (COSY) (40–42), and HCCH-TOCSY (43).
Accession numbers.
MHV nsp3a backbone and side chain assignments have been deposited in the BioMagResBank under accession ID 18587 (27). The backbone resonance assignments of the MHV SR-linker peptide have been deposited in the BioMagResBank under accession ID 18803. The structure bundle and mean average solution structure of MHV nap3a have been deposited in the Protein Data Bank under accession codes 2M0A and 2M0I, respectively.
RESULTS
NMR solution structure of MHV nsp3a.
In order to structurally characterize a physical interaction of MHV N with MHV nsp3a, we solved the solution structure of MHV nsp3a. Although the solution structure of SARS-CoV nsp3a is available (44), the two domains exhibit only modest pairwise identity (29%), and we were concerned about the relevance of the SARS-CoV structure to studies of the cognate interaction of MHV nsp3a and N proteins. The 1H,15N HSQC spectrum of MHV nsp3a (see below) is indicative of a well-folded, monomeric protein domain, which allowed us to obtain nearly complete backbone resonance assignments (Cα, Hα, C′, N, and NH), as well as >90% of the side chain proton assignments, via traditional multidimensional NMR analysis carried out on uniformly 15N- and 13C-labeled MHV nsp3a (27). The solution structure was calculated using 943 NOE restraints, 45 1DNH residual dipolar coupling restraints, and 32 hydrogen bond restraints for the regions of well-defined structure (residues 19 to 114) (Table 1). The experimentally derived residual dipolar coupling restraints are in good agreement with those back-calculated from the average structure (Table 1; see also Fig. S2 in the supplemental material).
Table 1.
NMR structural statistics for MHV nsp3a (20 final lowest-energy structures)
| Parameter | Value |
|---|---|
| Total no. of NOE distance constraints | 943 |
| Intraresidue | 227 |
| Sequential (|i − j| = 1) | 384 |
| Medium range (|i − j| ≤ 5) | 181 |
| Long range (|i − j| > 5) | 151 |
| Hydrogen bonds | 32 |
| Distance violations (>0.35 Å) | 0 |
| No. of dihedral angle constraints | 172 |
| Residual no. of dihedral angle violations of >5° | 0 |
| Total no. of RDCsa | 45 |
| Q factor | 0.23 |
| RMSD (Hz) | 1.02 |
| Correlation (exptl to calculated) | 0.97 |
| Deviations from idealized covalent geometry | |
| Bonds (Å) | 0.003 ± 0.0 |
| Angles (°) | 0.435 ± 0.013 |
| Improper torsions (°) | 0.547 ± 0.091 |
| Ramachandran map analysisb | |
| Most favored (%) | 83.6 |
| Additionally allowed (%) | 14.2 |
| Generously allowed (%) | 1.7 |
| Disallowed (%) | 0.5 |
| Avg RMSDs from the mean coordinates (Å)c | |
| All heavy atoms | 2.72 ± 0.55 |
| Backbone (N, Cα, C′) | 1.99 ± 0.52 |
Backbone 1DNH residual dipolar couplings were analyzed with the REDCAT program. The values of the axial component (Da) and rhombicity (Dr) for MHV nsp3a in 8% stretched polyacrylamide gels were found to be −3.3 Hz and 0.33, respectively.
The ensemble structures between residues 19 and 114 were analyzed by using PROCHECK-NMR.
Coordinate precision was calculated by comparing individual structures of the bundle with the mean coordinates by best-fitting residues in the structured region (residues 19 to 114).
The solution structure of MHV nsp3a is shown in Fig. 2. Inspection of the structure reveals a fold composed of three α-helices and four β-strands arranged in the order β1–α1–β2–α2–α3–β3–β4, onto which is appended an N-terminal unstructured domain (residues 1 to 18). The structure shows some similarity to a domain of the streptococcal pyogenic exotoxin precursor (PDB code 1FNU) and an E3 ubiquitin ligase RING2 domain (PDB code 3GS2) (Dali Z-scores, ≈2.5) but is otherwise unique in the database (45, 46). The highly dynamic nature of the N-terminal region is consistent with an analysis of the 1H-{15N}-hNOE values, which show that this region is characterized by a backbone amide group mobility significantly faster than that of the folded core of the molecule (see Fig. S3 in the supplemental material). The core structure of MHV nsp3a adopts a conformation similar but not identical to the known solution structure of SARS-CoV nsp3a (44), which has a root mean square deviation (RMSD) of ≈3.7 Å (Dali Z-score, 4.8) (excluding the N-terminal domain) between the Cα atoms relative to the average structure of MHV nsp3a (Fig. 3). The largest difference between the MHV and SARS-CoV nsp3a structures lies in the α3 helical region. In MHV, this region forms a single, continuous helix, whereas in SARS-CoV nsp3a, this region forms two short, disjointed helices (α3 and α4 in Fig. S4 in the supplemental material). This difference in secondary structure was apparent even at early stages in the structural analysis from a TALOS+ prediction (see Fig. S4).
Fig 2.

Three ribbon representation views of the solution structure of MHV nsp3a. (A) Ensemble of the 20 lowest-energy structural models (gray), aligned to the average structure (blue). (B) Ensemble of the 20 lowest-energy structural models (gray), shown without the N-terminal unstructured residues (residues 1 to 18) for clarity, superimposed on the average structure (blue) in cartoon format. (C) Average NMR structure of MHV nsp3a.
Fig 3.
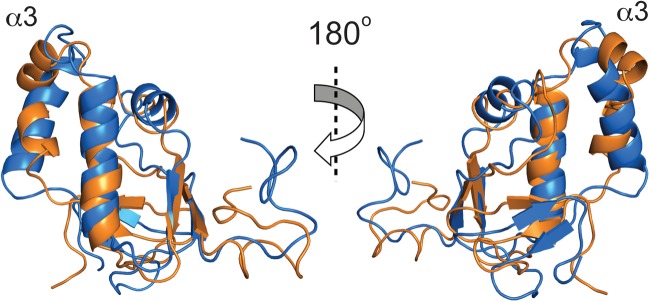
Average solution structure of MHV nsp3a (PDB code 2M0I) (blue) superimposed on that of SARS-CoV nsp3a (PDB code 2GRI) (orange) (44).
The SR-rich region of MHV N protein is essential for high-affinity binding to MHV nsp3a.
With the solution structure in hand, we next used isothermal titration calorimetry (ITC) to determine whether MHV nsp3a and N interact physically and, if so, to measure the affinity and energetics of the interaction directly. A representative binding isotherm is shown in Fig. 4a and is well modeled by a single class of n binding sites, subject to the caveat that solubility limits precluded investigation of nsp3a/N protein molar ratios exceeding ≈2:1 under these conditions (see Materials and Methods). MHV N219 (residues 60 to 219) binds MHV nsp3a with 1:1 stoichiometry (n, 1.2 ± 0.2 in multiple experiments) and with high affinity (equilibrium association constant [Ka], [1.4 ± 0.3] × 106 M−1) (Fig. 4A; Table 2). The binding is strongly enthalpically driven (ΔHcal, −13.0 ± 0.6 kcal mol−1, where ΔHcal is the calorimetric ΔH value) and is opposed by entropy (Table 2). In strong contrast, but in agreement with the genetic results (17), the noncognate BCoV NTD (residues 57 to 216) binds MHV nsp3a weakly, with very low heats of binding and with an affinity too low to measure by direct titration (Ka, ≤5.3 × 10³ M−1) under the same solution conditions (Fig. 4B; Table 2).
Fig 4.

Representative ITC titrations of MHV nsp3a (200 μM) into the MHV (20 μM) (A) or BCoV (20 μM) (B) NTD in 0.15 M K+–5 mM TCEP (pH 6.0). The curve in the lower graph of each panel indicates the best fit defined by a single-site binding model. Note that with the BCoV NTD, the low observed heat of binding and the lack of saturation under these conditions preclude quantitative analysis of the data beyond an estimate of ΔH. See Table 2 for fitted parameters derived from the analysis of three independent experiments (and see Materials and Methods).
Next, we used a domain addition/deletion strategy for MHV N in order to identify major determinants of this interaction. All CoV N proteins contain a highly divergent N-terminal region (residues 1 to 59 in MHV) of unknown function. The affinity of MHV N1-219 for cognate MHV nsp3a (Ka, [1.7 ± 0.2] × 105 M−1) (Fig. 5A; Table 2) is ≈8-fold lower than that of N219, with a significant alteration in the underlying energetics (ΔHcal is approximately half that of N219) (Fig. 6). Next, we used MHV N197 (residues 60 to 197) to determine the extent to which the SR-rich region of N219 was required to maintain a high-affinity interaction. Under these solution conditions, N197 exhibited no measurable net heat of binding to MHV nsp3a (Fig. 5B; Table 2). An identical titration carried out at 30.0°C also showed no observable heat (data not shown). Although a significant limitation of ITC is that a binding process which occurs with no net change in heat (ΔHcal = 0) cannot be taken as evidence of no binding (Ka, ≤104 M−1 under these experimental conditions), this is the simplest interpretation of this experiment, particularly given the large heat of binding observed with N219 (Fig. 4A).
Fig 5.

(A) Representative ITC titrations of nsp3a (200 μM) into MHV N1-219 (20 μM) in 0.15 M K+–5 mM TCEP (pH 6.0). The red curve indicates the best fit defined by a single-site binding model (see Table 2 for fitted parameters). (B) Overlay of representative titrations of MHV nsp3a (200 μM) into MHV N219 (residues 60 to 219) (20 μM) (black), MHV N197 (residues 60 to 197) (20 μM) (blue), the MHV CTD dimer (20 μM dimer) (light blue), and MHV N219 bound to TRS RNA (20 μM protein, 25 μM RNA) (red) in 0.15 M K+–5 mM TCEP (pH 6.0).
Fig 6.
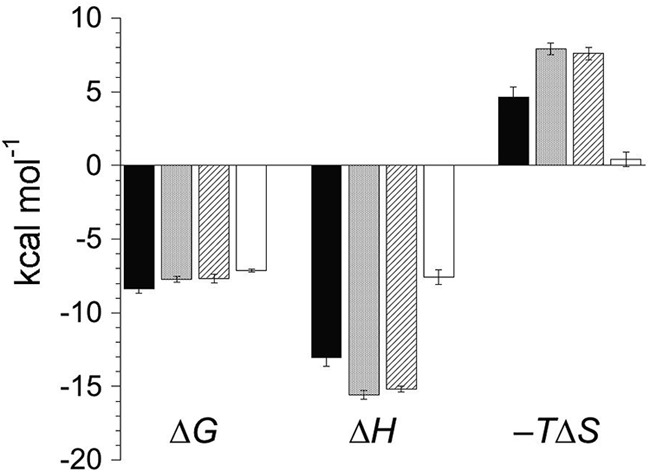
Thermodynamic summary of MHV NTD–MHV nsp3a binding equilibria. Shown is a graphic comparison of the enthalpic (ΔH) and entropic (−TΔS) components of the free energy (ΔG) for the binding of MHV nsp3a to MHV N60-219 (filled bars), MHV S207D N60-219 (stippled bars), MHV S218D N60-219 (diagonally striped bars), and MHV N1-219 (open bars). Data are from Table 2.
We also examined the ability of the CTD dimer to bind MHV nsp3a, and as found for N197 (residues 60 to 197), the CTD dimer also shows no measurable evolved heat under these experimental conditions (Fig. 5B). Taken together, these data provide strong evidence that the SR-rich region of N is essential for mediating a high-affinity interaction with MHV nsp3a, an observation consistent with the localization of the recovered viral revertants exclusively to the SR-rich region of N, with none found within either the folded NTD or the CTD of N (Fig. 1) (17).
Coronavirus N is an RNA-binding protein that makes a high-affinity complex with the transcriptional regulatory sequence (TRS) RNA, the determinants of which we have mapped in detail (18, 19). We therefore performed direct titration of MHV nsp3a into an N219–TRS complex. This titration also evolved no significant net heat (Fig. 5B). This suggests, again subject to the limitations of the ITC experiment, that MHV N219–nsp3a complex formation is inhibited by bound RNA and that the binding of MHV nsp3a and TRS RNA to N219 may be mutually exclusive. The fact that TRS RNA seems to outcompete MHV nsp3a is consistent with their relative affinities (Ka, 108 M−1 for TRS RNA [18, 19] versus 106 M−1 for MHV nsp3a). These results are qualitatively consistent with prior findings (17) showing that the ability to coprecipitate intact N protein bound to an MHV nsp3a–GST fusion protein (using MHV nsp3a containing the immediately adjacent C-terminal acidic region, residues 1 to 273) in an infected-cell lysate was enhanced by pretreatment with RNase A. This suggests that the MHV N–nsp3a interaction in cells is not strictly dependent on RNA, and binding of a high-affinity RNA TRS may well inhibit this protein-protein interaction (17).
The MHV SR-linker peptide forms a complex with MHV nsp3a and binds to the central, acidic α2 helix.
Given the importance of the SR-rich region of N for mediating the interaction with MHV nsp3a, it was of interest to determine whether the SR-rich region was both necessary and sufficient for this interaction. Titration of MHV nsp3a into a solution containing a 33-residue peptide corresponding to the entire SR-rich region in MHV N (residues 198 to 230) showed no observable heat change by ITC (data not shown), consistent with significantly weaker binding (≤104 M−1) or vastly different energetics, e.g., smaller ΔHcal, relative to intact N219. To further investigate this interaction, titration of the same SR-linker peptide into 15N-labeled MHV nsp3a was monitored by 1H,15N NMR spectroscopy (Fig. 7A). The change in the chemical shift for select resonances as a function of increasing peptide concentration was fit to a single-site binding model using a global analysis (Fig. 7B). The affinity of MHV nsp3a for the MHV SR-linker peptide was determined to be (8.1 ± 0.3) × 103 M−1, consistent with the fast chemical exchange observed between the free and bound components (Fig. 7A). Thus, while the SR-rich region of N is necessary for stabilizing the interaction between MHV N and MHV nsp3a (Fig. 5B, blue), it is clearly not sufficient but still accounts for ≈60% of the binding free energy (Table 2). The peptide-induced chemical shift perturbations, while small in magnitude, map nearly exclusively to the long, acidic α2 helix on the “front” of MHV (Fig. 8A, left), with few if any perturbations observed on the “back” side of the molecule (Fig. 8A, right). This acidic region is electrostatically complementary to the basic MHV SR-linker peptide (Fig. 8C). Interestingly, this region is largely the same to which three of the four BCoV revertant mutations map (E5, T18, A38), with D113 in the junction region between the folded nsp3a domain and the immediately adjacent strongly acidic region (Fig. 8D).
Fig 7.

Titration of the unlabeled SR-linker peptide into 15N-labeled nsp3a. (A) 1H,15N HSQC spectrum of MHV nsp3a (acquired at 600 MHz) highlighting selected chemical shift perturbations upon the addition of increasing amounts of the SR-linker peptide. Perturbations of only three residues are shown for clarity. Different points in the titration are color coded to indicate the molar ratio of nsp3a to the SR-linker peptide as follows: blue, 1:0; red, 1:1; cyan, 1:2; yellow, 1:3; purple, 1:4; green, 1:5. (B) Global binding analysis of the titration of the SR-linker peptide into nsp3a. The change in the chemical shift (Δδppm) is plotted as a function of the SR-linker peptide concentration and is calculated as [(Δppm 1H)2 + (Δppm 15N/7)2]1/2. Continuous lines through the data are the results of a global nonlinear least-squares fit to a 1:1 binding model.
Fig 8.

(A) Chemical shift perturbations resulting from the addition of saturating concentrations of the MHV SR-linker peptide to MHV nsp3a. Perturbations (Δδppm) are painted on the average structure of MHV nsp3a in colors ranging from yellow to red. Proline residues are shown as white, while residues with no information are shown as gray. (B) Line broadening that results from the addition of unlabeled MHV N60-219 to 15N-labeled MHV nsp3a (molar ratio, 1:1). This complex is in intermediate chemical exchange, which results in a loss of peak intensity rather than a change in chemical shift perturbations. The log of peak intensity is painted on the model in colors ranging from blue (most broadened) to green (no broadening). Proline residues are shown as white. (C) Electrostatic potential map of MHV nsp3a. The “front” face is largely acidic, and this is the region where the highly basic MHV SR-linker binds. The same views are presented in panels A, B, and C. (D) Ribbon representation of the MHV nsp3a structure, with residues in MHV nsp3a that are altered in wild-type-like viruses recovered from passage of the severely crippled BCoVN-MHV chimeric viruses shown in surface representation (17).
We also performed an experiment in which 15N-labeled MHV–nsp3a was titrated with unlabeled, intact N219, in an effort to investigate the higher-affinity complex by NMR. The resulting 1H,15N HSQC spectrum shows significant line broadening of resonances on both “faces” of MHV nsp3a (Fig. 8B), likely as a result of intermediate chemical exchange of this micromolar complex with free components. The only exception to this finding is that resonances in the N-terminal unstructured region exhibit no line broadening and therefore are not directly involved in the interaction. These data, taken collectively, might suggest that the core NTD (residues 60 to 197) wraps around and interacts with the “back” side (Fig. 8B, right) of nsp3a. Unfortunately, this hypothesis could not be tested directly, due to the poor solubility of both nsp3a and N197 (18) under these conditions.
MHV nsp3a binds to the N-terminal region of the SR-linker peptide.
We next examined the interaction of MHV nsp3a and the MHV SR-linker peptide from the opposite perspective, i.e., by titrating unlabeled MHV nsp3a into a solution of a 15N- and 13C-labeled SR-linker peptide. To this end, the backbone resonances of the MHV SR-linker peptide were assigned to 90% completeness (see Fig. S5 in the supplemental material). The narrow distribution of amide cross peaks in the 1H dimension of the 1H,15N HSQC spectrum of this 33-residue peptide reveals a lack of defined secondary structure in the unbound state. The same is true of the complex formed upon the addition of a molar excess of nsp3a, with small but measurable perturbations obtained as a result (Fig. 9A). The largest of these perturbations localize roughly to the N-terminal portion of the peptide (residues 206 to 211), with measurable perturbations through residue 218 in the linear sequence (Fig. 9C). Interestingly, it is this region in BCoV N to which missense mutations that restore N function map (17).
Single phosphomimetic substitutions in MHV N60-219 do not strongly disrupt binding to nsp3a.
Given the electrostatic complementarity of the two interacting interfaces mapped on nsp3a and N219, serine phosphorylation in this region might be anticipated to disrupt complex formation. CoV N is known to be a phosphoprotein in vivo, and a number of phosphorylation sites in the NTDs and CTDs of MHV, infectious bronchitis virus (IBV), and transmissible gastroenteritis coronavirus (TGEV) have now been mapped using mass spectrometry (47–51). Of particular interest are putative phosphorylation sites within the MHV SR-rich region, which may have been largely missed in previous analyses (47–49); in fact, it is this region of MHV N that is most likely to be phosphorylated on the basis of predictions made by NetPhos 2.0 (see Fig. S6 in the supplemental material) (52). While the role that phosphorylation of N plays in CoVs is not well understood at present, it has been proposed that phosphorylation of N may regulate the switch between viral replication and transcription or viral recognition and genomic RNA packaging (47–49, 53, 54).
In an initial effort to examine the effect of phosphorylation on this interaction, two phosphomimetic substitutions, each containing a single serine-to-aspartic acid substitution (S207D and S218D), were selected and tested. While these specific phosphorylation sites have not been identified in MHV N, both S207 and S218 are predicted by NetPhos 2.0 to be phosphorylated (see Fig. S6 in the supplemental material) (52) and are contained in the primary region of chemical shift perturbation induced by nsp3a binding (Fig. 9). ITC-derived binding experiments reveal that both the S207D and S218D forms of N219 bind to MHV nsp3a with high affinity, although the binding is detectably weaker (≈3-fold) than that of wild-type N219 (Table 2; see also Fig. S7 in the supplemental material).
DISCUSSION
CoV N has long been implicated as playing an important role in both viral replication and transcription, although the molecular details, beyond a role in TRS RNA and genomic RNA binding, are not well defined (12, 13, 55–57). Masters and coworkers recently identified a genetic interaction between MHV N and a subunit of the viral replicase, nsp3 (17). This is the first demonstration of a suspected interaction of an RTC protein with MHV N, which results in stimulation of viral replication in cultured cells at early time points in infection and may derive from the ability of N to deliver the gRNA template to the RTC (17). In this work, we show that MHV N and nsp3a (the N-terminal domain of MHV nsp3) do indeed interact physically, and we have mapped the binding determinants and interfacial regions on each protein partner.
The MHV N–nsp3a interaction, while likely characterized by electrostatic complementarity, is not simply the result of favorable electrostatic interactions. Two lines of evidence support this. First, the folded domain of MHV N (N197; residues 60 to 197) (17), which itself is very basic, shows no measurable heat of binding to MHV nsp3a as measured by ITC. Additionally, the dimeric CTD of MHV is also quite basic but, like N197, shows no apparent measurable affinity for MHV nsp3a. These findings support the notion that there are specific features of the SR-rich linker region in MHV N that mediate the physical association between MHV N and MHV nsp3a. These results are also consistent with the chemical shift perturbation analyses, which reveal that the SR-rich region of N immediately proximate to the folded core NTD (18) is a primary site of interaction on the acidic face of folded MHV nsp3a (Fig. 8). Interestingly, it is this SR-rich region of MHV N that is most strongly divergent from that of BCoV N, in agreement with the observation that substitution of BCoV N for MHV N in vivo results in a severely crippled virus, as well as our finding that the BCoV NTD does not interact with the noncognate MHV nsp3a (17).
The strong electrostatic complementarity in this complex further suggests that reversible phosphorylation of one or more serine residues in the SR-rich region primarily defined by residues 201 to 220 (Fig. 9) might modulate the affinity of the MHV N–nsp3a interaction. However, our data suggest that multiple phosphorylation events within this region of MHV N may be necessary to regulate MHV nsp3a binding; alternatively, single residues other than S207 and S218, tested her,e may be stronger modulators of the affinity. In this regard, it is interesting that all wild-type-like recovered viral revertants from extensive passage of the BCoVN-MHV chimeric viruses (see Fig. 1) introduce at least one additional positively charged and/or bulky hydrophobic residue into either side of the MHV N–nsp3a interface, each of which might be expected to stabilize this protein-protein interaction. Other revertants simply result in the deletion of the entire downstream region in BCoV, which is rich in Ser residues not found in MHV N. Further inspection (Fig. 1) reveals that 9 out of 14 sequenced missense revertants introduce a bulky hydrophobic residue in place of Ser residues corresponding to S205 and S209 in the MHV sequence; this suggests that these sites, which are predicted phosphorylation sites (see Fig. S6 in the supplemental material), could be targeted individually or in combination for substitution and elucidation of any functional role. In any case, it seems likely that the SR-rich region of N is highly phosphorylated, as found in other viral systems, but this remains to be unambiguously established in MHV (58–60). It is noteworthy that this region of N also plays a significant electrostatic role in N–TRS RNA interactions (18); this suggests that TRS RNA binding and nsp3a binding might be mutually exclusive on N219 (Fig. 5). Such a mechanism would likely not prevent an interaction of genomic RNA with the CTD simultaneously with an NTD–nsp3a interaction (17), but this remains to be tested.
Finally, our findings point to a potential negative regulatory role of the highly divergent N-terminal domain in controlling the stability of the MHV N–nsp3a interaction (Fig. 5 and 6). Although the function of this domain is not known for any CoV N, an early RNA recombination experiment suggested that the N-terminal domains of BCoV and MHV were not functionally interchangeable (61). One might therefore speculate that a direct interaction of this domain with another MHV protein or membrane lipid associated with the RTC would relieve the intermolecular inhibition of MHV N–nsp3a complex formation. Although it is not possible to pinpoint a structural explanation for the large change in the underlying energetics in the absence of additional information on linkage to potential protonation-deprotonation equilibria or other solvent effects, a decreased ΔH and an entropy of binding close to zero (ΔH ≈ ΔG) (Fig. 6; Table 2) might suggest that this domain interacts weakly and transiently with another region within MHV N219, perhaps the SR-rich region itself. In the absence of a binding partner, MHV nsp3a would have to disrupt these interactions, thereby contributing unfavorably to complex formation. Previous studies reveal that this domain is conformationally unstructured in the free N protein and plays no role in N NTD-RNA interactions (19).
The original genetic mapping of the physical interaction between MHV N and MHV nsp3a provided evidence to suggest that the SR-rich linker domain of N is involved directly in stimulation of the initiation of the infectivity of gRNA early in the infection process, via assembly of a genomic RNA–N complex that must be brought to the replicase to initiate both RNA replication and sgRNA transcription from the 3′ end of the genome (17). It is not known how reversible phosphorylation might regulate this activity. Studies to test these ideas are in progress, as are efforts to positively identify sites of phosphorylation in the MHV N SR-rich region in virion particles versus infected cells (48). Our previous studies of the core domain of N (NTD, residues 60 to 197) suggest a critical role in subgenomic RNA transcription attributed to the TRS RNA binding and helix destabilization activities of N, defects in which also become strongly manifest in an gRNA infectivity assay (18, 19). Each of these functions of N is enhanced by the presence of the immediately adjacent SR-rich region (18, 19). It is therefore of interest to dissect how these activities of N are coordinated with one another in the context of replicase-transcription complexes.
Supplementary Material
ACKNOWLEDGMENTS
This work was supported by a grant from the NIH to D.P.G. and J. L. Leibowitz, Texas A&M University (AI067416).
We thank J. L. Leibowitz for comments on the manuscript.
Footnotes
Published ahead of print 9 January 2013
Supplemental material for this article may be found at http://dx.doi.org/10.1128/JVI.03112-12.
REFERENCES
- 1. Du L, He Y, Zhou Y, Liu S, Zheng B-J, Jiang S. 2009. The spike protein of SARS-CoV—a target for vaccine and therapeutic development. Nat. Rev. Microbiol. 7:226–236 [DOI] [PMC free article] [PubMed] [Google Scholar]
- 2. Stadler K, Masignani V, Eickmann M, Becker S, Abrignani S, Klenk HD, Rappuoli R. 2003. SARS—beginning to understand a new virus. Nat. Rev. Microbiol. 1:209–218 [DOI] [PMC free article] [PubMed] [Google Scholar]
- 3. Quan PL, Firth C, Street C, Henriquez JA, Petrosov A, Tashmukhamedova A, Hutchison SK, Egholm M, Osinubi MO, Niezgoda M, Ogunkoya AB, Briese T, Rupprecht CE, Lipkin WI. 2010. Identification of a severe acute respiratory syndrome coronavirus-like virus in a leaf-nosed bat in Nigeria. mBio 1(4):e00208–10 doi:10.1128/mBio.00208-10 [DOI] [PMC free article] [PubMed] [Google Scholar]
- 4. Corman V, Eckerle I, Bleicker T, Zaki A, Landt O, Eschbach-Bludau M, van Boheemen S, Gopal R, Ballhause M, Bestebroer T, Muth D, Muller M, Drexler J, Zambon M, Osterhaus A, Fouchier R, Drosten C. 2012. Detection of a novel human coronavirus by real-time reverse-transcription polymerase chain reaction. Euro Surveill. 17(39):20285 http://www.eurosurveillance.org/ViewArticle.aspx?ArticleId=20285 [DOI] [PubMed] [Google Scholar]
- 5. Snijder EJ, Bredenbeek PJ, Dobbe JC, Thiel V, Ziebuhr J, Poon LL, Guan Y, Rozanov M, Spaan WJ, Gorbalenya AE. 2003. Unique and conserved features of genome and proteome of SARS-coronavirus, an early split-off from the coronavirus group 2 lineage. J. Mol. Biol. 331:991–1004 [DOI] [PMC free article] [PubMed] [Google Scholar]
- 6. Brierley I, Boursnell ME, Binns MM, Bilimoria B, Blok VC, Brown TD, Inglis SC. 1987. An efficient ribosomal frame-shifting signal in the polymerase-encoding region of the coronavirus IBV. EMBO J. 6:3779–3785 [DOI] [PMC free article] [PubMed] [Google Scholar]
- 7. Stammler SN, Cao S, Chen SJ, Giedroc DP. 2011. A conserved RNA pseudoknot in a putative molecular switch domain of the 3′-untranslated region of coronaviruses is only marginally stable. RNA 17:1747–1759 [DOI] [PMC free article] [PubMed] [Google Scholar]
- 8. Zust R, Miller TB, Goebel SJ, Thiel V, Masters PS. 2008. Genetic interactions between an essential 3′ cis-acting RNA pseudoknot, replicase gene products, and the extreme 3′ end of the mouse coronavirus genome. J. Virol. 82:1214–1228 [DOI] [PMC free article] [PubMed] [Google Scholar]
- 9. Liu P, Li L, Millership JJ, Kang H, Leibowitz JL, Giedroc DP. 2007. A U-turn motif-containing stem-loop in the coronavirus 5′ untranslated region plays a functional role in replication. RNA 13:763–780 [DOI] [PMC free article] [PubMed] [Google Scholar]
- 10. Li L, Kang H, Liu P, Makkinje N, Williamson ST, Leibowitz JL, Giedroc DP. 2008. Structural lability in stem-loop 1 drives a 5′ UTR-3′ UTR interaction in coronavirus replication. J. Mol. Biol. 377:790–803 [DOI] [PMC free article] [PubMed] [Google Scholar]
- 11. Lee CW, Li L, Giedroc DP. 2011. The solution structure of coronaviral stem-loop 2 (SL2) reveals a canonical CUYG tetraloop fold. FEBS Lett. 585:1049–1053 [DOI] [PMC free article] [PubMed] [Google Scholar]
- 12. Compton SR, Rogers DB, Holmes KV, Fertsch D, Remenick J, McGowan JJ. 1987. In vitro replication of mouse hepatitis virus strain A59. J. Virol. 61:1814–1820 [DOI] [PMC free article] [PubMed] [Google Scholar]
- 13. Schelle B, Karl N, Ludewig B, Siddell SG, Thiel V. 2005. Selective replication of coronavirus genomes that express nucleocapsid protein. J. Virol. 79:6620–6630 [DOI] [PMC free article] [PubMed] [Google Scholar]
- 14. Denison MR, Spaan WJ, van der Meer Y, Gibson CA, Sims AC, Prentice E, Lu XT. 1999. The putative helicase of the coronavirus mouse hepatitis virus is processed from the replicase gene polyprotein and localizes in complexes that are active in viral RNA synthesis. J. Virol. 73:6862–6871 [DOI] [PMC free article] [PubMed] [Google Scholar]
- 15. van der Meer Y, Snijder EJ, Dobbe JC, Schleich S, Denison MR, Spaan WJ, Locker JK. 1999. Localization of mouse hepatitis virus nonstructural proteins and RNA synthesis indicates a role for late endosomes in viral replication. J. Virol. 73:7641–7657 [DOI] [PMC free article] [PubMed] [Google Scholar]
- 16. Verheije MH, Hagemeijer MC, Ulasli M, Reggiori F, Rottier PJ, Masters PS, de Haan CA. 2010. The coronavirus nucleocapsid protein is dynamically associated with the replication-transcription complexes. J. Virol. 84:11575–11579 [DOI] [PMC free article] [PubMed] [Google Scholar]
- 17. Hurst KR, Ye R, Goebel SJ, Jayaraman P, Masters PS. 2010. An interaction between the nucleocapsid protein and a component of the replicase-transcriptase complex is crucial for the infectivity of coronavirus genomic RNA. J. Virol. 84:10276–10288 [DOI] [PMC free article] [PubMed] [Google Scholar]
- 18. Grossoehme NE, Li L, Keane SC, Liu P, Dann CE, III, Leibowitz JL, Giedroc DP. 2009. Coronavirus N protein N-terminal domain (NTD) specifically binds the transcriptional regulatory sequence (TRS) and melts TRS-cTRS RNA duplexes. J. Mol. Biol. 394:544–557 [DOI] [PMC free article] [PubMed] [Google Scholar]
- 19. Keane SC, Liu P, Leibowitz JL, Giedroc DP. 2012. Functional transcriptional regulatory sequence (TRS) RNA binding and helix destabilizing determinants of murine hepatitis virus (MHV) nucleocapsid (N) protein. J. Biol. Chem. 287:7063–7073 [DOI] [PMC free article] [PubMed] [Google Scholar]
- 20. Stump WT, Hall KB. 1993. SP6 RNA polymerase efficiently synthesizes RNA from short double-stranded DNA templates. Nucleic Acids Res. 21:5480–5484 [DOI] [PMC free article] [PubMed] [Google Scholar]
- 21. MicroCal 2002. MicroCalorimeter user's manual. MicroCal, Northampton, MA [Google Scholar]
- 22. Markley JL, Bax A, Arata Y, Hilbers CW, Kaptein R, Sykes BD, Wright PE, Wuthrich K. 1998. Recommendations for the presentation of NMR structures of proteins and nucleic acids. J. Mol. Biol. 280:933–952 [DOI] [PubMed] [Google Scholar]
- 23. Delaglio F, Grzesiek S, Vuister GW, Zhu G, Pfeifer J, Bax A. 1995. NMRPipe: a multidimensional spectral processing system based on UNIX pipes. J. Biomol. NMR 6:277–293 [DOI] [PubMed] [Google Scholar]
- 24. Goddard TD, Kneller DG. Sparky 3. University of California, San Francisco, CA [Google Scholar]
- 25. Farrow NA, Muhandiram R, Singer AU, Pascal SM, Kay CM, Gish G, Shoelson SE, Pawson T, Forman-Kay JD, Kay LE. 1994. Backbone dynamics of a free and a phosphopeptide-complexed Src homology 2 domain studied by 15N NMR relaxation. Biochemistry 33:5984–6003 [DOI] [PubMed] [Google Scholar]
- 26. Kuzmic P. 1996. Program DYNAFIT for the analysis of enzyme kinetic data: application to HIV proteinase. Anal. Biochem. 237:260–273 [DOI] [PubMed] [Google Scholar]
- 27. Keane SC, Giedroc DP. 8 November 2012. 1H, 13C, 15N resonance assignments of murine hepatitis virus nonstructural protein 3a. Biomol. NMR Assign. [Epub ahead of print.] doi:10.1007/s12104-012-9443-5 [DOI] [PMC free article] [PubMed] [Google Scholar]
- 28. Ottiger M, Delaglio F, Bax A. 1998. Measurement of J. and dipolar couplings from simplified two-dimensional NMR spectra. J. Magn. Reson. 131:373–378 [DOI] [PubMed] [Google Scholar]
- 29. Guntert P. 2004. Automated NMR structure calculation with CYANA. Methods Mol. Biol. 278:353–378 [DOI] [PubMed] [Google Scholar]
- 30. Schwieters CD, Kuszewski JJ, Tjandra N, Clore GM. 2003. The Xplor-NIH NMR molecular structure determination package. J. Magn. Reson. 160:65–73 [DOI] [PubMed] [Google Scholar]
- 31. Valafar H, Prestegard JH. 2004. REDCAT: a residual dipolar coupling analysis tool. J. Magn. Reson. 167:228–241 [DOI] [PubMed] [Google Scholar]
- 32. Kupce E, Freeman R. 2003. Projection-reconstruction of three-dimensional NMR spectra. J. Am. Chem. Soc. 125:13958–13959 [DOI] [PubMed] [Google Scholar]
- 33. Kupce E, Freeman R. 2004. Projection-reconstruction technique for speeding up multidimensional NMR spectroscopy. J. Am. Chem. Soc. 126:6429–6440 [DOI] [PubMed] [Google Scholar]
- 34. Schanda P, Van Melckebeke H, Brutscher B. 2006. Speeding up three-dimensional protein NMR experiments to a few minutes. J. Am. Chem. Soc. 128:9042–9043 [DOI] [PubMed] [Google Scholar]
- 35. Lescop E, Schanda P, Brutscher B. 2007. A set of BEST triple-resonance experiments for time-optimized protein resonance assignment. J. Magn. Reson. 187:163–169 [DOI] [PubMed] [Google Scholar]
- 36. Lescop E, Rasia R, Brutscher B. 2008. Hadamard amino-acid-type edited NMR experiment for fast protein resonance assignment. J. Am. Chem. Soc. 130:5014–5015 [DOI] [PubMed] [Google Scholar]
- 37. Grzesiek S, Bax A. 1993. Amino acid type determination in the sequential assignment procedure of uniformly 13C/15N-enriched proteins. J. Biomol. NMR 3:185–204 [DOI] [PubMed] [Google Scholar]
- 38. Grzesiek S, Anglister J, Bax A. 1993. Correlation of backbone amide and aliphatic side-chain resonances in 13C/15N-enriched proteins by isotropic mixing of 13C magnetization. J. Magn. Reson. Series B 101:114–119 [Google Scholar]
- 39. Montelione GT, Lyons BA, Emerson SD, Tashiro M. 1992. An efficient triple resonance experiment using carbon-13 isotropic mixing for determining sequence-specific resonance assignments of isotopically-enriched proteins. J. Am. Chem. Soc. 114:10974–10975 [Google Scholar]
- 40. Bax AD, Clore GM, Driscoll PC, Gronenborn AM, Ikura M, Kay LE. 1990. Practical aspects of proton-carbon-carbon-proton three-dimensional correlation spectroscopy of 13C-labeled proteins. J. Magn. Reson. 87:620–627 [Google Scholar]
- 41. Kay LE, Ikura M, Bax A. 1990. Proton-proton correlation via carbon-carbon couplings: a three-dimensional NMR approach for the assignment of aliphatic resonances in proteins labeled with carbon-13. J. Am. Chem. Soc. 112:888–889 [Google Scholar]
- 42. Ikura M, Kay LE, Bax A. 1991. Improved three-dimensional 1H-13C-1H correlation spectroscopy of 13C-labeled protein using constant-time evolution. J. Biomol. NMR 1:299–304 [DOI] [PubMed] [Google Scholar]
- 43. Bax A, Clore GM, Gronenborn AM. 1990. 1H-1H correlation via isotropic mixing of 13C magnetization, a new three-dimensional approach for assigning 1H and 13C spectra of 13C-enriched proteins. J. Magn. Reson. 88:425–431 [Google Scholar]
- 44. Serrano P, Johnson MA, Almeida MS, Horst R, Herrmann T, Joseph JS, Neuman BW, Subramanian V, Saikatendu KS, Buchmeier MJ, Stevens RC, Kuhn P, Wuthrich K. 2007. Nuclear magnetic resonance structure of the N-terminal domain of nonstructural protein 3 from the severe acute respiratory syndrome coronavirus. J. Virol. 81:12049–12060 [DOI] [PMC free article] [PubMed] [Google Scholar]
- 45. Earhart CA, Vath GM, Roggiani M, Schlievert PM, Ohlendorf DH. 2000. Structure of streptococcal pyrogenic exotoxin A reveals a novel metal cluster. Protein Sci. 9:1847–1851 [DOI] [PMC free article] [PubMed] [Google Scholar]
- 46. Wang R, Taylor AB, Leal BZ, Chadwell LV, Ilangovan U, Robinson AK, Schirf V, Hart PJ, Lafer EM, Demeler B, Hinck AP, McEwen DG, Kim CA. 2010. Polycomb group targeting through different binding partners of RING1B C-terminal domain. Structure 18:966–975 [DOI] [PMC free article] [PubMed] [Google Scholar]
- 47. Calvo E, Escors D, Lopez JA, Gonzalez JM, Alvarez A, Arza E, Enjuanes L. 2005. Phosphorylation and subcellular localization of transmissible gastroenteritis virus nucleocapsid protein in infected cells. J. Gen. Virol. 86:2255–2267 [DOI] [PubMed] [Google Scholar]
- 48. White TC, Yi Z, Hogue BG. 2007. Identification of mouse hepatitis coronavirus A59 nucleocapsid protein phosphorylation sites. Virus Res. 126:139–148 [DOI] [PMC free article] [PubMed] [Google Scholar]
- 49. Chen H, Gill A, Dove BK, Emmett SR, Kemp CF, Ritchie MA, Dee M, Hiscox JA. 2005. Mass spectroscopic characterization of the coronavirus infectious bronchitis virus nucleoprotein and elucidation of the role of phosphorylation in RNA binding by using surface plasmon resonance. J. Virol. 79:1164–1179 [DOI] [PMC free article] [PubMed] [Google Scholar]
- 50. Siddell SG, Barthel AA, ter Meulen V. 1981. Coronavirus JHM: a virion-associated protein kinase. J. Gen. Virol. 52:235–243 [DOI] [PubMed] [Google Scholar]
- 51. Stohlman SA, Lai MMC. 1979. Phosphoproteins of murine hepatitis viruses. J. Virol. 32:672–675 [DOI] [PMC free article] [PubMed] [Google Scholar]
- 52. Blom N, Gammeltoft S, Brunak S. 1999. Sequence and structure-based prediction of eukaryotic protein phosphorylation sites. J. Mol. Biol. 294:1351–1362 [DOI] [PubMed] [Google Scholar]
- 53. Stohlman SA, Fleming JO, Patton CD, Lai MM. 1983. Synthesis and subcellular localization of the murine coronavirus nucleocapsid protein. Virology 130:527–532 [DOI] [PMC free article] [PubMed] [Google Scholar]
- 54. Masters PS. 2006. The molecular biology of coronaviruses. Adv. Virus Res. 66:193–292 [DOI] [PMC free article] [PubMed] [Google Scholar]
- 55. Baric RS, Nelson GW, Fleming JO, Deans RJ, Keck JG, Casteel N, Stohlman SA. 1988. Interactions between coronavirus nucleocapsid protein and viral RNAs: implications for viral transcription. J. Virol. 62:4280–4287 [DOI] [PMC free article] [PubMed] [Google Scholar]
- 56. Stohlman SA, Baric RS, Nelson GN, Soe LH, Welter LM, Deans RJ. 1988. Specific interaction between coronavirus leader RNA and nucleocapsid protein. J. Virol. 62:4288–4295 [DOI] [PMC free article] [PubMed] [Google Scholar]
- 57. Choi KS, Huang P, Lai MM. 2002. Polypyrimidine-tract-binding protein affects transcription but not translation of mouse hepatitis virus RNA. Virology 303:58–68 [DOI] [PubMed] [Google Scholar]
- 58. Kamata T, Watanabe Y. 1977. Role for nucleocapsid protein phosphorylation in the transcription of influenza virus genome. Nature 267:460–462 [DOI] [PubMed] [Google Scholar]
- 59. Hsu CH, Kingsbury DW. 1985. Constitutively phosphorylated residues in the NS protein of vesicular stomatitis virus. J. Biol. Chem. 260:8990–8995 [PubMed] [Google Scholar]
- 60. Shih CM, Chen CM, Chen SY, Lee YH. 1995. Modulation of the trans-suppression activity of hepatitis C virus core protein by phosphorylation. J. Virol. 69:1160–1171 [DOI] [PMC free article] [PubMed] [Google Scholar]
- 61. Koetzner CA, Parker MM, Ricard CS, Sturman LS, Masters PS. 1992. Repair and mutagenesis of the genome of a deletion mutant of the coronavirus mouse hepatitis virus by targeted RNA recombination. J. Virol. 66:1841–1848 [DOI] [PMC free article] [PubMed] [Google Scholar]
Associated Data
This section collects any data citations, data availability statements, or supplementary materials included in this article.