Abstract
The oncolytic potential of measles vaccine virus (MeV) has been demonstrated in several tumor entities. Here, we investigated the susceptibility of eight sarcoma cell lines to MeV-mediated oncolysis and found five to be susceptible, whereas three proved to be resistant. In the MeV-resistant cell lines, we often observed an inhibition of viral replication along with a strong upregulation of the intracellular virus-sensing molecule RIG-I and of the interferon (IFN)-stimulated gene IFIT1. Not only expression of IFIT1 but also phosphorylation of IFN-stimulated Stat1 took place rapidly and were found to be persistent over time. In contrast, susceptible cell lines showed a much weaker, delayed, or completely missing expression of IFIT1 as well as a delayed or only transient phosphorylation of Stat1, whereas exogenic stimulation with beta interferon (IFN-β) resulted in a comparable profound activation of Stat1 and expression of IFIT1 in all cell lines. Pretreatment with IFN-β rendered three of the susceptible cell lines more resistant to MeV-mediated oncolysis. These data suggest that differences in the innate immune defense often account for different degrees of susceptibility of sarcoma cell lines to MeV-mediated oncolysis. From a therapeutic perspective, we were able to overcome resistance to MeV by increasing the multiplicity of infection (MOI) and by addition of the prodrug 5-fluorocytosine (FC), thereby exploiting the suicide gene function of virotherapeutic vector MeV-SCD armed with the SCD fusion protein, which consists of yeast cytosine deaminase and yeast uracil phosphoribosyltransferase.
INTRODUCTION
Sarcomas are tumors of mesenchymal origin which can be divided into soft-tissue and bone sarcomas, representing 1% of adult and 15% of pediatric malignancies (1). Sarcomas can only be cured by complete surgical resection. In the palliative setting, chemo- and radiotherapy result in 5-year survival rates of only about 50% (2). Therefore, more effective therapies are urgently needed.
Oncolytic viruses are currently under broad investigation for the treatment of cancer and already have entered numerous clinical trials (3). These viruses are able to infect and replicate in tumor cells, resulting in cell lysis, whereas nontransformed cells are not only hardly infected but also exhibit a block in viral replication. To improve efficacy, oncolytic viruses have been armed with suicide genes which convert nontoxic prodrugs into toxic drugs, resulting in local chemotherapy (4).
In preclinical trials, vesicular stomatitis virus (VSV) (5, 6) as well as the recombinant vaccinia virus GLV-1h68 (7) have been shown to exert oncolytic activity against human sarcomas. Of note, six clinical trials are currently ongoing using oncolytic viruses for the treatment of therapy-resistant sarcomas (8).
Measles vaccine virus (MeV) has shown its oncolytic potential in a number of tumor entities, including hepatocellular carcinoma (9), ovarian carcinoma (10), and lymphoma (11). Currently, MeV is under clinical investigation for the treatment of ovarian carcinoma, multiple myeloma, and glioblastoma multiforme (12, 13). MeV has an excellent safety record, having been used as a vaccine for about 50 years with minimal toxicity. However, so far no studies exist concerning the oncolytic effect of MeV for the treatment of sarcomas.
Infections with viruses are known to strongly activate the innate immune system. During viral replication, pathogen-associated molecular patterns (PAMP) are generated which are recognized by the intracellular sensing molecules retinoic acid inducible gene I (RIG-I) and melanoma differentiation-associated gene 5 (MDA5) (14). RIG-I was shown to be activated by RNAs carrying 5′ triphosphates (15). In addition, a short double strand is required which encompasses the nucleotide carrying the triphosphate (16). Such double strands are present in the panhandle of negative-strand RNA viruses. For Sendai virus, another paramyxovirus, it was shown that full-length viral genomes, but not short replication intermediates or viral transcripts, are able to activate RIG-I (17). MDA5 has been reported to be activated by long double-stranded RNA (dsRNA). Activation of these cytoplasmic receptors activates a downstream signaling cascade, resulting in the production of type I interferons (IFNs) (14). Secreted IFN binds to its cognate receptor, thus activating the Janus kinase signal transducer and activator of transcription (JAK/Stat) signaling pathway (18). This results in the induction of IFN-stimulated genes (ISG) which generate an antiviral state in infected and neighboring uninfected cells, thereby efficiently inhibiting viral replication and spread. However, viruses have evolved mechanisms to counteract the activation of the immune system. For example, the V protein of wild-type MeV (MeV-V) interacts with MDA5, thus suppressing MDA5-induced IFN production (19, 20). In contrast, laboratory-adapted strains of MeV, such as the Ed-tag laboratory strain, strongly induce IFN production due to a point mutation in the V gene being introduced during production of this first MeV cDNA clone (21–23). Furthermore, RNA-based vaccine strains such as MeV generally induce a strong IFN production also triggered by the production of defective interfering (DI) RNAs (24). Recently, V proteins of paramyxoviruses were also shown to interact with the RNA helicase LGP2, thereby inhibiting the activation of RIG-I (25). Moreover, in plasmacytoid dendritic cells (pDCs), which play a central role in the activation of immune responses due to their capacity to express IFN-α, MeV-V was reported to bind to IκB kinase α (IKKα), competing with IRF7 for phosphorylation, and also to IRF7, resulting in inhibition of IFN induction (26). In addition, MeV-V interacts with Stat1 and Jak1, thereby inhibiting the phosphorylation of Stat1 (27). In a different study, it was shown that binding of MeV-V to Stat2 is required for the inhibition of IFN-α/β signaling (28).
Here, we generated an armed virotherapeutic MeV vector (MeV-SCD) encoding a fusion protein consisting of yeast cytosine deaminase and yeast uracil phosphoribosyltransferase, termed super cytosine deaminase (SCD) (29). SCD converts the antimycotic prodrug 5-fluorocytosine (5-FC) into the clinically approved chemotherapeutic 5-fluorouracil (5-FU) and facilitates further conversion into 5-fluorouridine monophosphate (5-FUMP) (30). Further metabolites of 5-FU then inhibit thymidylate synthase or are incorporated into DNA and RNA, thereby interfering with DNA, RNA, and protein synthesis (31). Recently, an armed MeV vector encoding a fusion protein of cytosine deaminase and uracil phosphoribosyltransferase derived from E. coli has been employed for the treatment of head-and-neck squamous cell carcinoma (32).
In this study, we investigated the oncolytic effect of the virotherapeutic vector MeV-SCD in eight human sarcoma cell lines. We found a differential susceptibility with three cell lines showing primary resistance due to lower primary infection rates and a profound inhibition of viral replication. On a molecular level, we often found an upregulation of intracellular sensing molecules and of ISGs upon infection in the resistant cell lines, indicating a major role of the innate immune system in preventing MeV-induced oncolysis. Notably, we were able to break primary resistance to oncolysis in two out of three resistant cell lines by addition of 5-FC and by increasing the infectious dosage.
MATERIALS AND METHODS
Cell culture.
Vero African green monkey kidney cells were obtained from the German Collection of Microorganisms and Cell Cultures (DSMZ; Braunschweig, Germany). Human fibrosarcoma HT1080 and A673 (extraosseous Ewing sarcoma) cells were purchased from the American Type Culture Collection (no. CCL-121 and CRL-1598, respectively; ATCC; Manassas, VA). Cell lines SRH (sclerosing spindle cell rhabdomyosarcoma), BR and ZF (alveolar rhabdomyosarcoma), SCOS (osteosarcoma), CCS (clear cell sarcoma), and ST (dedifferentiated leiomyosarcoma) were established and characterized at the University Children's Hospital Tübingen. DNA profiling was performed for the verification of human cell line identity between the original tumors from the respective patients and the established cell lines using the StemElite ID system (Promega, Mannheim, Germany). All cell lines were maintained in Dulbecco's modified Eagle's medium (DMEM; Sigma-Aldrich, Munich, Germany) supplemented with 10% fetal calf serum (FCS; PAA Laboratories, Pasching, Austria) at 37°C in a humidified atmosphere containing 5% CO2. Cells were stimulated by adding 1,000 U/ml of beta interferon (IFN-β; PeproTech, Rocky Hill, NJ) to the medium.
Construction of recombinant MeV.
For generation of the cDNA of our prototypic suicide gene-armed vector MeV-SCD, a commercially available original monovalent vaccine batch of MeV strain Mérieux (Sanofi-Pasteur, Leimen, Germany) was used for amplification of reverse transcription-PCR (RT-PCR) fragments. Subsequent sequencing proved 100% identity with the original Schwarz vaccine strain (data not shown). Details on the primers, the cloning, and the rescue strategy can be obtained from the authors upon request. In brief, the viral vectors were constructed as follows. The viral cDNA was inserted into a plasmid containing regulatory sequences (promoter and terminator) derived from cytomegalovirus (CMV). In this cDNA, an empty additional transcription unit (ATU) was integrated into genome position one. This ATU was synthesized by fusion PCR using primer pairs GAGCGGATAACAATTTCACACAGG and TATAACAATGATGGATGGCGCGCCTCGAGATATCCCTAATCCTGCTCTT as well as CGCGCCATCCATCATTGTTATAAAAAACTTAGGATTCAAGATCCTATT and CCTATTAGTGCCCCTGTTAGTTT. The open reading frame encoding SCD was integrated via restriction sites compatible with the unique AscI cloning site within the ATU, and the viruses were rescued by transfection of Vero cells with 5 μg viral cDNA and a mixture of plasmids encoding the viral proteins N, P, and L under the control of the CMV promoter (500, 100, and 500 ng, respectively) in FuGene HD (Roche Applied Science, Mannheim, Germany).
Production and titration of measles vaccine virus.
To prepare virus stocks, Vero cells (1 × 10⁷) were seeded in 15-cm plates (Greiner BioOne, Frickenhausen, Germany). The next day, cells were washed with phosphate-buffered saline (PBS; PAA Laboratories) and infected for 3 h at a multiplicity of infection (MOI) of 0.03 in Opti-MEM (Invitrogen, Carlsbad, CA). After infection, medium was replaced with DMEM supplemented with 10% FCS. Fifty-four h later, when most of the cells were infected, medium was removed, cells were scraped into 1 ml Opti-MEM, and the virus was released by one freeze-thaw cycle. After centrifugation (1,900 × g, 15 min, 4°C), the supernatant was stored at −80°C. Viral titers were determined according to the method of Kärber and Spearman on Vero cells (33, 34). The presence of 5′ copy-back DI RNAs was analyzed using standard genome-specific primers JM396 (5′-TATAAGCTTACCAGACAAAGCTGGGAATAGAAACTTCG-3′) and JM402 (5′-TTTATCCAGAATCTCAARTCCGG-3′), as well as DI-specific primers JM396 and JM403 (5′-CGAAGATATTCTGGTGTAAGTCTAGTA-3′) (24). Viral RNA was isolated using the High Pure viral RNA kit (Roche Applied Science, Mannheim, Germany). Two μg of viral RNA was used for reverse transcription using the Long-Range 2-Step RT-PCR kit (Qiagen, Hilden, Germany) and primer JM396. To amplify standard genomes, primers JM396 and JM402 were used, resulting in an amplicon of 304 bp. To detect DI RNAs, PCRs were performed with primers JM396 and JM403. However, no DI RNAs could be detected in our stocks of MeV-SCD and MeV-green fluorescent protein (MeV-GFP) (data not shown). Cycling conditions were 3 min at 94°C, followed by 30 cycles for 10 s at 94°C, 30 s at 60°C, and 2 min at 72°C.
Virus infections.
One day after plating, cells were washed once with PBS and infected with MeV-GFP (marker gene vector in which the GFP gene was integrated into genome position one, just as in suicide gene-armed vector MeV-SCD) or MeV-SCD at an MOI of 0.01, 0.1, 1, or 10 in Opti-MEM. Three h postinfection (hpi), the inoculum was removed and normal growth medium was added. Where indicated, 5-fluorocytosine (5-FC) was added at the indicated concentrations, ranging from 100 nM to 1 mM.
SRB cell viability assay.
Cells were infected in 24-well plates (4 × 10⁴ cells per well) at the indicated MOIs. At 96 hpi, cells were washed once with ice-cold PBS and fixed with 10% trichloroacetic acid (TCA) for 30 min at 4°C. After washing with tap water and drying, proteins were stained for 10 min with sulforhodamine (SRB) (0.4% in 1% acetic acid), followed by washing with 1% acetic acid and drying again. Protein-bound dye was extracted with 10 mM Tris base (pH 10.5). After 10 min of incubation at room temperature, optical density was measured with a 96-well microtiter plate reader (Tecan Genios Plus; Tecan Deutschland, Crailsheim, Germany) at a wavelength of 550 nm (reference wavelength at 620 nm).
LDH release assay.
Cells were infected in 24-well plates (4 × 10⁴ cells per well) at the indicated MOIs. At 96 hpi, the percentage of lactate dehydrogenase (LDH) release was determined using the LDH Mono-P assay (Analyticon, Lichtenfels, Germany) according to the manufacturer's instructions. Relative LDH release was calculated as the ratio of supernatant to supernatant plus lysate.
Quantification of primary infection.
Cells were infected in 6-well plates (2.5 × 10⁵ cells per well) with MeV-GFP at the indicated MOIs. At 24 hpi, cells were detached with Accutase (PAA Laboratories) and washed once with PBS. Cells were resuspended in fluorescence-activated cell sorting (FACS) buffer (10% FCS in PBS) and fixed with 1.3% paraformaldehyde (PFA; Otto Fischar, Saarbrücken, Germany). Analysis was performed on a FACSCalibur (Becton, Dickinson [BD], Franklin Lakes, NJ) using Cell Quest software (BD).
Viral growth curves.
Cells were infected in 6-well plates (1 × 10⁵ cells per well) with MeV-SCD at an MOI of 0.03. At 3 hpi, the inoculum was removed and cells were washed three times with PBS. One ml DMEM supplemented with 5% FCS was added to each well. Supernatants and cells (scraped off in 1 ml Opti-MEM) were harvested at 3, 24, 48, 72, and 96 hpi. Viral titers were determined according to the method of Kärber and Spearman on Vero cells (33, 34). Infected cells were detected by immunofluorescence staining. In detail, cells were washed once with PBS and fixed with 4% PFA for 10 min at room temperature. After washing twice with PBS and blocking with 1% FCS in Tris-buffered saline (TBS) containing 0.02% Tween 20 (TBS-T), cells were incubated with anti-measles virus N-protein antibody (1:1,000 in TBS-T; clone 120; no. 95040312; ECACC, Salisbury, United Kingdom) for 30 min at room temperature. After washing three times with TBS-T, incubation with a goat anti-mouse secondary antibody (Alexa Fluor 546; 1:1,000; Invitrogen) was performed for 30 min at room temperature in the dark. Cells were again washed three times with TBS-T and analyzed by fluorescence microscopy (IX50 instrument [Olympus, Tokyo, Japan]; Analysis software [Soft Imaging System, Münster, Germany]).
Detection of CD46 expression by flow cytometry.
Cells were washed with PBS, detached with Accutase, and diluted in FACS buffer (PBS containing 10% FCS). A total of 5 × 10⁵ cells were incubated with a phycoerythrin (PE)-labeled anti-human CD46 antibody (eBioscience Inc., San Diego, CA) or a PE-labeled IgG1 mouse isotype control (eBioscience) (0.5 μg diluted in FACS buffer) for 30 min on ice. Cells were washed with PBS and resuspended in FACS buffer. Flow-cytometric analysis was performed on a FACSCalibur (Becton, Dickinson, Franklin Lakes, NJ) using Cell Quest software (Becton, Dickinson). The mean fluorescence index represents the ratio of the arithmetic mean of CD46 staining to the isotype control (35).
Immunoblotting.
Cells were infected in a tissue culture dish with MeV-SCD at an MOI of 1. At the indicated time points, cells were washed with PBS and lysed in lysis buffer (50 mM Tris, 150 mM NaCl, and 1% Nonidet P40). Lysates were then subjected to three freeze-thaw cycles, and insoluble material was removed by centrifugation. Protein concentration in the supernatants was determined by Bradford protein assay (Bio-Rad, Hercules, CA). Fifty μg (MeV N-protein and SCD) or 75 μg (Stat1, P-Stat1, and IFIT1) protein was separated by 8% SDS-PAGE and transferred to a hydrophobic polyvinylidene difluoride membrane (Amersham Hybond-P; GE Healthcare, Buckinghamshire, United Kingdom). After blocking with 5% powdered milk (Carl Roth, Karlsruhe, Germany) in TBS-T, membranes were incubated with primary antibodies (anti-measles N-protein; ab23974; 1:6,000; Abcam, Cambridge, United Kingdom; anti-SCD; 1:1,000; kind gift from Transgene S.A., Illkirch-Graffenstaden, France; anti-P-Stat1; 9171; 1:1,000; Cell Signaling Technology, Danvers, MA; anti-Stat1; sc-592; 1:1,000; Santa Cruz Biotechnology, Santa Cruz, CA; anti-IFIT1; GTX103452; 1:1,000; GeneTex, Irvine, CA; anti-vinculin; 1:5,000; Sigma-Aldrich) with gentle shaking overnight at 4°C. Membranes were washed three times with TBS-T. Secondary antibodies (horseradish peroxidase-conjugated anti-rabbit, anti-rat, and anti-mouse) were added for 1 h, and the membranes were washed another three times with TBS-T. Proteins were detected with Amersham ECL Western blotting detection reagents (GE Healthcare, Buckinghamshire, United Kingdom). A prestained protein ladder (PageRuler Plus; Thermo-Scientific, Waltham, MA) was used for determination of molecular weights.
qPCR.
RNA was isolated using the RNeasy Minikit (Qiagen, Hilden, Germany). One μg of RNA then was reverse transcribed using the QuantiTect reverse transcription kit (Qiagen, Hilden, Germany). Fifty ng of cDNA was analyzed in duplicate reactions by quantitative PCR (qPCR) using 0.3 μM gene-specific primers and 1× LightCycler 480 SYBR green I master mix (Roche Applied Science, Mannheim, Germany) in a total volume of 20 μl. PCRs were carried out in a Light Cycler 480 (Roche Applied Science, Mannheim, Germany) using a thermal profile of 10 min at 95°C followed by 45 cycles for 10 s at 95°C, 15 s at 55°C, and 15 s at 72°C, a melting curve for 10 s at 95°C and 30 s at 60°C, heating to 90°C, and cooling for 30 s at 40°C, and then they were analyzed using LightCycler 480 software, version 1.5 (Roche Applied Science, Mannheim, Germany). Relative expression levels were calculated as described previously (36) using phosphoglycerate kinase 1 (PGK1) as a reference gene. Primer efficiencies were calculated using serial dilutions of cDNA and the Light Cycler software. Primer pairs to detect PGK1, MDA5, and RIG-I have been previously described (37). Primer pairs for TLR3 (QT00007714), IFIT1 (QT00201012), and IFNB (QT00203763) were commercially obtained (Qiagen, Hilden, Germany).
ELISA.
Cells were infected in 24-well plates (4 × 10⁴ cells per well) at an MOI of 1. Twenty-four, 36, 48, and 72 hpi supernatants were collected. The concentration of IFN-β in the supernatants was determined using the VeriKine human IFN-β enzyme-linked immunosorbent assay (ELISA) kit (pbl interferon source; Piscataway, NJ) according to the manufacturer's instructions.
siRNA treatment.
For short interfering RNA (siRNA) treatment, cells were transfected in 24-well (4 × 10⁴ cells per well) or 6-well (3 × 10⁵ cells per well) plates with 20 nM siIFIT1 (Hs_IFIT1_6; no. SI02660777; or Hs_IFIT1_2; no. SI00445879; Qiagen, Hilden, Germany) or 20 nM control siRNA (AllStars negative-control Alexa Fluor 647; no. 1027287; Qiagen) using Lipofectamine RNAiMAX (Invitrogen).
RESULTS
Differential pattern of susceptibility of sarcoma cell lines to MeV-SCD-mediated oncolysis being modulated by addition of the prodrug 5-FC.
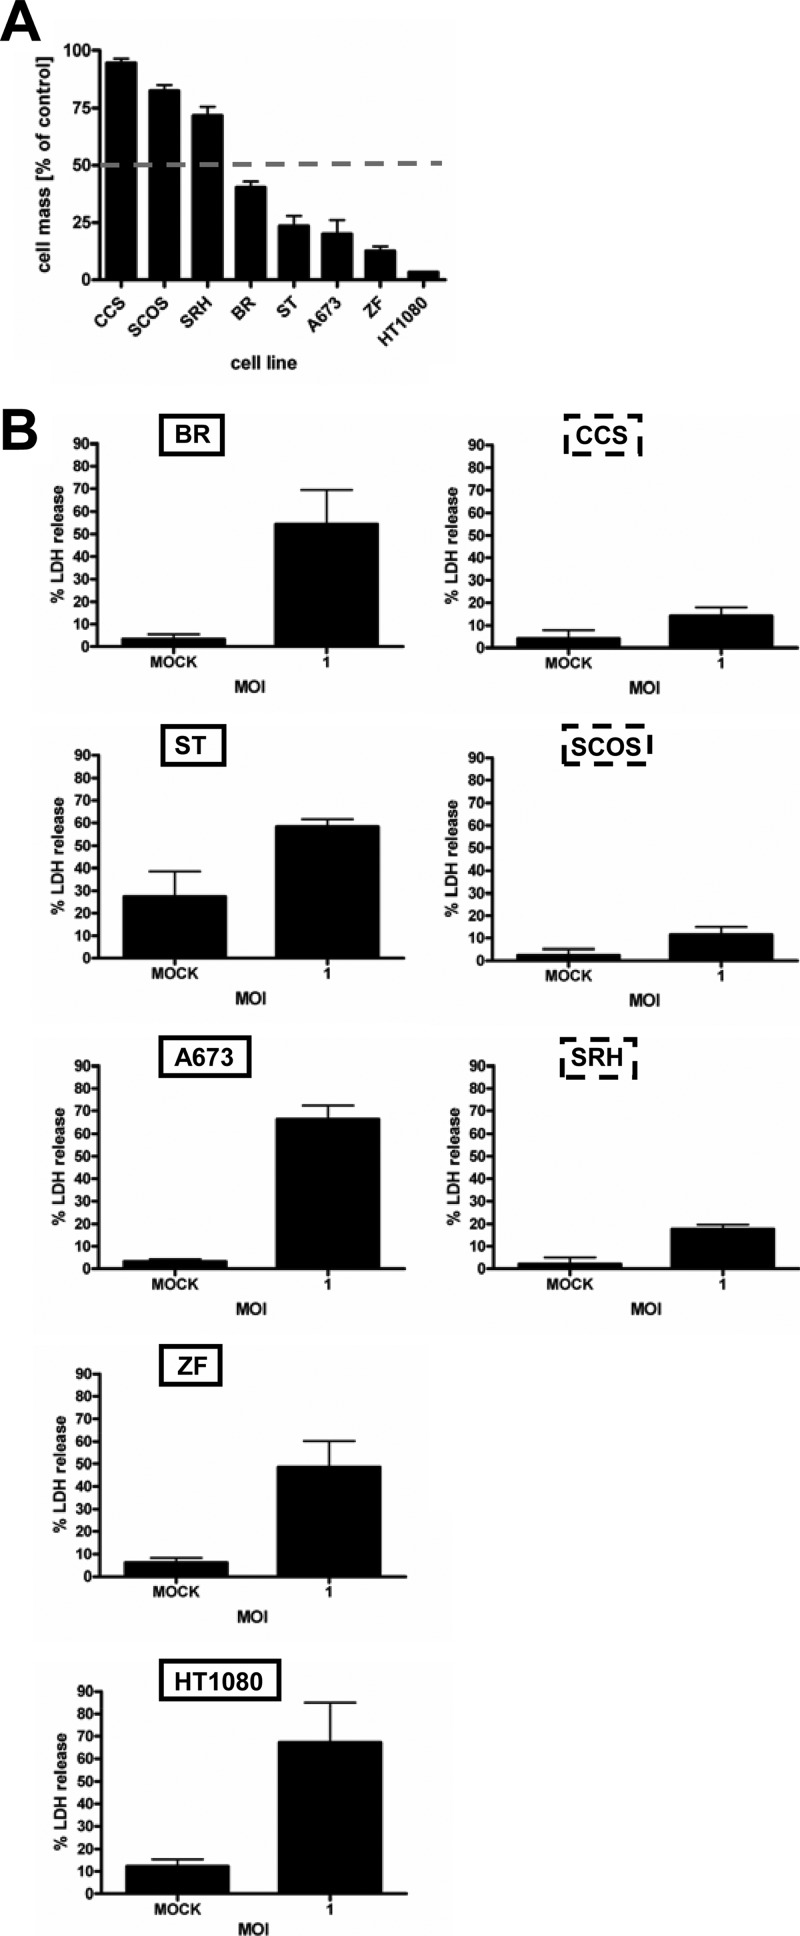
To investigate the susceptibility of sarcoma cells to MeV-mediated oncolysis, we infected a panel of eight sarcoma cell lines with MeV-SCD at an MOI of 1. Primary resistance to virotherapy was defined as a remaining cell mass of >50% relative to mock-infected controls (i.e., incubation with medium only) at 96 hpi. As a result, five cell lines were found to be susceptible to oncolysis by MeV-SCD, with remaining cell masses ranging from 3 to 40%, whereas three cell lines exhibited primary resistance (remaining cell masses between 72 and 95%) (Fig. 1A). To differentiate between inhibition of cell proliferation (as determined by SRB assays [Fig. 1A]) and cell lysis, we additionally measured a parameter indicating direct cell lysis, i.e., MeV-mediated oncolysis. For this purpose, the release of lactate dehydrogenase (LDH) was determined in all 8 sarcoma cell lines 96 hpi at an MOI of 1 (LDH release in mock-infected/uninfected cells was used as the baseline control). Whereas in the oncolysis-resistant cell lines values of LDH release only ranged from 11 to 18% (CCS, SCOS, and SRH) (Fig. 1B, right), values of LDH release were found to vary between 48 and 67% in the susceptible cell lines (BR, ST, A673, ZF, and HT1080) (Fig. 1B, left). These data indicate that the reduction in cell mass compared to that of mock-infected cells as measured by SRB assay is predominantly due to cell lysis/oncolysis. Inhibition of cell proliferation seems to play a minor role at best.
Fig 1.
Susceptibility of sarcoma cell lines to MeV-mediated oncolysis. Sarcoma cell lines were infected with MeV-SCD at an MOI of 1 without addition of the prodrug 5-FC. (A) At 96 hpi, the remaining cell mass was determined by SRB assay. Primary resistance was defined as a remaining tumor cell mass of more than 50% (gray dotted line) relative to the mock-infected control. (B) At 96 hpi, relative LDH release was determined. Means and standard errors of the means (SEM) from three independent experiments are shown.
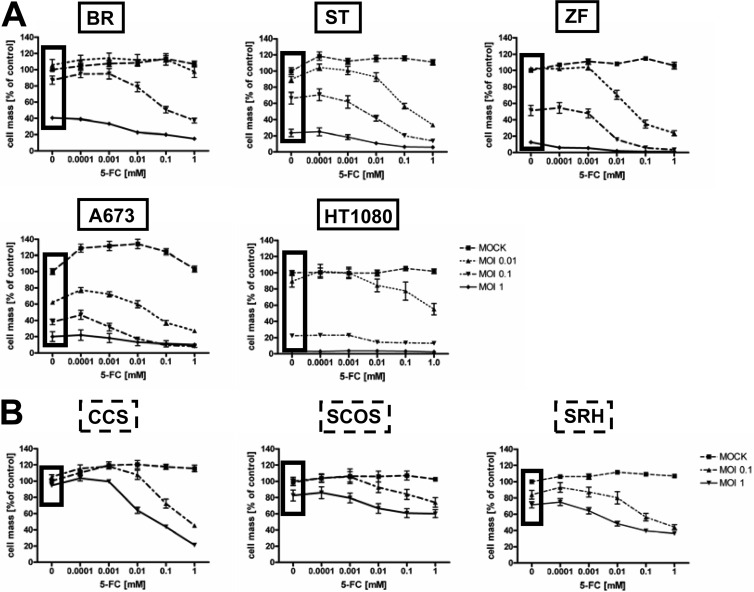
Cells next were infected with MeV-SCD at MOIs of 0.01, 0.1, and 1 (susceptible cell lines) (Fig. 2A) as well as 0.1 and 1 (resistant cell lines) (Fig. 2B). At 3 hpi, different concentrations of the prodrug 5-FC (10−4 to 100 mM) were added, followed by assessment of tumor cell viability again at 96 hpi. In the susceptible cell lines, high 5-FC concentrations (1 mM) had already strongly enhanced the oncolytic effect of MeV-SCD at a low MOI of 0.01 or 0.1 (Fig. 2A). Interestingly, addition of 5-FC also enhanced the oncolytic effect of MeV-SCD in two otherwise resistant cell lines (SRH and CCS), resulting in a reduction of the remnant cell mass from 71 to 36% for SRH cells (MOI of 1; 1 mM 5-FC) and from 94 to 21% for CCS cells (MOI of 1; 1 mM 5-FC). In contrast, SCOS cells still were found to be highly resistant even when infection with MeV-SCD was combined with a treatment of 1 mM 5-FC at an MOI of 1 (Fig. 2B), exhibiting a remnant cell mass of 60%, while that of cells without 5-FC treatment was 82%.
Fig 2.
Effect of the addition of the prodrug 5-FC on MeV-SCD-mediated oncolysis. Sarcoma cell lines were infected with MeV-SCD at MOIs of 0.01, 0.1, and 1 (A) or at MOIs of 0.1 and 1 (B) or were mock infected and then treated with increasing concentrations of 5-FC, ranging from 0.0001 to 1 mM 5-FC, or were left untreated. Black frames encircle results of cell masses obtained without addition of 5-FC. Means and SEM from three independent experiments are shown.
Expression levels of known measles virus receptors in our sarcoma cell panel.
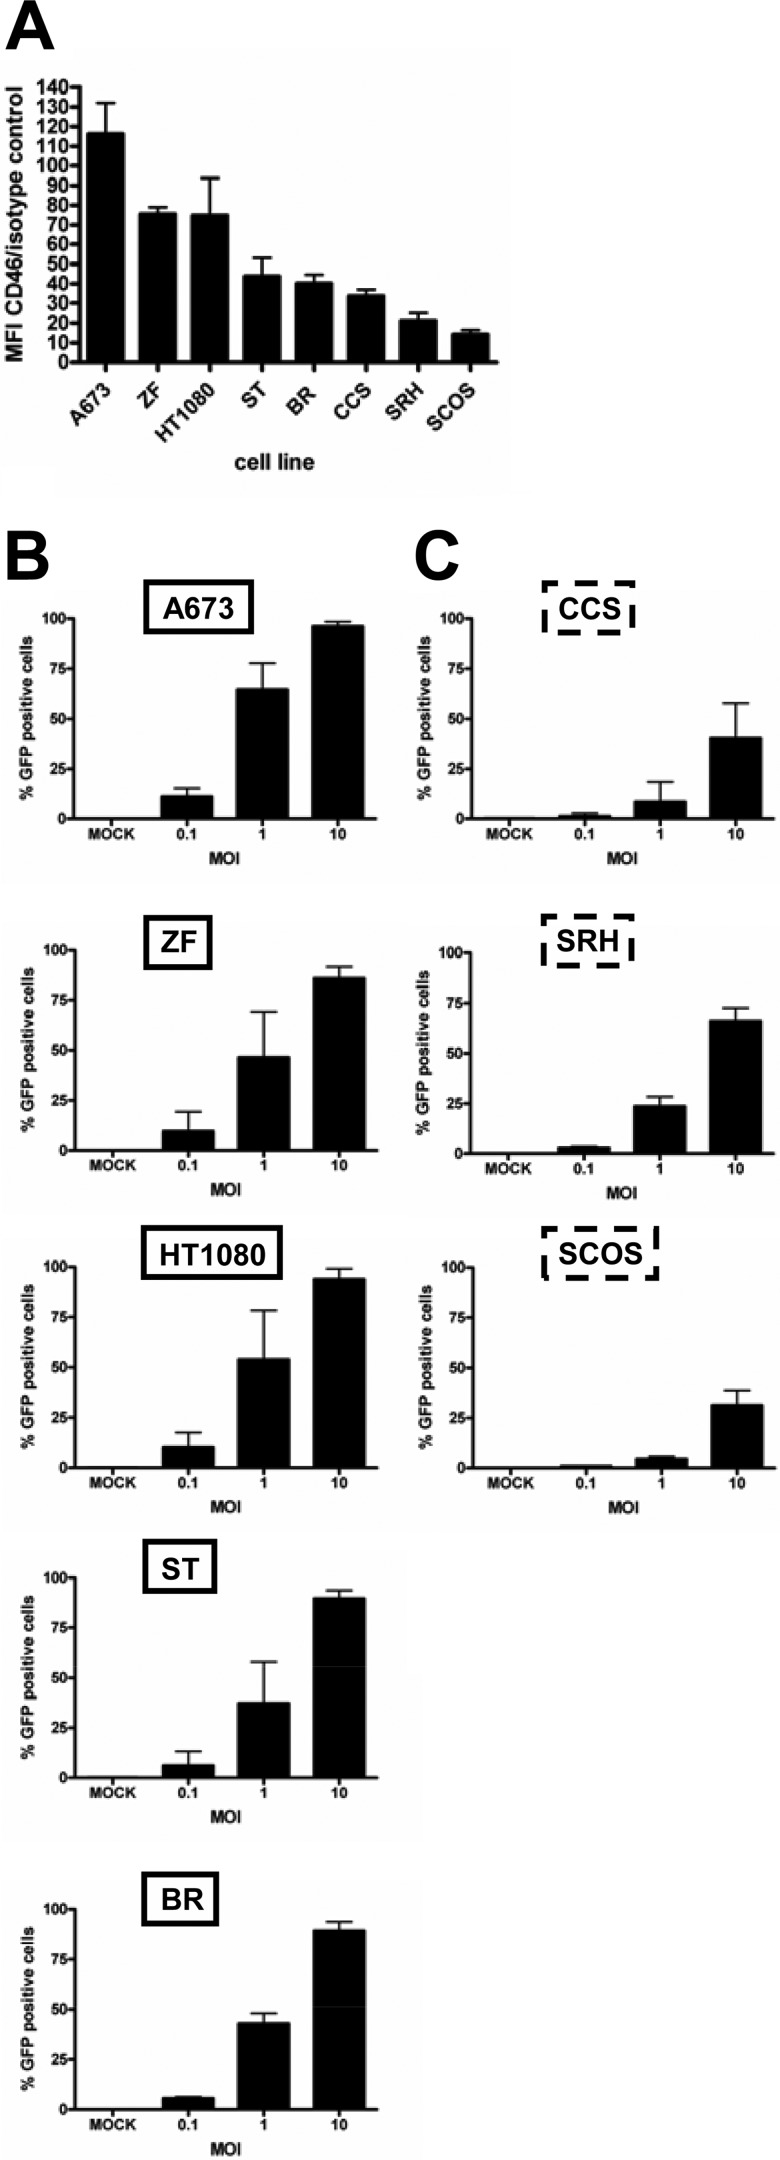
To get insight into the mechanisms of the observed differential susceptibilities to MeV-mediated oncolysis, we first confirmed the expression of the measles vaccine virus receptor CD46 by flow cytometry in cell lines that were susceptible or resistant to MeV-mediated oncolysis (Fig. 3A). Calculation of mean fluorescence indices (MFI) (35) revealed higher expression levels in the susceptible cell lines (A673, ZF, HT1080, ST, and BR) than in resistant cell lines (CCS, SRH, and SCOS). Interestingly, none of the 8 cell lines of our sarcoma panel was found to express either of the other two known MeV receptors, SLAM and nectin-4 (data not shown).
Fig 3.
Receptor expression and primary infection rates. (A) Sarcoma cell lines were stained with anti-CD46 antibody or an isotype control. Expression was analyzed by flow cytometry. MFI indicates the ratios of the arithmetic means of the CD46 staining/isotype control. Means and SEM from three independent experiments are shown. Susceptible (B) and resistant (C) sarcoma cell lines were infected with MeV-GFP at MOIs of 0.1, 1, and 10 or were mock infected. At 24 hpi, the percentage of GFP-expressing cells was determined by flow cytometry.
Primary infection rates in sarcoma cells.
Primary infection rates were determined next. For this purpose, all eight sarcoma cell lines were infected with a GFP marker gene encoding MeV vector (MeV-GFP) at MOIs of 0.1, 1, and 10 or were mock infected, followed by quantification of GFP expression at 24 hpi by flow cytometry (Fig. 3B and C). At an MOI of 0.1, primary infection rates in the susceptible cell lines ranged from 5.6 to 11.1% (average, 8.54%) (Fig. 3B) and from 0.9 to 2.9% in the resistant cell lines (average, 1.7%) (Fig. 3C). At an MOI of 1, primary infection rates in the susceptible cell lines varied between 37.3 and 64.4% (average, 49%) (Fig. 3B) and in the resistant cell lines between 4.4 and 23.6% (average, 12.2%) (Fig. 3C). At an MOI of 10, all susceptible cell lines showed very high primary infection rates, between 86 and 96% (average, 90.9%) (Fig. 3B); in contrast, resistant cell lines displayed much lower rates, between 31.3 and 66.1% (average, 45.9%) (Fig. 3C). In summary, susceptible cell lines were found to be infected more efficiently than resistant ones.
Viral replication in sarcoma cell lines.
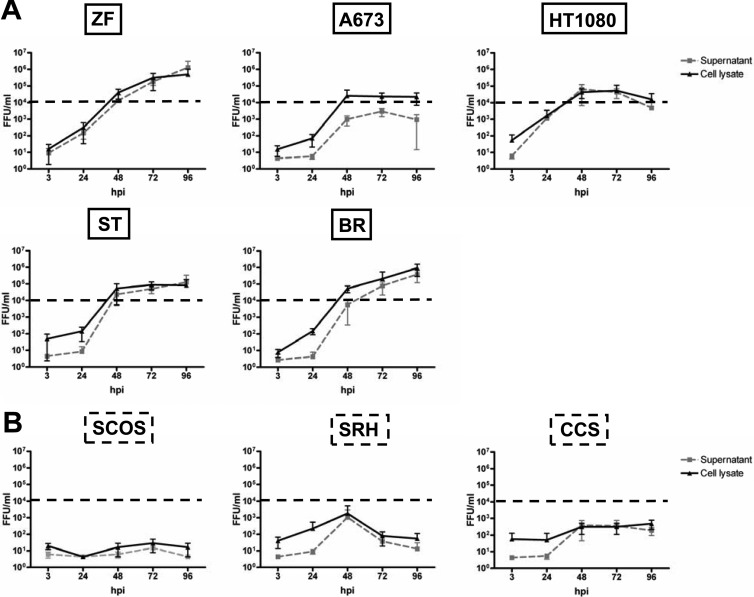
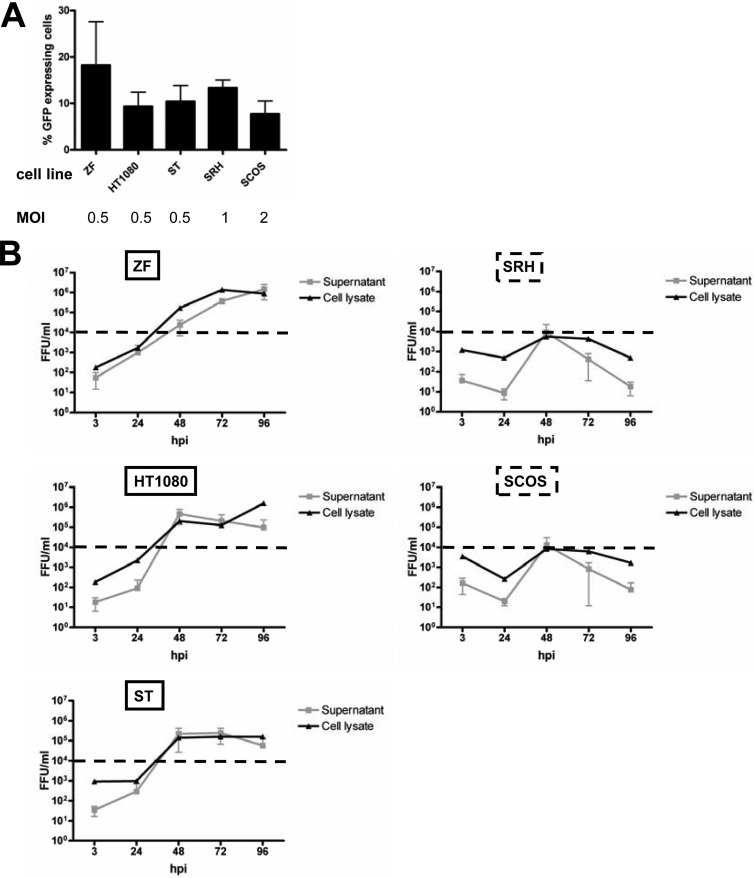
To determine whether resistance to MeV-mediated oncolysis is due to an inhibition of viral replication, we next performed viral growth curve assays starting with a fixed inoculation dosage of MeV-SCD at an MOI of 0.03 (i.e., 3,000 infectious viral particles per 105 sarcoma cells per well) for all cell lines of our sarcoma cell panel and observed the following patterns (Fig. 4). Three susceptible cell lines (BR, ST, and ZF) showed a continuous increase in virus yield over time, reaching titers in the range of 105 to 106 fluorescent focus-forming units per ml (FFU/ml). In contrast, A673 cells had already reached a plateau at 48 hpi. Furthermore, in HT1080 cells, titers reached a peak at 48 hpi (105 FFU/ml) and then were found to slowly decline in virus production (Fig. 4A). In contrast, in the resistant cell lines there was either no relevant virus production at all (SCOS cells), a transient increase in viral titers (SRH cells) reaching a maximum of 1.3 × 10³ FFU/ml (supernatant) and 2.2 × 10³ FFU/ml (lysate), or a very slow and weak viral replication, ending in titers below 103 FFU/ml (CCS cells) (Fig. 4B). Dashed horizontal lines in Fig. 4 indicate a threshold level of 104 FFU/ml, which is not reached in oncolysis-resistant cell lines, being indicative of this quite insufficient production of infectious progeny virus particles in all oncolysis-resistant cell lines.
Fig 4.
Replication of MeV-SCD in sarcoma cell lines. Sarcoma cell lines that were susceptible (A) or resistant (B) to MeV-based oncolysis were infected with an identical/fixed dose of MeV-SCD (MOI of 0.03). Supernatants (black lines) and cells (gray dotted lines) were harvested at the indicated time points. Titrations were performed on Vero cells and are given as fluorescent focus-forming units per ml (FFU/ml). Means and standard deviations (SD) from three independent experiments are shown.
To further investigate to what extent these results are influenced by differences in virus entry between the different cell lines, we thought it helpful to examine virus growth kinetics for a subset of our sarcoma cell lines after infection with virus titers that result in similar rates of primary infection. For this purpose, viral growth curve assays were repeated with different MOIs yielding quite similar primary infection rates, ranging from 7.7 to 18.2% (Fig. 5A), as indicated by the percentage of GFP-positive cells at 24 hpi. In detail, cell lines susceptible to oncolysis and viral growth (HT1080, ST, and ZF) were infected at an MOI of 0.5, whereas cell lines displaying reduced viral growth were infected at an MOI of 1 (SRH) and 2 (SCOS) (Fig. 5A). In the resistant cell lines SRH and SCOS, viral replication was found to be transient, resulting in peak titers of only 104 FFU/ml at 48 hpi (Fig. 5B). In susceptible ZF cells, viral titers of 1.4 × 10⁶ FFU/ml were reached at 96 hpi in the supernatant and at 72 hpi in the cell lysate. In susceptible HT1080 cells, a peak titer of 4.5 × 10⁵ FFU/ml was reached in the supernatant at 48 hpi, whereas in the cell lysate there was a continuous increase in viral titers up to 1.6 × 10⁶ at 96 hpi. In susceptible ST cells, viral replication reached a maximum at 2.4 × 10⁵ in the supernatant and at 1.6 × 10⁵ in the cell lysate at 72 hpi.
Fig 5.
Differences in viral replication between sarcoma cell lines that were susceptible or resistant to MeV-based oncolysis are not primarily due to differences in virus entry. (A) In order to yield similar rates of primary infection, a subset of sarcoma cell lines that was susceptible or resistant to MeV-based oncolysis was infected with the GFP-encoding reporter vector MeV-GFP at MOIs ranging from 0.5 to 2. At 24 hpi, the percentage of GFP-expressing cells was determined. (B) Supernatants (gray lines) and cells used for preparation of cell lysates (black lines) were harvested at the indicated time points. Titrations were performed on Vero cells and calculated as FFU/ml. Means and SD from three independent experiments are shown.
Taken together, these data indicate that differences in viral replication between oncolysis-resistant and -susceptible sarcoma cell lines are not primarily due to differences in virus entry but rather are caused subsequently by an inhibition of replication. Thus, growth curves revealed a profound inhibition of viral replication in the resistant cell lines.
Induction of pathogen receptor and ISG expression upon MeV-SCD infection.
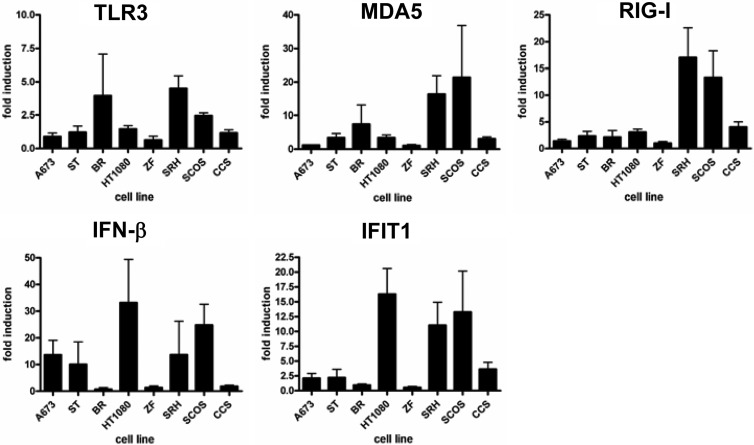
Naturally, viral infections lead to the activation of cytoplasmic receptors MDA5 and RIG-I, triggering expression of IFN-β and of interferon-stimulated genes (ISG). To further elucidate the molecular mechanisms of resistance to MeV-SCD-mediated virotherapy, expression levels of both intracellular pathogen receptors as well as ISGs were analyzed by quantitative RT-PCR (qRT-PCR). For this purpose, sarcoma cell lines were infected with MeV-SCD at an MOI of 1 or were mock infected. At 6 hpi, total RNA was isolated and qRT-PCR was performed using primers specific for TLR3, MDA5, RIG-I, IFN-β, and IFIT1, representing a prototypic ISG (Fig. 6). As a result, no clear correlation between virotherapy resistance patterns and expression levels of TLR3, MDA5, and IFN-β were detectable; however, a strong induction of RIG-I expression upon infection was found in resistant cell lines SRH (16.8-fold) and SCOS (14.9-fold), whereas the resistant cell line CCS showed a weaker induction of only 4.3-fold (Fig. 6 and Table 1). In contrast, in the susceptible cell lines the induction of RIG-I expression was found to be 3.1-fold (for HT1080 cells) or less (Fig. 6 and Table 1). Also, expression of IFIT1 was strongly induced upon infection with MeV-SCD in resistant cell lines SRH (12.9-fold) and SCOS (13.9-fold), whereas the induction in CCS cells again was much weaker (3.1-fold) (Fig. 6 and Table 1). In contrast, susceptible cell lines exhibited only weak induction rates of 2-fold (for A673 cells) and 1.5-fold (for ST cells) or less with only one exception: HT1080 cells displayed a 16.3-fold induction of IFIT1 expression.
Fig 6.
Induction of TLR3, RIG-I, MDA5, IFN-β, and IFIT1 in sarcoma cell lines. Sarcoma cell lines were mock infected or infected with MeV-SCD at an MOI of 1. At 6 hpi, RNA was isolated and qRT-PCR was performed. Values were normalized to the housekeeping gene PGK. For each cell line, values for mock-infected cells were set to 1. Means and SD from three independent experiments are shown.
Table 1.
mRNA expression levels of sarcoma cells either mock infected or infected with MeV-SCD (MOI of 1) and harvested at 6 hpi
| Cell type | Expression ofa: |
|||||||||
|---|---|---|---|---|---|---|---|---|---|---|
| TLR3 |
MDA5 |
RIG-I |
IFN-β |
IFIT1 |
||||||
| Mock | 6 hpi | Mock | 6 hpi | Mock | 6 hpi | Mock | 6 hpi | Mock | 6 hpi | |
| A673 | 0.05 | 0.04 | 0.11 | 0.13 | 0.21 | 0.25 | 0.01 | 0.18 | 0.01 | 0.02 |
| ST | 0.41 | 0.44 | 0.75 | 1.35 | 1.13 | 1.54 | 0.26 | 0.63 | 0.18 | 0.27 |
| BR | 0.00 | 0.00 | 0.06 | 0.13 | 0.18 | 0.46 | 0.01 | 0.00 | 0.02 | 0.02 |
| HT1080 | 0.16 | 0.24 | 0.19 | 0.62 | 0.97 | 3.00 | 0.02 | 0.72 | 0.03 | 0.49 |
| ZF | 0.02 | 0.01 | 0.07 | 0.08 | 0.20 | 0.16 | 0.05 | 0.06 | 0.03 | 0.01 |
| SRH | 1.00 | 4.41 | 1.00 | 16.78 | 1.00 | 16.77 | 1.00 | 15.24 | 1.00 | 12.88 |
| SCOS | 0.42 | 1.03 | 0.26 | 4.26 | 0.42 | 6.27 | 0.05 | 1.40 | 0.18 | 2.51 |
| CCS | 0.18 | 0.21 | 4.36 | 14.58 | 1.07 | 4.6 | 0.14 | 0.24 | 0.81 | 2.49 |
All results are depicted relative to the results obtained with mock-infected SRH cells (results are set to 1.00; depicted in boldface). Results of the three sarcoma cell lines that are resistant to MeV-mediated oncolysis (SRH, SCOS, and CCS) are presented in the last three rows.
In addition, we also compared the relative mRNA expression levels after grouping the results of mock-infected and MeV-SCD-infected susceptible versus resistant sarcoma cell lines (Table 1). Mean values for expression of IFN-β in mock-infected cell lines were 0.08 (susceptible) and 0.39 (resistant), respectively, whereas at 6 hpi with MeV-SCD (MOI of 1), mean values of 0.34 (susceptible) and 5.62 (resistant) were reached. For IFIT1, there was an 11-fold difference in basal expression between susceptible and resistant cell lines (0.06 versus 0.66). At 6 hpi, the difference was 35-fold and therefore even more prominent, reaching mean values of 0.17 in susceptible cell lines and 5.96 in resistant cell lines. For RIG-I, there were minor differences in mock-infected cells (0.57 versus 0.83). At 6 hpi, mean expression values were 1.11 (susceptible cell lines) and 9.21 (resistant cell lines). For MDA5, mock-infected resistant cell lines again displayed higher relative mRNA expression levels than susceptible cell lines (1.87 versus 0.26). Upon infection, mean values rose to 0.52 in susceptible cell lines and 11.87 in resistant cell lines. For TLR3, levels increased from 0.13 to 0.5 in susceptible and from 0.53 to 1.88 in resistant cell lines.
These data suggest that resistance to virotherapy is at least in part due to elevated levels of cytoplasmic pathogen receptors and ISGs. Resistant cell lines in general display higher basal mRNA expression levels of pathogen receptors and ISGs and also show higher induction rates upon infection with MeV-SCD.
Secretion of IFN-β upon MeV-SCD infection.
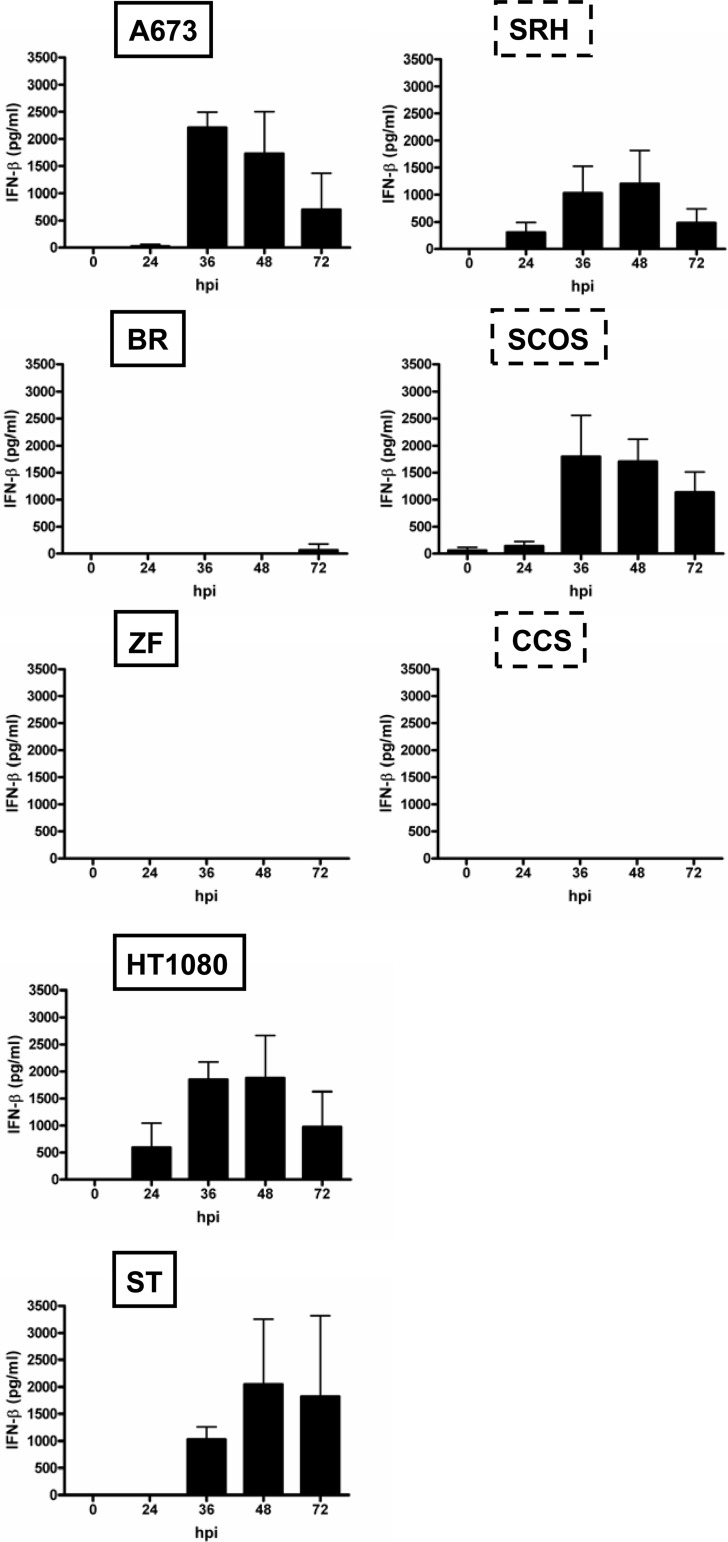
We observed quite low baseline levels of IFN-β secretion into cell culture supernatants, which after infection with MeV-SCD (MOI of 1) were found to increase in only two out of three oncolysis-resistant cell lines (Fig. 7, right, SCOS and SRH). A maximum IFN secretion of 1,200 pg/ml was reached in SRH cells at 48 hpi and of 1,800 pg/ml in SCOS cells at 36 hpi. In contrast, no IFN-β was detectable in the supernatants of oncolysis-resistant CCS cells. When looking at the patterns of MeV-SCD-based IFN induction in the oncolysis-susceptible cell lines (Fig. 7, left), two out of five cell lines displayed little (BR) or no (ZF) induction of IFN-β release. In contrast, A673, HT1080, and ST cell lines exhibited patterns of IFN-β release similar to those of the two oncolysis-resistant cell lines SCOS and SRH, reaching maxima of 1,900 pg/ml (HT1080) at 48 hpi, 2,000 pg/ml (ST) at 48 hpi, and 2,200 pg/ml (A673) at 36 hpi, respectively. These data are in line with the data obtained by qRT-PCR showing no clear correlation between IFN levels and resistance to oncolysis.
Fig 7.
Secretion of IFN-β in sarcoma cell lines. Sarcoma cell lines were mock infected or infected with MeV-SCD at an MOI of 1. Supernatants were collected at the indicated time points. IFN-β in the supernatants was determined by ELISA. Means and SD from three independent experiments are shown.
Resistant cell lines exhibit a strong persistent activation of IFN signaling.
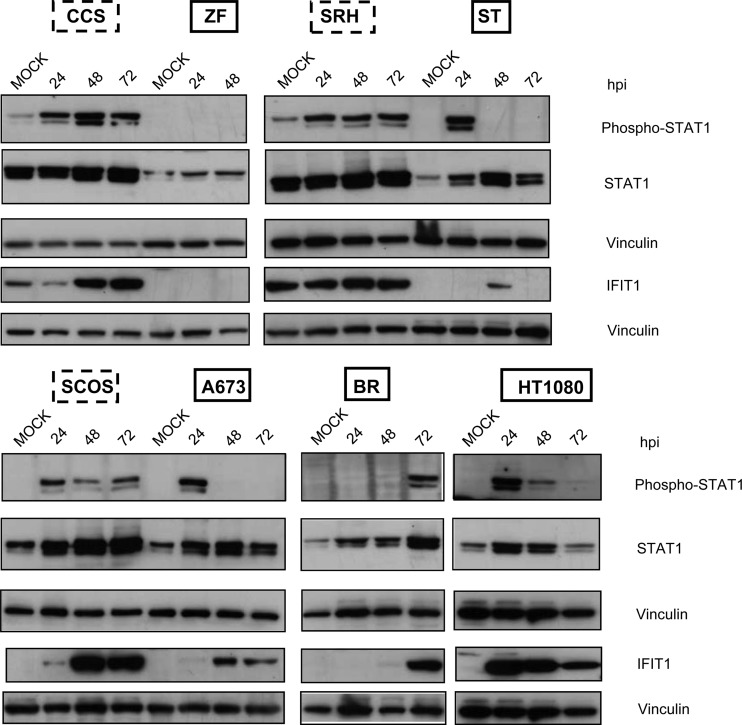
Binding of IFN-β to its cognate receptor leads to activation of the Jak-Stat signaling pathway, resulting in the phosphorylation of Stat1 and Stat2 and formation of trimeric complexes together with IRF-9, which then activates transcription of ISGs. In order to investigate a potential modulation of Stat1 phosphorylation and IFIT1 protein expression in the course of MeV-mediated virotherapy, all sarcoma cell lines were infected with MeV-SCD at an MOI of 1. At 24, 48, and 72 hpi, cells were lysed and immunoblotting was performed (Fig. 8). As a result, Stat1 constitutively was found to be weakly phosphorylated in resistant cell lines SRH and CCS (Fig. 8, upper); at 24 hpi, phosphorylation was detectable in all resistant cell lines (CCS, SCOS, and SRH), which persisted up to 72 hpi. In contrast, in the susceptible sarcoma cell lines, different patterns were found. In ZF cells, there was no phosphorylation of Stat1 at all. In ST and A673 cells, a transient phosphorylation at 24 hpi was detectable. In HT1080 cells, Stat1 was found to be transiently phosphorylated at 24 and 48 hpi. In BR cells, Stat1 phosphorylation only took place in a delayed manner at 72 hpi. Due to a lack of viable cells at 72 hpi, no immunoblotting could be performed for ZF cells at this late time point.
Fig 8.
Phosphorylation of Stat1 and expression of IFIT1 in sarcoma cell lines in the course of MeV-SCD infection. Sarcoma cell lines were infected with MeV-SCD (MOI of 1) or were mock infected. At the indicated time points cells were lysed. Mock-infected cells were harvested at 72 hpi. Phosphorylation and expression of Stat1 and the expression of IFIT1 were analyzed by immunoblotting. Vinculin was used as a loading control.
Concerning expression of prototypic ISGs, IFIT1 was found to be constitutively expressed in the resistant SRH and CCS cells (Fig. 8). Upon infection with MeV-SCD, IFIT1 expression was found to be increased in the resistant cell lines, persisting for up to 72 hpi. No IFIT1 expression was detectable in ZF cells, correlating with the missing Stat1 phosphorylation. In BR cells, IFIT1 expression was found only in a delayed manner at 72 hpi. In ST cells, expression was transiently detectable only at 48 hpi. In A673 cells, IFIT1 expression appeared first at 48 hpi. The only susceptible cell line which showed strong and persistent expression of IFIT1 was HT1080. These findings support our data obtained by qRT-PCR, indicating that differences in the innate immune defense account for differences in the susceptibility of sarcoma cell lines to MeV-mediated oncolysis.
Exogenous stimulation with IFN-β results in activation of the Jak-Stat signaling pathway and ISG expression.
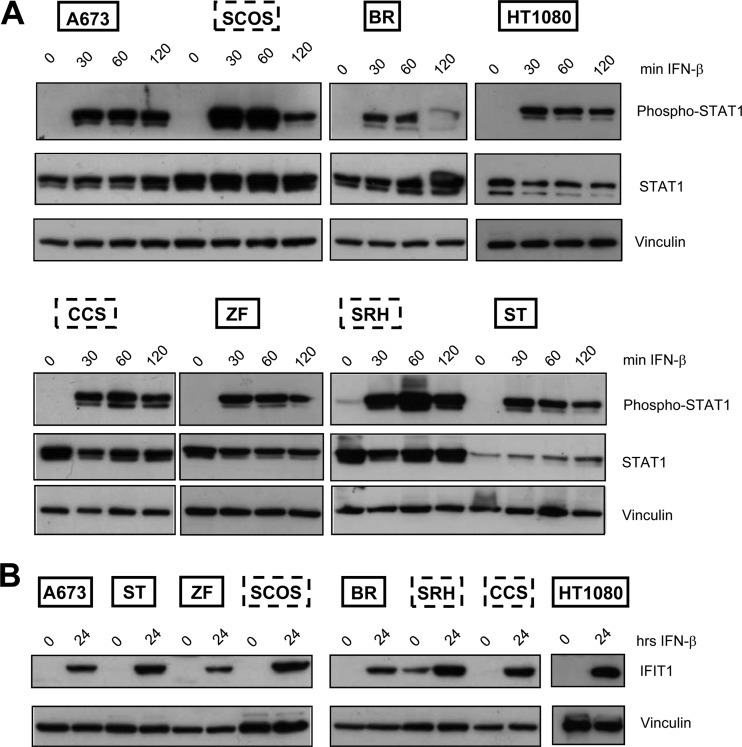
To find out whether susceptible cell lines had a general defect in IFN signaling, all sarcoma cells were stimulated with IFN-β for different time periods, followed by immunoblot analysis of the activation of Stat1 and expression of IFIT1. In all sarcoma cell lines, phosphorylation of Stat1 was detectable after 30 min and persisted for up to 2 h (Fig. 9A). IFIT1 expression also was found in all sarcoma cell lines after 24 h (Fig. 9B), indicating that exogenous stimulation with IFN-β resulted in both activation of the Jak-Stat signaling pathway and expression of ISGs independently of patterns of susceptibility or resistance to MeV-mediated oncolysis. Therefore, differences accounting for differential susceptibility supposedly are located further upstream.
Fig 9.
IFN-β induces Stat1 phosphorylation and IFIT1 expression in sarcoma cell lines. (A) Cells were stimulated with IFN-β for the indicated time periods or left untreated. Immunoblotting was performed to detect the expression of phosphorylated and total Stat1 and vinculin. (B) Cells were stimulated with IFN-β for 24 h or left untreated. Expression of IFIT1 and vinculin was analyzed by immunoblotting.
Effect of pretreatment with IFN-β on susceptibility to MeV-mediated oncolysis and viral replication.
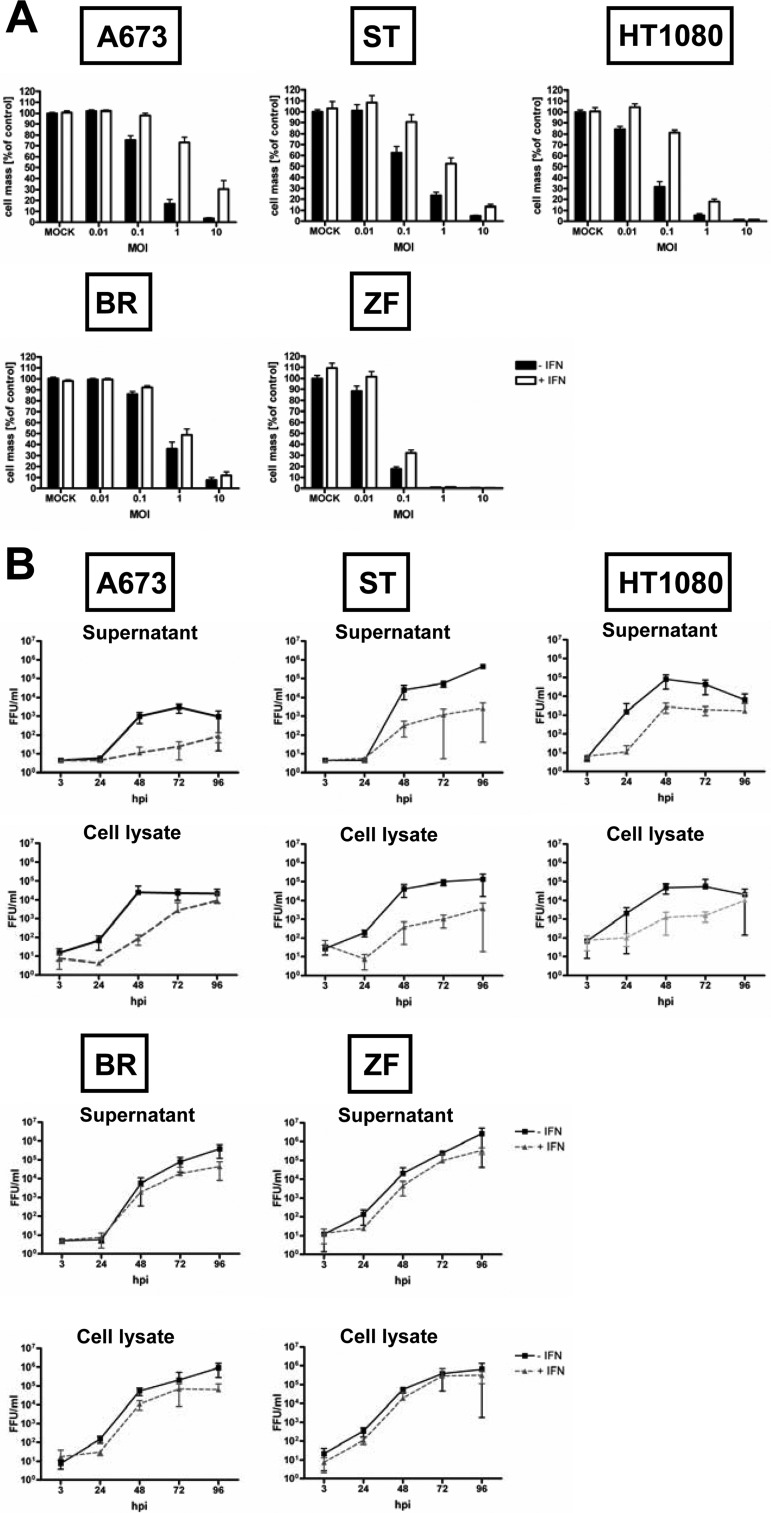
Since resistant cell lines showed a strong and persistent activation of the IFN signaling pathway, we investigated whether pretreatment of susceptible cell lines with IFN-β rendered them more resistant to MeV-mediated oncolysis. Susceptible cell lines were pretreated for 20 h with IFN-β (1,000 U/ml) and then infected with MeV-SCD at MOIs of 0.01, 0.1, 1, and 10. At 96 hpi, the remaining tumor cell mass was determined (Fig. 10A). In BR and ZF cells, no protective effect of IFN pretreatment was found. In A673 and HT1080 cells, pretreatment with IFN-β increased cell survival at an MOI of 1 from to 17 to 73% and 5 to 18%, respectively. In ST cells, the effect was moderate, with an increase in viability from 23 to 52%.
Fig 10.
Effects of prestimulation with IFN-β on MeV-mediated oncolysis and viral replication. (A) Cells were prestimulated with IFN-β (1,000 U/ml) for 20 h (white bars) or were left unstimulated (black bars), followed by infection with MeV-SCD at different MOIs. At 96 hpi, remnant tumor cell masses were determined by SRB assay. Values were calculated relative to those of untreated controls. Means and SEM from three independent experiments are shown. (B) Cells were prestimulated with IFN-β for 24 h before infection with MeV-SCD at an MOI of 0.03 (gray dotted lines) or were left unstimulated (black lines). At the indicated time points, supernatants (upper panel) and cell lysates (lower panel) were harvested. Titration was performed on Vero cells. Means and SD from three independent experiments are shown.
To determine if increased survival paralleled inhibition in viral replication, growth curve assays were performed in the presence or absence of IFN-β pretreatment (Fig. 10B). Consistent with the missing effect on cell survival, IFN-β pretreatment did not influence viral replication in BR and ZF cells. In A673 and HT1080 cells, viral replication was delayed but reached similar titers at a later time point, i.e., at 96 hpi. In ST cells, replication was also delayed in the course of IFN-β pretreatment, and viral titers were still lower at 96 hpi. Interestingly, primary infection rates (measured using MeV-GFP) were also influenced by IFN-β pretreatment as determined by FACS analysis at 24 hpi (Fig. 11). At an MOI of 1, pretreatment with IFN-β led to a reduction of the primary infection rates in cell lines A673 (from 64 to 27%) and ST (from 34 to 12%). In HT1080 cells, a moderate reduction from 24 to 16% was observed. In cell lines ZF and BR, only a minor reduction from 41 to 35% and 48 to 36%, respectively, was found. Thus, pretreatment with exogenous IFN-β was found to be able to protect sarcoma cell lines to different extents from MeV-mediated oncolysis. This protection was demonstrated to go along with an inhibition of viral replication and reduced rates of primary infection.
Fig 11.
Primary infection rates in the absence or presence of IFN-β. Sarcoma cell lines were pretreated for 20 h with IFN-β (1,000 U/ml) or left untreated, followed by infection with MeV-GFP at MOIs of 0.1, 1, and 10 or mock infection. For determination of primary infection rates, the percentage of GFP-expressing cells was determined at 24 hpi by FACS analysis.
Suppression of IFIT1 expression confers susceptibility to MeV-mediated oncolysis in SRH cells but not in SCOS and CCS cells.
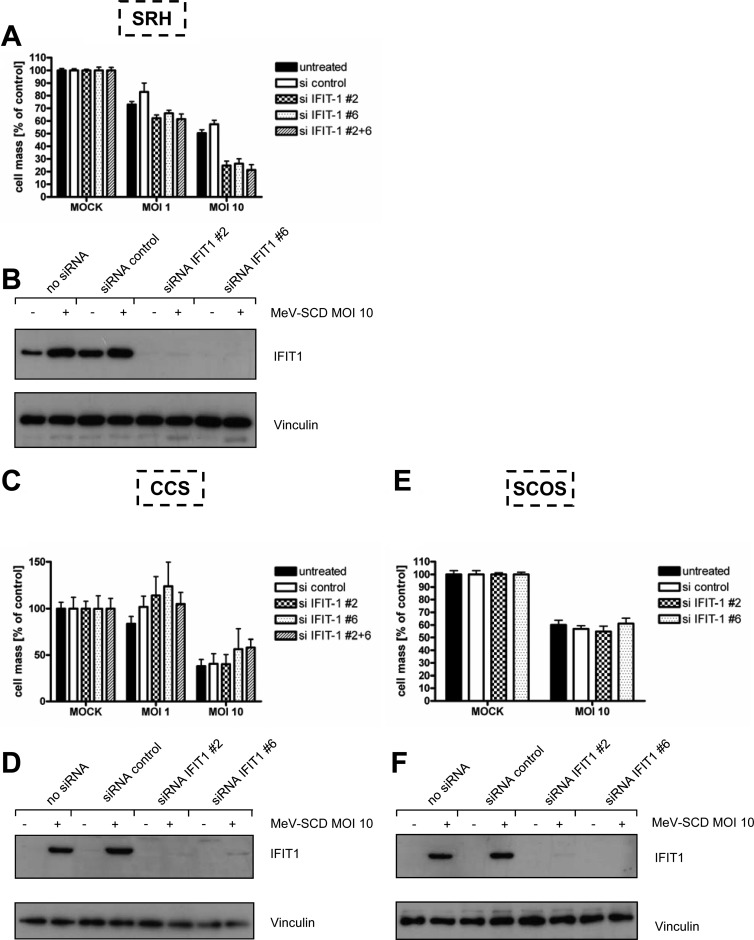
Since IFIT1 was shown to bind to 5′-triphosphorylated RNA, which arises during the life cycle of many negative-stranded RNA viruses, thereby inhibiting viral replication, we investigated if knockdown of IFIT1 using two different siRNAs and a combination of both renders resistant cells more susceptible to MeV-mediated oncolysis. SRH cells, constitutively expressing IFIT1 (Fig. 12B, lanes 1 and 3), were transfected with IFIT1 siRNAs or control siRNA or were mock transfected, and 24 h later they were infected with MeV-SCD at MOIs 1 and 10. As a result, immunoblots revealed an almost complete knockdown of IFIT1 expression (Fig. 12B, lanes 5 to 8). On this basis of significant suppression of IFIT1, SRH cell mass was determined at 72 hpi (Fig. 12A). At an MOI of 1, SRH cell mass was found to be reduced to 73% in mock-transfected cells and to 83% in control siRNA-transfected cells. In SRH cells with IFIT1 knockdown, the remnant cell mass was lowered to 62, 66, and 61%, respectively. At an MOI of 10, the oncolytic effect observed in the course of IFIT1 knockdown was even more prominent, resulting in remnant cell masses at 72 hpi of 25, 26, and 21%, respectively, compared to 50 and 57% in mock- and control siRNA-transfected cells. These data suggest that the constitutive expression of IFIT1 observed in SRH cells plays a key role in conferring resistance to MeV-mediated oncolysis in these cells.
Fig 12.
Influence of IFIT1 knockdown in sarcoma cells on resistance to MeV-mediated oncolysis. Sarcoma cells were transfected with control siRNA (si control), two different IFIT1 siRNAs (siIFIT1 #2 and siIFIT1 #6), or a combination of both (siIFIT1 #2 + 6). Twenty-four h later, cells were infected with MeV-SCD at an MOI of 1 or 10 or were mock infected. Cell viabilities were determined at 72 hpi by SRB assay. (A) SRH; (C) CCS; (E) SCOS. Means and SEM from at least three independent experiments are shown. Additionally, expression of IFIT1 was analyzed at 72 hpi by immunoblotting. (B) SRH; (D) CCS; (F) SCOS. Vinculin was used as a loading control.
In order to determine the contribution of IFIT1 to oncolysis resistance in other oncolysis-resistant cell lines, we examined CCS and SCOS cells. In contrast to SRH cells, both CCS and SCOS cells were found to exhibit no constitutive IFIT1 protein expression (Fig. 12D, lanes 1 and 3, and F, lanes 1 and 3). Whereas transfections of CCS and SCOS cells with IFIT1 siRNAs again resulted in a nearly complete suppression of MeV-induced IFIT1 expression (Fig. 12D, lanes 6 and 8, and F, lanes 6 and 8), as was the case in SRH cells, this did not result in any significant reduction of the cell mass of either CCS or SCOS tumor cells, even when performing infections at an MOI of 10 (Fig. 12C and E). Thus, in the absence of a relevant constitutive expression of IFIT1, knockdown of MeV-induced IFIT1 expression (Fig. 12D, lanes 6 and 8, and F, lanes 6 and 8) does not result in a reversion of resistance to MeV-based oncolysis, again pointing out the heterogeneity of oncolysis resistance mechanisms in sarcoma cells.
Increased MOI as well as the addition of 5-FC are potent means to overcome primary resistance toward MeV-mediated oncolysis.
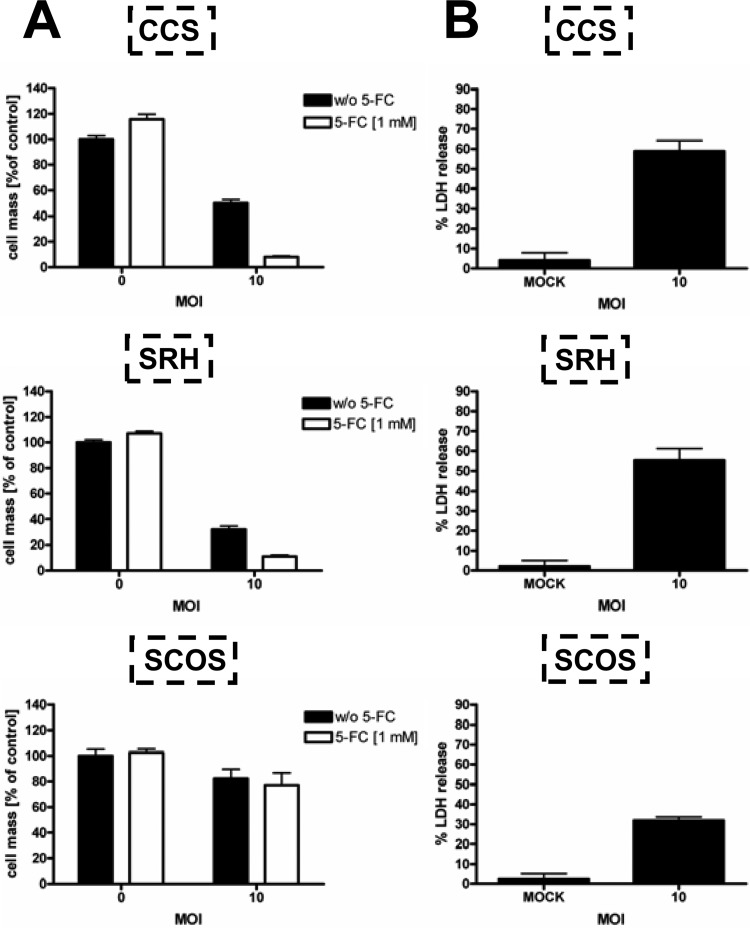
To investigate if increasing the MOI in combination with application of the prodrug 5-FC constitutes a suitable regimen to overcome primary resistance to MeV-mediated oncolysis, resistant sarcoma cell lines SRH, SCOS, and CCS were infected at an MOI of 10 (Fig. 13A). At 3 hpi, the prodrug 5-FC was added (1 mM), and tumor cell viability was determined at 96 hpi. In CCS cells, viability was reduced to 50% at an MOI of 10 (Fig. 13A, upper). Addition of 1 mM 5-FC further decreased the remnant cell mass to a very low level of only 8%. In SRH cells, infection with MeV-SCD at an MOI of 10 without and with 1 mM 5-FC resulted in a remaining cell mass of 32 and 11%, respectively (Fig. 13A, middle). In SCOS cells, neither increasing the MOI up to 10 nor addition of 5-FC was able to decrease cell viability (82 and 77% remaining cell mass, respectively) (Fig. 13A, lower). Of note, this phenomenon is explained at least in part by finding a lack of sensitivity to 5-FU of this specific cell line (data not shown). To investigate whether this reduction in cell mass at an MOI of 10 was primarily due to cell lysis or to an inhibition of cell proliferation, we also measured the release of LDH in the course of MeV-mediated oncolysis at an MOI of 10 (Fig. 13B). Interestingly, MeV-SCD-induced oncolysis of resistant sarcoma cells at an MOI of 10 led to an LDH release of 32 (SCOS), 55 (SRH), and 59% (CCS), which was much higher than the results obtained at an MOI of 1 (Fig. 1B). These data again indicate that the reduction in cell mass at 96 hpi obtained with MeV-SCD is mainly caused by cell lysis irrespective of employment of an MOI of 1 or 10.
Fig 13.
Effect of increased MOI together with addition of prodrug on the survival of resistant sarcoma cell lines. (A) Resistant sarcoma cell lines were infected with MeV-SCD at an MOI of 10 or were mock infected. The prodrug 5-FC was added 3 hpi. Cell viability was determined 96 hpi by SRB assay. Means and SEM from three independent experiments are shown. (B) Resistant sarcoma cell lines were infected with MeV-SCD at an MOI of 10 or were mock infected. Ninety-six hpi, LDH release was determined. Means and SD from three independent experiments are shown.
In summary, raising the MOI up to 10 together with the application of 5-FC constitutes a regimen that is able to overcome primary resistance to MeV-mediated oncolysis in two out of three primarily resistant cell lines.
DISCUSSION
No significant progress has been achieved in the palliative treatment of sarcomas in recent years. Therefore, novel therapies are urgently needed.
In this study, we used a novel measles vaccine virus armed with a suicide gene (MeV-SCD) to infect eight sarcoma cell lines representing seven different sarcoma types. Five cell lines proved to be susceptible to MeV-mediated oncolysis in the absence of the prodrug 5-FC. Three cell lines showed a primary resistance to MeV-mediated oncolysis (MOI of 1), defined by a remnant tumor cell mass of >50% at 4 days postinfection (dpi). Fortunately, this primary resistance could be overcome in two cell lines by the addition of 5-FC and a 10-fold increase in the applied virus dosage.
When aiming at unraveling the mechanisms of the phenomenon of primary resistance to MeV-mediated oncolysis, we first found that primary rates of MeV infection were lower in the resistant sarcoma cell lines than in the permissive cell lines. In addition, we were able to demonstrate that viral replication was inhibited in the resistant cell lines. Viral infection leads to the activation of the cytoplasmic sensing molecules RIG-I and MDA5. It was reported that MeV activates both RIG-I and MDA5 (38–40). The expression of IFN-stimulated genes generates an antiviral state in the cell, leading to an abortion of viral infections. In contrast to wild-type MeV, which inhibits IFN induction by interaction of its V protein with MDA5, MeV strains exhibit a point mutation in the MeV-V gene which abrogates binding of V protein to MDA5. Therefore, in contrast to MeV wild-type strains, infections with MeV strains constitutively trigger production of IFN (23). Moreover, infection with MeV strains leads to the generation of a higher percentage of defective interfering particles which stringently activate IFN production via both intracellular sensing molecules, RIG-I and MDA5 (24). In our study, we did not find any clear correlation between the induction of IFN-β mRNA expression and resistance to oncolysis in the investigated sarcoma cell lines. In contrast, we observed a strong upregulation of RIG-I mRNA in the resistant cell lines SCOS and SRH upon infection with MeV-SCD and a weaker induction in CCS cells, whereas no upregulation was seen in the susceptible cell lines. IFIT1 mRNA expression was again strongly induced in SCOS and SRH cells and only weakly in CCS cells. No induction of IFIT1 mRNA expression was seen in susceptible cell lines except for HT1080 cells displaying a high induction rate. Furthermore, when looking for secretion of IFN-β into cell culture supernatants, quite low baseline levels were observed, which after infection with MeV-SCD (MOI of 1) were found to increase in only two out of three oncolysis-resistant cell lines (SRH and SCOS). When looking at the patterns of MeV-SCD-based IFN induction in the oncolysis-susceptible cell lines, two out of five cell lines displayed no induction of IFN-β release, whereas the three other cell lines exhibited patterns of IFN-β release similar to those of the two oncolysis-resistant cell lines SCOS and SRH.
Tumor cells are often characterized by defects in IFN signaling pathways. In both susceptible and resistant cell lines, we found comparable activation of the Jak/Stat signaling pathway upon stimulation with IFN-β reflected by Stat1 phosphorylation and IFIT1 expression, supporting the hypothesis that differences accounting for resistance versus susceptibility to MeV are located upstream of the IFN production step.
This notion was further corroborated by our finding that in three out of five oncolysis-susceptible cell lines, IFN-β pretreatment led to a decreased primary infection rate and an inhibition or a delay in viral replication, resulting in a protective effect against MeV-SCD-mediated oncolysis (albeit to different extents in the respective cell lines). On the other hand, when we treated oncolysis-resistant cells (SCOS and SRH) with a neutralizing antibody to IFN-β, we observed no improvement in the susceptibility to MeV-mediated oncolysis (data not shown).
Taken together, these additional data reflect a quite heterogeneous reaction pattern on addition of IFN-β or on diminishment of IFN-β, again pointing out that malignant transformation even in a distinct tumor entity, such as human sarcomas, is extremely heterogenous and results in quite different patterns of signaling alterations.
With regard to the antiviral ISG IFIT1, we observed weak constitutive expression in the resistant cell lines with strong upregulation upon infection. Expression of IFIT1 is known to be triggered by IFN-α, -β, and -γ as well as by a number of RNA and DNA viruses. It can either be induced directly by RIG-I/MDA5-mediated activation of IRF-3, which binds to an IFN-stimulated response element (ISRE) in the promoter of IFIT1, or via activation of the Jak/Stat signaling pathway by binding of IFN-β to its cognate receptor. IFIT1 inhibits translation by interaction with eukaryotic translation initiation factor 3, subunit e (eIF3e) (41). IFIT1 was shown to inhibit translation initiation of hepatitis C virus (42). Furthermore, it was reported to inhibit human papillomavirus replication by binding to the E1 helicase (43). Moreover, IFIT1 was shown to inhibit viral replication by interacting with viral RNA carrying a triphosphate group on its 5′ terminus (PPP-RNA), e.g., VSV (44). We found that knockdown of IFIT1 in the oncolysis-resistant cell line SRH rendered the cells more susceptible to MeV-mediated oncolysis. This indicates a role for IFIT1 in the control of MeV replication in SRH cells. Since MeV also constitutes a PPP-RNA-type virus, this would be in accordance with published data. In contrast, in resistant CCS and SCOS cells no effect of IFIT1 knockdown on MeV-mediated oncolysis was seen, indicating that different mechanisms account for resistance to MeV-mediated oncolysis and that IFIT1 cannot be regarded as a key player in oncolysis resistance of sarcoma cells.
Resistance mechanisms against oncolytic adenovirus were investigated in an ovarian carcinoma model where all tumors, although being initially sensitive, finally relapsed. In this context, IFN signaling pathways were also found to be upregulated (45).
Recently, the oncolytic potential of VSV was investigated using 13 sarcoma cell lines (6). VSV was able to infect and lyse 12 out of 13 sarcoma cell lines; two of these cell lines (A673 and HT1080) also were part of our panel and were found to be susceptible to both VSV- and MeV-mediated oncolysis. In this VSV-based study, one sarcoma cell line, which was not part of our panel (SW982), also proved to be highly resistant against other nonrelated viruses. This phenomenon of oncolysis resistance to VSV most likely was due to a constitutive high expression of ISGs, since it could be overcome by preadministration of substances lowering ISG levels (e.g., IFN attenuator compound valproate). In line with our findings, susceptible cell lines could be protected to different extents from VSV infection by pretreatment with type I IFN (6). In our study, we also found a constitutive expression of the ISGs IFIT1 and MX1 (data not shown) in two of our resistant cell lines, while there still was a clear upregulation upon infection.
In a different study, a recombinant VSV expressing lacZ was shown to efficiently kill human and rat sarcoma cell lines, whereas normal human bone marrow stromal cells were refractory. VSV application by isolated limb perfusion inhibited tumor growth in a xenograft model (5). Recently, the oncolytic potential of the recombinant vaccinia virus GLV-1h68 was tested in four human sarcoma cell lines. As a result, this study revealed differences in susceptibility to vaccinia virus-mediated oncolysis, with two cell lines displaying survival at 7 dpi of at least 60% of the infected tumor cells; so far, a detailed analysis of these findings has not been undertaken. In a xenograft model using HT1080 sarcoma cells, tumor regression was demonstrated (7). The efficacy of two different vaccinia strains was also demonstrated in a canine soft-tissue sarcoma model (46). The only study using MeV so far in the context of sarcoma showed that a recombinant MeV which is activated by matrix metalloproteinases was able to inhibit HT1080 xenograft growth (47). However, HT1080 was the only sarcoma cell line used in this study.
In our study, we examined eight sarcoma cell lines exhibiting differential susceptibility to MeV-mediated oncolysis. Altered innate immune defense was found to account at least in part for the observed patterns of resistance versus susceptibility, identifying IFIT1 as a critical factor. Of paramount clinical importance, primary resistance to MeV could be broken by increasing the MOI and additional application of the prodrug 5-FC, thus exploiting the suicide function of vector MeV-SCD used in this study. This finding underlines the efficacy of our arming strategy. Taken together, these data indicate that MeV-SCD is a suitable tool for the treatment of sarcomas by helping to overcome substantial pretreatment resistance. However, they also underline the need for a patient-individualized pretherapeutic analysis on potential resistance phenomena, which enables the patient-specific determination of susceptibility to MeV oncolysis. Thereby, the observed major differences in susceptibility to MeV oncolysis could be addressed in a patient-to-patient manner.
ACKNOWLEDGMENTS
We thank Andrea Schenk for excellent technical assistance.
This work was supported in part by grants from the Deutsche Forschungsgemeinschaft (German Research Foundation; SFB 773–Project C3; U.M.L.) and by the Bundesministerium für Bildung und Forschung (German Federal Ministry of Education and Research; grant 01GU0503; U.M.L.).
Footnotes
Published ahead of print 9 January 2013
REFERENCES
- 1. Demetri GD, Antonia S, Benjamin RS, Bui MM, Casper ES, Conrad EU, III, DeLaney TF, Ganjoo KN, Heslin MJ, Hutchinson RJ, Kane JM, III, Letson GD, McGarry SV, O′Donnell RJ, Paz IB, Pfeifer JD, Pollock RE, Randall RL, Riedel RF, Schupak KD, Schwartz HS, Thornton K, von Mehren M, Wayne J, National Comprehensive Cancer Network Soft Tissue Sarcoma Panel 2010. Soft tissue sarcoma. J. Natl. Compr. Canc. Netw. 8:630–674 [DOI] [PubMed] [Google Scholar]
- 2. Demicco EG, Maki RG, Lev DC, Lazar AJ. 2012. New therapeutic targets in soft tissue sarcoma. Adv. Anat. Pathol. 19:170–180 [DOI] [PMC free article] [PubMed] [Google Scholar]
- 3. Russell SJ, Peng KW, Bell JC. 2012. Oncolytic virotherapy. Nat. Biotechnol. 30:658–670 doi:10.1038/nbt.2287 [DOI] [PMC free article] [PubMed] [Google Scholar]
- 4. Cattaneo R, Miest T, Shashkova EV, Barry MA. 2008. Reprogrammed viruses as cancer therapeutics: targeted, armed and shielded. Nat. Rev. Microbiol. 6:529–540 [DOI] [PMC free article] [PubMed] [Google Scholar]
- 5. Kubo T, Shimose S, Matsuo T, Fujimori J, Sakaguchi T, Yamaki M, Shinozaki K, Woo SL, Ochi M. 2011. Oncolytic vesicular stomatitis virus administered by isolated limb perfusion suppresses osteosarcoma growth. J. Orthop. Res. 29:795–800 doi:10.1002/jor.21307 [DOI] [PubMed] [Google Scholar]
- 6. Paglino JC, van den Pol AN. 2011. Vesicular stomatitis virus has extensive oncolytic activity against human sarcomas: rare resistance is overcome by blocking interferon pathways. J. Virol. 85:9346–9358 [DOI] [PMC free article] [PubMed] [Google Scholar]
- 7. He S, Li P, Chen CH, Bakst RL, Chernichenko N, Yu YA, Chen N, Szalay AA, Yu Z, Fong Y, Wong RJ. 2012. Effective oncolytic vaccinia therapy for human sarcomas. J. Surg. Res. 175:e53–e60 doi:10.1016/j.jss.2011.11.1030 [DOI] [PMC free article] [PubMed] [Google Scholar]
- 8. Lettieri CK, Hingorani P, Kolb EA. 2012. Progress of oncolytic viruses in sarcomas. Expert Rev. Anticancer Ther. 12:229–242 [DOI] [PubMed] [Google Scholar]
- 9. Blechacz B, Splinter PL, Greiner S, Myers R, Peng KW, Federspiel MJ, Russell SJ, LaRusso NF. 2006. Engineered measles virus as a novel oncolytic viral therapy system for hepatocellular carcinoma. Hepatology 44:1465–1477 [DOI] [PubMed] [Google Scholar]
- 10. Peng KW, TenEyck CJ, Galanis E, Kalli KR, Hartmann LC, Russell SJ. 2002. Intraperitoneal therapy of ovarian cancer using an engineered measles virus. Cancer Res. 62:4656–4662 [PubMed] [Google Scholar]
- 11. Grote D, Russell SJ, Cornu TI, Cattaneo R, Vile R, Poland GA, Fielding AK. 2001. Live attenuated measles virus induces regression of human lymphoma xenografts in immunodeficient mice. Blood 97:3746–3754 [DOI] [PubMed] [Google Scholar]
- 12. Galanis E, Hartmann LC, Cliby WA, Long HJ, Peethambaram PP, Barrette BA, Kaur JS, Haluska PJ, Jr, Aderca I, Zollman PJ, Sloan JA, Keeney G, Atherton PJ, Podratz KC, Dowdy SC, Stanhope CR, Wilson TO, Federspiel MJ, Peng KW, Russell SJ. 2010. Phase I trial of intraperitoneal administration of an oncolytic measles virus strain engineered to express carcinoembryonic antigen for recurrent ovarian cancer. Cancer Res. 70:875–882 [DOI] [PMC free article] [PubMed] [Google Scholar]
- 13. Lech PJ, Russell SJ. 2010. Use of attenuated paramyxoviruses for cancer therapy. Expert Rev. Vaccines 9:1275–1302 [DOI] [PubMed] [Google Scholar]
- 14. Takeuchi O, Akira S. 2008. MDA5/RIG-I and virus recognition. Curr. Opin. Immunol. 20:17–22 [DOI] [PubMed] [Google Scholar]
- 15. Hornung V, Ellegast J, Kim S, Brzózka K, Jung A, Kato H, Poeck H, Akira S, Conzelmann KK, Schlee M, Endres S, Hartmann G. 2006. 5′-Triphosphate RNA is the ligand for RIG-I. Science 314:994–997 [DOI] [PubMed] [Google Scholar]
- 16. Schlee M, Roth A, Hornung V, Hagmann CA, Wimmenauer V, Barchet W, Coch C, Janke M, Mihailovic A, Wardle G, Juranek S, Kato H, Kawai T, Poeck H, Fitzgerald KA, Takeuchi O, Akira S, Tuschl T, Latz E, Ludwig J, Hartmann G. 2009. Recognition of 5′triphosphate by RIG-I helicase requires short blunt double-stranded RNA as contained in panhandle of negative-strand virus. Immunity 31:25–34 [DOI] [PMC free article] [PubMed] [Google Scholar]
- 17. Rehwinkel J, Tan CP, Goubau D, Schulz O, Pichlmair A, Bier K, Robb N, Vreede F, Barclay W, Fodor E, Reis e Sousa C. 2010. RIG-I detects viral genomic RNA during negative-strand RNA virus infection. Cell 140:397–408 [DOI] [PubMed] [Google Scholar]
- 18. Darnell JE, Jr, Kerr IM, Stark GR. 1994. Jak-STAT pathways and transcriptional activation in response to IFNs and other extracellular signaling proteins. Science 264:1415–1421 [DOI] [PubMed] [Google Scholar]
- 19. Childs K, Stock N, Ross C, Andrejeva J, Hilton L, Skinner M, Randall R, Goodbourn S. 2007. mda-5, but not RIG-I, is a common target for paramyxovirus V proteins. Virology 359:190–200 [DOI] [PubMed] [Google Scholar]
- 20. Childs KS, Andrejeva J, Randall RE, Goodbourn S. 2009. Mechanism of mda-5 inhibition by paramyxovirus V proteins. J. Virol. 83:1465–1473 [DOI] [PMC free article] [PubMed] [Google Scholar]
- 21. Radecke F, Spielhofer P, Schneider H, Kaelin K, Huber M, Dötsch C, Christiansen G, Billeter MA. 1995. Rescue of measles viruses from cloned cDNA. EMBO J. 14:5773–5784 [DOI] [PMC free article] [PubMed] [Google Scholar]
- 22. Seya T. 2011. Addendum to “Strain-to-strain difference of V protein of measles virus affects MDA5-mediated IFN-β-inducing potential” [Mol. Immunol. 48(4) (2011) 497–504]. Mol. Immunol. 48:1589–1590 [DOI] [PubMed] [Google Scholar]
- 23. Takaki H, Watanabe Y, Shingai M, Oshiumi H, Matsumoto M, Seya T. 2011. Strain-to-strain difference of V protein of measles virus affects MDA5-mediated IFN-β-inducing potential. Mol. Immunol. 48:497–504 [DOI] [PubMed] [Google Scholar]
- 24. Shingai M, Ebihara T, Begum NA, Kato A, Honma T, Matsumoto K, Saito H, Ogura H, Matsumoto M, Seya T. 2007. Differential type I IFN-inducing abilities of wild-type versus vaccine strains of measles virus. J. Immunol. 179:6123–6133 [DOI] [PubMed] [Google Scholar]
- 25. Childs K, Randall R, Goodbourn S. 2012. Paramyxovirus V proteins interact with the RNA helicase LGP2 to inhibit RIG-I-dependent interferon induction. J. Virol. 86:3411–3421 [DOI] [PMC free article] [PubMed] [Google Scholar]
- 26. Pfaller CK, Conzelmann KK. 2008. Measles virus V protein is a decoy substrate for IkappaB kinase alpha and prevents Toll-like receptor 7/9-mediated interferon induction. J. Virol. 82:12365–12373 [DOI] [PMC free article] [PubMed] [Google Scholar]
- 27. Caignard G, Guerbois M, Labernardière JL, Jacob Y, Jones LM, Infectious Mapping Project Wild I-MAPF. Tangy F, Vidalain PO. 2007. Measles virus V protein blocks Jak1-mediated phosphorylation of STAT1 to escape IFN-alpha/beta signaling. Virology 368:351–362 [DOI] [PubMed] [Google Scholar]
- 28. Ramachandran A, Parisien JP, Horvath CM. 2008. STAT2 is a primary target for measles virus V protein-mediated alpha/beta interferon signaling inhibition. J. Virol. 82:8330–8338 [DOI] [PMC free article] [PubMed] [Google Scholar]
- 29. Graepler F, Lemken ML, Wybranietz WA, Schmidt U, Smirnow I, Gross CD, Spiegel M, Schenk A, Graf H, Lauer UA, Vonthein R, Gregor M, Armeanu S, Bitzer M, Lauer UM. 2005. Bifunctional chimeric SuperCD suicide gene–YCD: YUPRT fusion is highly effective in a rat hepatoma model. World J. Gastroenterol. 11:6910–6919 [DOI] [PMC free article] [PubMed] [Google Scholar]
- 30. Erbs P, Regulier E, Kintz J, Leroy P, Poitevin Y, Exinger F, Jund R, Mehtali M. 2000. In vivo cancer gene therapy by adenovirus-mediated transfer of a bifunctional yeast cytosine deaminase/uracil phosphoribosyltransferase fusion gene. Cancer Res. 60:3813–3822 [PubMed] [Google Scholar]
- 31. Longley DB, Harkin DP, Johnston PG. 2003. 5-Fluorouracil: mechanisms of action and clinical strategies. Nat. Rev. Cancer 3:330–338 [DOI] [PubMed] [Google Scholar]
- 32. Zaoui K, Bossow S, Grossardt C, Leber MF, Springfeld C, Plinkert PK, Kalle C, Ungerechts G. 2012. Chemovirotherapy for head and neck squamous cell carcinoma with EGFR-targeted and CD/UPRT-armed oncolytic measles virus. Cancer Gene Ther. 19:181–191 doi:10.1038/cgt.2011.75 [DOI] [PubMed] [Google Scholar]
- 33. Kärber G. 1931. Beitrag zur kollektiven Behandlung pharmakologischer Reihenversuche. Naunyn-Schmiedeberg′s Arch. Pharmacol. 162:480–483 [Google Scholar]
- 34. Spearman C. 1908. The method of “right and wrong cases” (“constant stimuli”) without Gauss's formulae. Br. J. Psychol. 2:227–242 doi:10.1111/j.2044–8295.1908.tb00176.x [Google Scholar]
- 35. Anderson BD, Nakamura T, Russell SJ, Peng KW. 2004. High CD46 receptor density determines preferential killing of tumor cells by oncolytic measles virus. Cancer Res. 64:4919–4926 [DOI] [PubMed] [Google Scholar]
- 36. Pfaffl MW. 2001. A new mathematical model for relative quantification in real-time RT-PCR. Nucleic Acids Res. 29:e45. [DOI] [PMC free article] [PubMed] [Google Scholar]
- 37. Reiser J, Hurst J, Voges M, Krauss P, Münch P, Iftner T, Stubenrauch F. 2011. High-risk human papillomaviruses repress constitutive kappa interferon transcription via E6 to prevent pathogen recognition receptor and antiviral-gene expression. J. Virol. 85:11372–11380 [DOI] [PMC free article] [PubMed] [Google Scholar]
- 38. Berghäll H, Sirén J, Sarkar D, Julkunen I, Fisher PB, Vainionpää R, Matikainen S. 2006. The interferon-inducible RNA helicase, mda-5, is involved in measles virus-induced expression of antiviral cytokines. Microbes Infect. 8:2138–2144 [DOI] [PubMed] [Google Scholar]
- 39. Ikegame S, Takeda M, Ohno S, Nakatsu Y, Nakanishi Y, Yanagi Y. 2010. Both RIG-I and MDA5 RNA helicases contribute to the induction of alpha/beta interferon in measles virus-infected human cells. J. Virol. 84:372–379 [DOI] [PMC free article] [PubMed] [Google Scholar]
- 40. Plumet S, Herschke F, Bourhis JM, Valentin H, Longhi S, Gerlier D. 2007. Cytosolic 5′triphosphate ended viral leader transcript of measles virus as activator of the RIG I-mediated interferon response. PLoS One 2:e279 doi:10.1371/journal.pone.0000279 [DOI] [PMC free article] [PubMed] [Google Scholar]
- 41. Fensterl V, Sen GC. 2011. The ISG56/IFIT1 gene family. J. Interferon Cytokine Res. 31:71–78 [DOI] [PMC free article] [PubMed] [Google Scholar]
- 42. Wang C, Pflugheber J, Sumpter R, Jr, Sodora DL, Hui D, Sen GC, Gale M., Jr 2003. Alpha interferon induces distinct translational control programs to suppress hepatitis C virus RNA replication. J. Virol. 77:3898–3912 [DOI] [PMC free article] [PubMed] [Google Scholar]
- 43. Terenzi F, Saikia P, Sen GC. 2008. Interferon-inducible protein, P56, inhibits HPV DNA replication by binding to the viral protein E1. EMBO J. 27:3311–3321 [DOI] [PMC free article] [PubMed] [Google Scholar]
- 44. Pichlmair A, Lassnig C, Eberle CA, Górna MW, Baumann CL, Burkard TR, Bürckstümmer T, Stefanovic A, Krieger S, Bennett KL, Rülicke T, Weber F, Colinge J, Müller M, Superti-Furga G. 2011. IFIT1 is an antiviral protein that recognizes 5′-triphosphate RNA. Nat. Immunol. 12:624–630 doi:10.1038/ni.2048 [DOI] [PubMed] [Google Scholar]
- 45. Liikanen I, Monsurrò V, Ahtiainen L, Raki M, Hakkarainen T, Diaconu I, Escutenaire S, Hemminki O, Dias JD, Cerullo V, Kanerva A, Pesonen S, Marzioni D, Colombatti M, Hemminki A. 2011. Induction of interferon pathways mediates in vivo resistance to oncolytic adenovirus. Mol. Ther. 19:1858–1866 doi:10.1038/mt.2011.144 [DOI] [PMC free article] [PubMed] [Google Scholar]
- 46. Gentschev I, Adelfinger M, Josupeit R, Rudolph S, Ehrig K, Donat U, Weibel S, Chen NG, Yu YA, Zhang Q, Heisig M, Thamm D, Stritzker J, Macneill A, Szalay AA. 2012. Preclinical evaluation of oncolytic vaccinia virus for therapy of canine soft tissue sarcoma. PLoS One 7:e37239 doi:10.1371/journal.pone.0037239 [DOI] [PMC free article] [PubMed] [Google Scholar]
- 47. Springfeld C, von Messling V, Frenzke M, Ungerechts G, Buchholz CJ, Cattaneo R. 2006. Oncolytic efficacy and enhanced safety of measles virus activated by tumor-secreted matrix metalloproteinases. Cancer Res. 66:7694–7700 [DOI] [PubMed] [Google Scholar]


