Abstract
Hydrogenogenic CO oxidation (CO + H2O → CO2 + H2) has the potential for H2 production as a clean renewable fuel. Thermococcus onnurineus NA1, which grows on CO and produces H2, has a unique gene cluster encoding the carbon monoxide dehydrogenase (CODH) and the hydrogenase. The gene cluster was identified as essential for carboxydotrophic hydrogenogenic metabolism by gene disruption and transcriptional analysis. To develop a strain producing high levels of H2, the gene cluster was placed under the control of a strong promoter. The resulting mutant, MC01, showed 30-fold-higher transcription of the mRNA encoding CODH, hydrogenase, and Na+/H+ antiporter and a 1.8-fold-higher specific activity for CO-dependent H2 production than did the wild-type strain. The H2 production potential of the MC01 mutant in a bioreactor culture was 3.8-fold higher than that of the wild-type strain. The H2 production rate of the engineered strain was severalfold higher than those of any other CO-dependent H2-producing prokaryotes studied to date. The engineered strain also possessed high activity for the bioconversion of industrial waste gases created as a by-product during steel production. This work represents the first demonstration of H2 production from steel mill waste gas using a carboxydotrophic hydrogenogenic microbe.
INTRODUCTION
Carbon monoxide (CO) is highly toxic to most living creatures, but it can be utilized by microorganisms as an energy and carbon source for the production of fuels and chemicals, such as acetate, butyrate, ethanol, butanol, and H2. Among those carboxydotrophic microbes, CO-dependent H2 production has been observed in three distinct groups, i.e., mesophilic bacteria, thermophilic bacteria, and hyperthermophilic archaea (1–3). Generally, growth rates of the mesophilic hydrogenogenic bacteria on CO are low, and high levels of CO are inhibitory. Predominant within this group are nonsulfur purple bacteria, including Rubrivivax gelatinosus and Rhodospirillum rubrum, which require light for optimal cell growth. Although Rhodopseudomonas palustris P4 is capable of hydrogenogenic CO conversion in the dark, it does not grow under this condition (4). Nonphototrophic Citrobacter strain Y19 also converts CO to H2, but it only grows slowly under anaerobic conditions and an aerobic growth phase is required to generate sufficient biomass before the anaerobic CO conversion phase (5). The second group includes thermophilic, hydrogenogenic bacteria isolated from freshwater and marine environments with temperatures ranging from 40 to 85°C. Carboxydothermus hydrogenoformans, Carboxydocella thermautotrophica, Thermosinus carboxydivorans, and Caldanaerobacter subterraneus subsp. pacificus are capable of chemolithotrophic growth on high concentrations of CO. The third group includes two hydrogenogenic CO-converting archaea, Thermococcus sp. strain AM4 and Thermococcus onnurineus NA1 (6, 7). Both strains are hyperthermophiles isolated from deep-sea hydrothermal vents and can grow on 100% CO (8).
Anaerobic carboxydotrophic hydrogenogenic prokaryotes conserve energy by performing the following well-known water-gas shift reaction: CO + H2O → CO2 + H2 (ΔG°′ = −20 kJ/mol) (33). In this metabolism, CO is oxidized by a carbon monoxide dehydrogenase (CODH) and electrons are transferred to an energy-converting hydrogenase that reduces protons to H2. These enzymatic systems have been studied most extensively in R. rubrum and C. hydrogenoformans (9–11). In these organisms, the enzymes are encoded by a gene cluster comprised of a CODH gene (cooS), a ferredoxin-like protein gene (cooF), genes for a six-subunit hydrogenase, and genes encoding accessory proteins. Thermococcus barophilus MP is also likely to possess the capacity for hydrogenogenic carboxydotrophy due to the presence of a gene cluster with close similarity to those from two Thermococcus strains mentioned above (12). The three gene clusters in Thermococcus strains are distinguished from those in mesophilic or thermophilic bacteria by the presence of genes encoding Na+/H+ antiporter (see Fig. S1 in the supplemental material).
The hydrogenogenic CO-converting reaction has a potential application in the production of H2 gas as a clean renewable fuel from waste gases or synthesis gas (syngas). Syngas is a mixture of mainly H2, CO, CO2, N2, and CH4, produced by partial oxidation or autothermal reforming of hydrocarbon-rich fossil fuels, domestic and agricultural wastes, and other biomass. Biological processes, while slower than chemical reactions, have a number of advantages such as higher yields, specificity, requirement of minimum energy due to lower operating temperatures and pressures, and lower cost (13). Bioconversion of syngas to H2 was investigated in R. rubrum (14–16). Producer syngas had no negative effect on growth rates, biomass production, H2 production, or CO consumption (17). Industrial waste gases created as a by-product during steel production could be an attractive source of CO and have been targeted for the production of both ethanol and 2,3-butanediol using acetogenic bacteria (18, 19). So far, however, this application has not been reported using carboxydotrophic hydrogenogenic microbes.
Over the years, numerous studies have been performed to improve the H2 productivity from CO with regard to selecting strains resistant to CO toxicity and stimulating CO gas-liquid mass transfer rates (16, 20, 21). In the present study, a different approach to increase the H2 productivity was examined. The expression of the CODH gene cluster was upregulated. This experiment took advantage of the recently developed genetic system in T. onnurineus NA1 (22). Here, we identify the CODH gene cluster responsible for hydrogenogenic CO-converting activity. The strain constructed to overproduce the CODH-hydrogenase enzyme complex possessed higher H2 productivity than did the wild-type strain. Using the engineered strain, the potential of H2 production from steel mill waste gas was investigated for the first time.
MATERIALS AND METHODS
Strain, media, and culture conditions.
T. onnurineus NA1 (KCTC 10859) was isolated from a deep-sea hydrothermal vent area in the Papua New Guinea-Australia-Canada-Manus (PACMANUS) field (23). This strain was routinely cultured in YPS (yeast extract-peptone-sulfur) medium as previously reported (23).
The modified medium 1 (MM1) (7, 22) was prepared with 1 g liter−1 yeast extract, 35 g liter−1 NaCl, 0.7 g liter−1 KCl, 3.9 g liter−1 MgSO4, 0.4 g liter−1 CaCl2·2H2O, 0.3 g liter−1 NH4Cl, 0.15 g liter−1 Na2HPO4, 0.03 g liter−1 NaSiO3, 0.5 g liter−1 NaHCO3, 0.5 g liter−1 cysteine-HCl, and 0.001 g liter−1 resazurin. One milliliter liter−1 of Holden's trace element–Fe-EDTA solution (24) and 1 ml liter−1 of Balch's vitamin solution (25) were added as a supplement to the medium. After autoclaving, the medium was kept in an anaerobic chamber (Coy Laboratory Products, Grass Lake, MI) filled with an anoxic gas mixture (N2:H2:CO2, 90:5:5) to equilibrate, and the final pH of the medium was adjusted to 6.5 with 2 N HCl.
For the cultures in serum bottles, the media were reduced with 0.005% Na2S·9H2O, and the headspaces were filled with 100% CO (MM1-CO). The serum bottles were sealed with bromobutyl rubber stoppers and aluminum crimp caps.
For the pH-stat batch culture, T. onnurineus strain NA1 was serially cultured in a 100-ml serum bottle and 3-liter bioreactors (Fermentec, Cheongwon, South Korea), the working volumes of which were 50 ml and 2 liters, respectively, at 80°C. For the cultures in bioreactors, MM1 was supplemented with 10 g liter−1 yeast extract and 10 times more Holden's trace element–Fe-EDTA solution. The bioreactors were sparged with pure argon gas (99.999%) through a microsparger. The agitation speed was 300 rpm, and the pH was controlled at 6.1 to 6.2 using 0.2 M NaOH in 3.5% NaCl. The inlet gas of 100% CO was supplied by using a mass flow controller (MKPrecision, Seoul, South Korea) at feeding rates in the range of 40 to 400 ml min−1. The steel mill waste gas (composition, 57.4% CO, 25.9% N2, 13.9% CO2, and 2.8% H2; collected from a Linz-Donawitz gas [LDG] furnace in a Hyundai Steel plant in Dangjin, South Korea) was used for bioreactor cultures at rates of 60 or 180 ml min−1. The gas outlet was open to let the H2 and CO2 gases escape and maintain the total pressure at 105 Pa.
Analytical methods.
Cell growth was monitored by measuring optical density at 600 nm (OD600) with a biophotometer plus a UV-visible spectrophotometer (Eppendorf, Hamburg, Germany). Biomass was determined by measuring the amount of cellular proteins of cell lysates using the DC protein assay kit (Bio-Rad, Hercules, CA) based on the assumption that protein comprises approximately 50% of dry cell weight (DCW) (26). The unit value of OD600 corresponded to 0.361 g (DCW) liter−1. The H2 production rate was calculated on the basis of H2 content in the gases produced from a bioreactor, and the gas flow rate was measured with a wet gas meter (Shinagawa, Tokyo, Japan).
The amounts of CO, H2, and CO2 were measured by using a YL6100 gas chromatograph (GC) (YL Instrument Co., Anyang, South Korea) equipped with a Molsieve 5A column (Supelco, Bellefonte, PA), a Porapak N column (Supelco), a thermal conductivity detector, and a flame ionization detector. Argon was used as the carrier gas at a flow rate of 30 ml min−1.
DNA microarray analysis.
A custom microarray was manufactured by Roche NimbleGen (Basel, Switzerland). Six unique 60-mer oligonucleotides for all of the predicted 1,986 open reading frames (ORFs) in the annotated genome of T. onnurineus NA1 were designed and synthesized. Isolation of mRNA, labeling, and hybridization were performed as described previously (22). After hybridization, arrays were scanned with a GenePix 4000B scanner (Molecular Devices), and the data were extracted using NimbleScan 2.4 software (Roche NimbleGen, Basel, Switzerland). Data analysis was performed using GeneSpring GX 7.3.1 (Agilent Technologies, Palo Alto, CA).
Reverse transcription-PCR (RT-PCR).
cDNAs were synthesized from 350 ng of total RNA using SuperScript II reverse transcriptase, and PCRs were performed with gene-specific primers using rTaq DNA polymerase (TaKaRa, Otsu, Japan) (see Table S1 in the supplemental material). Expression levels were calculated using GelPro32 software (Media Cybernetics, Bethesda, MD) using a chaperonin-encoding gene (cha, TON_1276) as a control to normalize expression levels.
Quantitative reverse transcription-PCR (RT-qPCR).
RNA was prepared with TRIzol reagent (Invitrogen, Carlsbad, CA) according to the manufacturer's instructions with some modifications. Genomic DNA was eliminated by DNase I (Thermo Scientific Fermentas, St. Leon-Rot, Germany) treatment. One microgram of RNA was incubated with 1 unit of DNase I at 37°C for 30 min and purified through chloroform extraction and ethanol precipitation. RNA was quantified with a spectrophotometer, and cDNA was created using Moloney murine leukemia virus (M-MuLV) reverse transcriptase (Thermo Scientific Fermentas, St. Leon-Rot, Germany). One microgram of RNA was incubated with 40 units of reverse transcriptase, 5 μM random hexamers, and 1 mM deoxynucleoside triphosphate (dNTP) at 37°C for 1 h in reverse transcription buffer (1×, as supplied by the enzyme manufacturer). The reaction products were serially diluted to find the adequate concentration for real-time PCR analysis, and the samples were amplified with SYBR green real-time PCR master mix (Toyobo, Osaka, Japan). Amplified signals were detected using the StepOnePlus system (Applied Biosystems, Foster City, CA), and all primers used were as listed in Table S1 in the supplemental material. The relative amount of each gene was calculated from cycle threshold (CT) values using a relative standard curve after normalization with corresponding 16S rRNA (TON_1979) quantity.
Gene disruption.
Mutants of each large subunit of mfh2 (TON_1569) and mch (TON_1023) hydrogenases and the MC01 (TON_1016) mutant were constructed by applying the gene disruption system used for a hyperthermophilic archaeon, Thermococcus kodakarensis KOD1 (27). Briefly, target genes were replaced with the Pgdh-hmgPfu cassette through homologous recombination. T. onnurineus NA1 cells were transformed and incubated in the presence of 10 μM simvastatin as a selection marker. The sequences of the primers used for gene disruption and construct verification are given in Table S1 in the supplemental material.
Western blotting.
Western blots were prepared and analyzed using a chemiluminescent dye with the Immun-Star horseradish peroxidase (HRP) chemiluminescent kit (Bio-Rad, Hercules, CA). Antibodies were generated against each protein encoded by TON_1018 and TON_1023, which were overexpressed in Escherichia coli Rosetta(DE3)pLysS cells (Stratagene, La Jolla, CA) and purified through His-Bind resin (Novagen, Madison, WI).
Measurement of H2 production activity.
Cell lysates of the wild-type strain and the MC01 mutant were prepared by sonication of exponentially growing cells (0.097 g, wet weight) in 2 ml of 50 mM Tris-HCl buffer (pH 7.5) containing 5 mM MgSO4, 10% glycerol, 2 mM dithiothreitol, and a protease inhibitor cocktail tablet (Roche Applied Science, Madison, WI) and then centrifugation at 14,000 × g for 20 min to remove cell debris. Samples were resuspended in 40 mM imidazole buffer (pH 6.5) containing 600 mM NaCl, 30 mM MgCl2. 10 mM KCl, and 2 mM dithiothreitol at a concentration of 0.1 mg ml−1. The assay was carried out in glass vials, which were filled with 100% CO at 105 Pa and sealed with bromobutyl rubber stoppers. The amounts of CO, H2, and CO2 were measured by using a gas chromatograph (GC).
RESULTS AND DISCUSSION
CODH gene cluster responsible for carboxydotrophic hydrogenogenic metabolism.
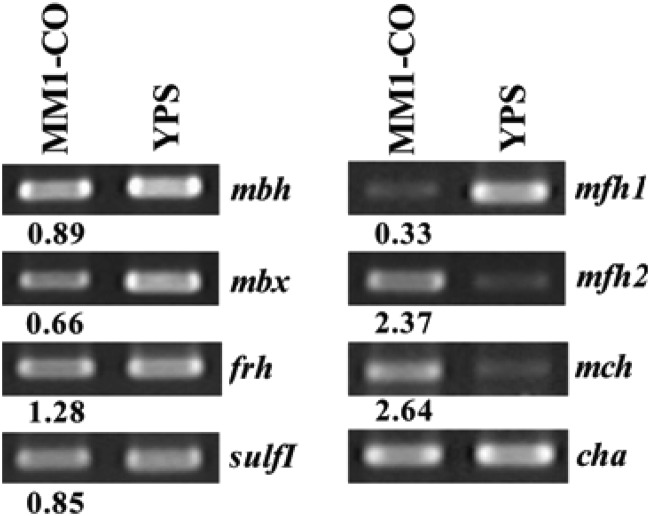
It was postulated that the CODH gene cluster would play a key role in the carboxydotrophic hydrogenogenic metabolism in T. onnurineus NA1. To identify the hydrogenase gene cluster(s) for CO-dependent H2 production, a DNA microarray was used to profile the gene expression of several distinct gene clusters encoding seven [NiFe]-hydrogenases (mbh, sulfI, sulfII, mfh1, mfh2, mch, and frh) and one homolog similar to Mbx (membrane-bound oxidoreductase, mbx). Relative expression ratios were derived by comparing mRNA abundance levels in cells grown in a medium containing CO (MM1-CO medium) to those in cells grown in a sulfur-containing complex medium (YPS medium). While transcript levels of most genes remained constant (fold change in expression of 0.5 to 2) or downregulated (fold change of <0.5), four to 10 out of 16 genes in the CODH gene cluster (TON_1016–1031) were upregulated more than 2-fold, depending on the concentration of yeast extract (see Fig. S2 in the supplemental material). Interestingly, a few genes (two to four out of 18) in the mfh2 gene cluster (TON_1563-1580) were also upregulated. The expression pattern in the DNA microarray data was validated by reverse transcription-PCR (RT-PCR), showing upregulation (fold change of >2) of two genes encoding the large subunits of the mch and mfh2 hydrogenases (TON_1023 and TON_1569) (Fig. 1). It is very intriguing that the expression level of the mfh2 gene cluster was increased in the presence of CO, because the cluster had been identified previously as being responsible for growth on exogenous formate (22).
Fig 1.
Expression analysis of T. onnurineus NA1 hydrogenase gene clusters by RT-PCR on MM1-CO. RT-PCR analysis of each large subunit of mbh (TON_1593), mbx (TON_0489), frh (TON_1560), sulfI (TON_0534), mch (TON_1023), mfh2 (TON_1569), and mfh1 (TON_0276) hydrogenases was performed with samples grown on MM1-CO with 0.5 g liter−1 of yeast extract and YPS medium. cha, a chaperonin-encoding gene, was used as a control to normalize the expression level. The numbers under PCR bands represent band intensities relative to those on YPS medium.
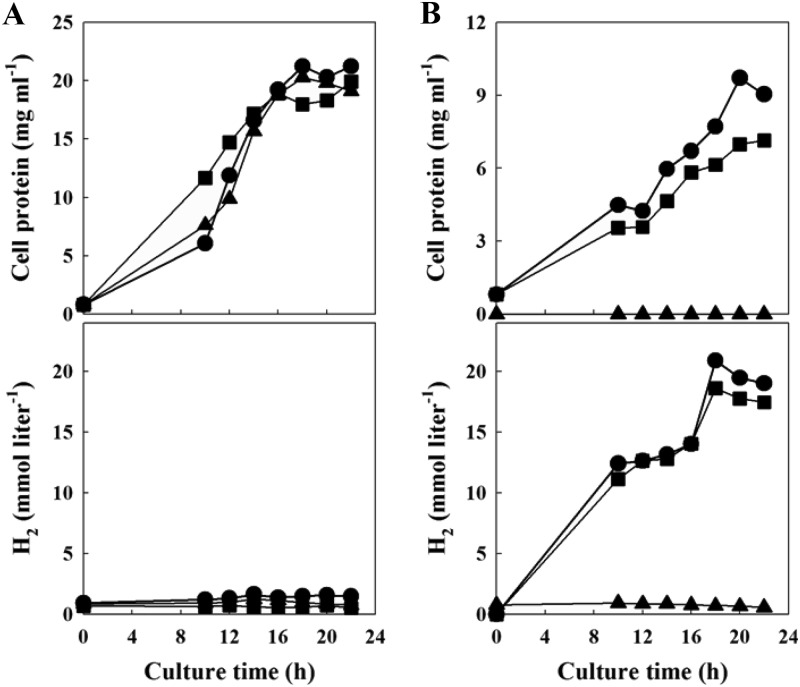
The relative importance of the mch gene cluster for growth on CO was assessed by gene disruption of the large subunits of the mch and mfh2 hydrogenases (see Fig. S3 in the supplemental material). The growth of Δmch and Δmfh2 mutants closely resembled the growth of the wild-type strain in YPS medium, so they seemed to be dispensable under this condition (Fig. 2A). However, in MM1-CO, the Δmch mutant showed a phenotype of severely impaired CO-dependent growth and H2 production, which made it distinct from the Δmfh2 mutant (Fig. 2B). This observation indicated that the mch gene was essential for carboxydotrophic hydrogenogenic metabolism in T. onnurineus NA1.
Fig 2.
Growth (top) and H2 production (bottom) of wild-type (circles), Δmch (triangles), and Δmfh2 (squares) strains on YPS medium (A) and MM1-CO with 0.5 g liter−1 of yeast extract (B).
Overexpression of CODH gene cluster by promoter modulation.
Because the CODH gene cluster is intimately related to CO-dependent H2 production, the gene cluster was overexpressed in an attempt to improve H2 production from CO. In order to overexpress the CODH gene cluster, a strong constitutive promoter (Pgdh), which drives expression of the gene encoding the glutamate dehydrogenase in Thermococcus kodakarensis, was inserted in front of the CODH gene cluster with a 3-hydroxy-3-methylglutaryl coenzyme A (HMG-CoA) reductase gene in Pyrococcus furiosus as a selection marker, substituting for the putative transcriptional regulator (TON_1016) (see Fig. S3 in the supplemental material).
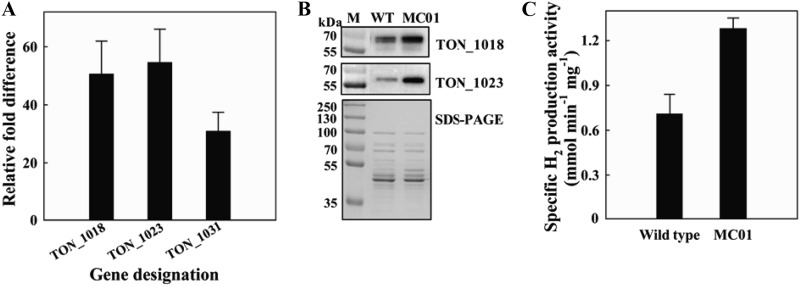
Quantitative reverse transcription-PCR (RT-qPCR) showed that the levels of transcripts for TON_1018, TON_1023, and TON_1031 encoding subunits of CODH, hydrogenase, and Na+/H+ antiporter, respectively, were 51.3-, 53.8-, and 31.5-fold higher in the engineered strain (MC01) than in the wild-type strain, in which transcription of the CODH gene cluster is controlled by the native promoter (Fig. 3A).
Fig 3.
Expression levels of genes in a codh-mch-mnh3 gene cluster of the MC01 mutant on MM1-CO. (A) The mRNA quantity of three genes (TON_1018, TON_1023, and TON_1031) of the wild-type strain and the MC01 mutant was measured by RT-qPCR and indicated as fold difference from the value of the wild-type strain, which is taken as 1. Error bars indicate the standard deviations from three independent experiments. (B) Western blot analysis of proteins encoded by TON_1018 (67.7 kDa) and TON_1023 (61.7 kDa). M, molecular mass marker; WT, wild-type strain. (C) H2 production activity of cell lysates of the wild-type strain and MC01 mutant. Error bars indicate the standard deviations from three independent experiments.
The expression level of proteins in the CODH gene cluster was monitored by Western blotting using polyclonal antibodies specific for the TON_1018 and TON_1023 proteins. The amounts of those proteins significantly increased in the MC01 mutant compared with the wild-type strain (Fig. 3B). In the MC01 mutant, the large subunit of mch hydrogenase (TON_1023) was shown to be present exclusively in its mature form as the proteins migrated in a manner identical to that of proteins in the wild-type strain and migrated faster than its precursor form (see Fig. S4 in the supplemental material).
The significantly increased CODH and Mch hydrogenase in the MC01 mutant might lead to an increased CO oxidation and hydrogenase activity. To corroborate this, cell lysates of the wild-type strain and the mutant were prepared, and the H2 production activity was assayed based on the CO-dependent proton reduction activity. The specific H2 production activity of the MC01 mutant was 1.8-fold higher than that of the wild-type strain (Fig. 3C).
Measurement of growth and H2 production.
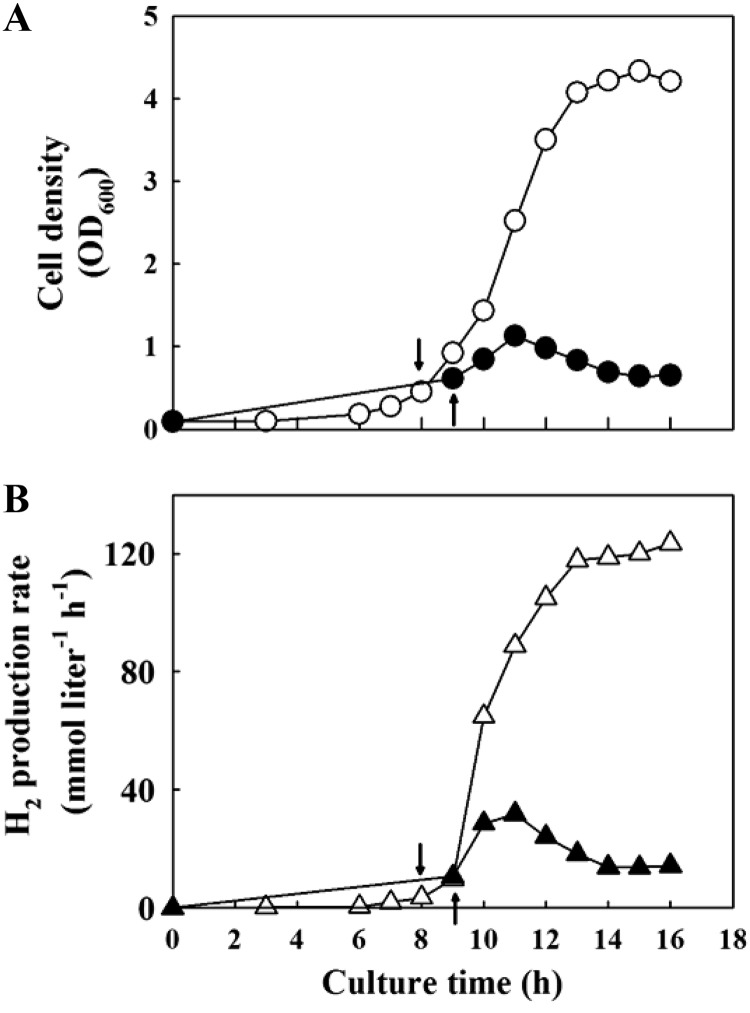
Based on the increased enzymatic activity for CO-dependent H2 formation of the MC01 mutant, the H2 production potential of the strain was then tested in a bioreactor where 100% CO was continuously fed with a flow rate of 240 ml min−1. The mutant might be expected to lead to an increased H2 production and perhaps an increase in cell yield. When the growth rates of the two strains were compared, the MC01 mutant grew significantly better than the wild-type strain with a 3.8-fold increase in maximum biomass yield (Fig. 4A). Furthermore, the H2 production rates of the MC01 mutant were higher than those of the wild-type strain, with a maximum rate of 123.5 mmol liter−1 h−1 for the mutant and 31.8 mmol liter−1 h−1 for the wild-type strain (Fig. 4B). Table 1 summarizes the kinetic parameters for the two strains. The maximum specific growth rate, biomass productivity, H2 productivity, and H2 yield coefficient with respect to biomass were also 2- to 4-fold higher for the mutant than for the wild-type strain. However, the molar ratios of H2 and CO2 produced with respect to CO consumed during cultures were constant at about 1:1:1 for both strains.
Fig 4.
Growth (A) and H2 production (B) of wild-type strain (closed symbols) and MC01 mutant (open symbols) in a 3-liter bioreactor with CO supplied at 240 ml min−1 of flow rate. Cell growth was monitored by measuring optical density at 600 nm (OD600). The initial CO flow rate of 20 ml min−1 was raised to 240 ml min−1 when the OD600 reached about 0.3, as indicated by arrows.
Table 1.
Kinetic parameters between wild-type strain and MC01 mutant
| Kinetic parametera | Wild type | MC01 mutant | Fold difference |
|---|---|---|---|
| μmax (h−1) | 0.31 | 0.72 | 2.3 |
| rmax (mmol liter−1 h−1) | 31.8 | 123.5 | 3.9 |
| qmax (mmol g−1 h−1) | 93.4 | 194.7 | 2.1 |
| Biomass productivity (g liter−1 h−1)b | 0.09 | 0.23 | 2.6 |
| H2 productivity (mmol liter−1 h−1)b | 30.2 | 102.6 | 3.4 |
| Yp/x (g H2 g−1 biomass) | 0.32 | 0.9 | 2.8 |
| CO:H2:CO2 (mol:mol:mol) | 1:1.04:1 | 1:1.07:1 | 1.0 |
Kinetic parameters were calculated with data from graphs in Fig. 4. μmax, maximum specific growth rate; rmax, maximum H2 production rate; qmax, maximum specific H2 production rate; Yp/x, product yield coefficient with respect to biomass.
Productivity was determined by dividing total yield by time difference from 9 to 11 h for the wild-type strain and from 8 to 14 h for the mutant.
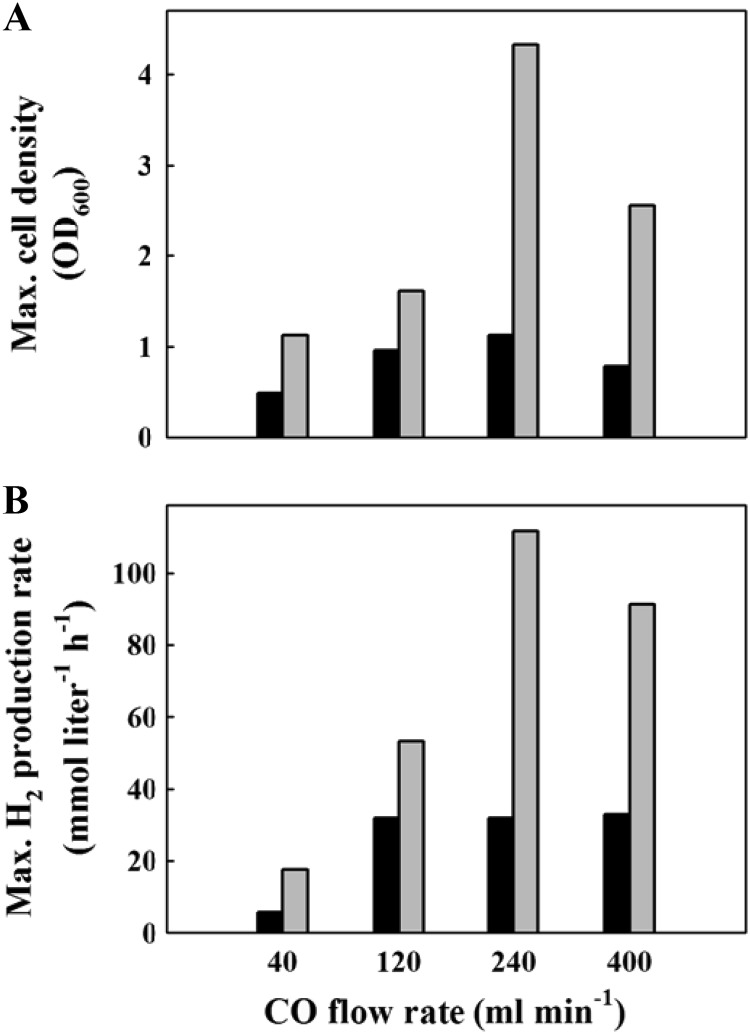
CO acts as both a substrate and an inhibitor in CO metabolism and at elevated concentrations can inhibit growth and catabolic activity due to its high affinity for metal-containing enzymes and hemes (28). To investigate the effect of CO content on the growth and H2 production of the two strains, bioreactor cultures were supplied with CO at flow rates in the range of 40 to 400 ml min−1. Depending on the flow rates, the mutant consumed 27 to 37% of CO while the wild-type strain consumed 9.5 to 11% of CO during exponential growth phase (data not shown). The mutant showed 1.7- to 3.8-fold-higher values than the wild-type strain for maximum H2 production rate and maximum cell density (Fig. 5; see also Fig. S5 in the supplemental material). On the whole, as the CO flow rate was increased up to 240 ml min−1, the H2 production and cell density increased for both strains. On the other hand, at a CO flow rate of 400 ml min−1, the cell density was decreased to about 60 to 70% of the values at 240 ml min−1 for both strains, indicating that the growth was inhibited by CO. However, considering that the H2 production rate was decreased only 20% for the mutant and maintained for the wild-type strain in comparison with the values at a CO flow rate of 240 ml min−1, CO metabolism does not seem to be inhibited by CO (Fig. 5).
Fig 5.
The effect of CO flow rate on the growth (A) and H2 production (B) of the wild-type strain (black bars) and the MC01 mutant (gray bars) in a 3-liter bioreactor. Cell growth was monitored by measuring optical density at 600 nm (OD600).
It is worthy of note that the MC01 mutant showed the highest H2 production rate and specific H2 production rate among the CO-dependent H2-producing prokaryotes, to the best of our knowledge (Table 2).
Table 2.
H2 production rates of various carboxydotrophic hydrogenogenic microbes
| Organism | Cultivation method | H2 production rate (mmol liter−1 h−1)a | Specific H2 production rate (mmol g−1 h−1)a | Reference |
|---|---|---|---|---|
| T. onnurineus NA1 (MC01) | Batch | 123.5b | 194.7b | This study |
| T. onnurineus NA1 (wild type) | Batch | 32.9b | 151.3b | This study |
| Rhodopseudomonas palustris P4 | Batch | 41 | 41 | 29 |
| Citrobacter sp. strain Y19 | Batch | 5.7 | 27.1 | 30 |
| Rhodospirillum rubrum | Continuous | 4.7 | 11 | 31 |
| Rubrivivax gelatinosus CBS-2 | Continuous | 2.7 | 1.3–33 | 32 |
Kinetic parameters were calculated with data from graphs in Fig. S5 in the supplemental material. The unit gram represents dry cell weight.
The values were calculated from data obtained in a bioreactor where 100% CO was continuously fed with a flow rate of 240 ml min−1 (MC01 strain) and 400 ml min−1 (wild-type strain).
H2 production from steel mill waste gas.
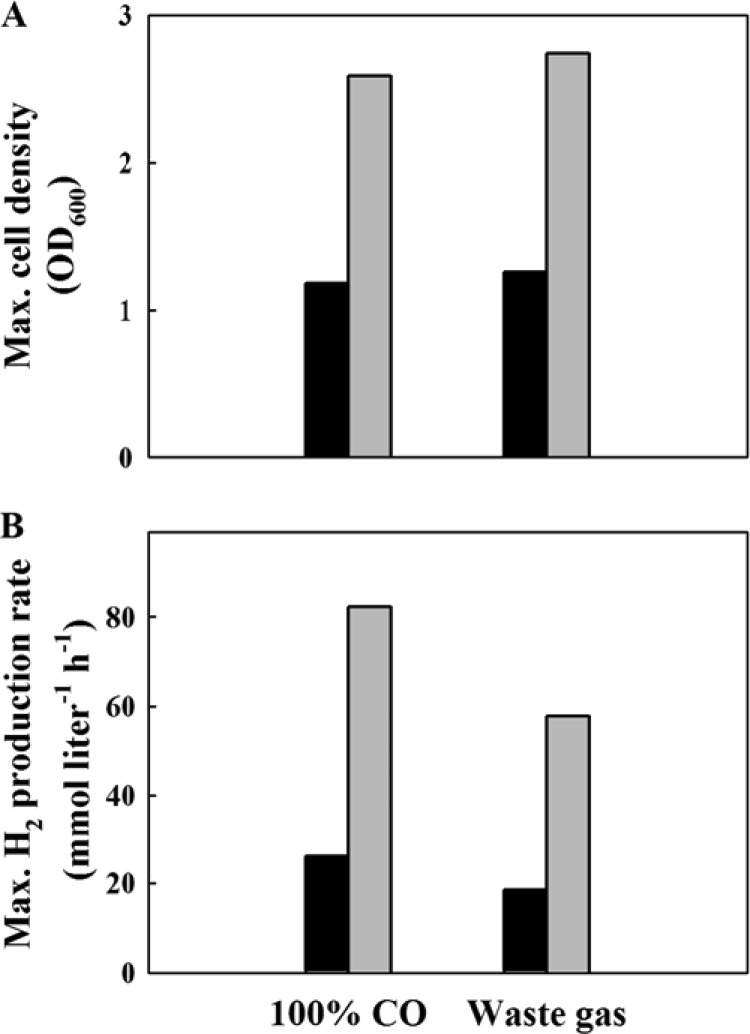
H2 production by MC01 from waste gas, obtained as a by-product in the steel industry, was investigated. The increases of cell density and H2 production rate were observed for both flow rates of waste gas, 60 and 180 ml min−1 (see Fig. S6 in the supplemental material). The maximum H2 production rate and the maximum cell densities (OD600) increased almost linearly with respect to the flow rate of waste gas. When 100% CO and waste gas were compared as CO suppliers at the same flow rates, the maximum cell densities were not much affected (Fig. 6A), but the maximum H2 production rates were reduced about 30% by waste gas (Fig. 6B). The lower content of CO (57.4%) in waste gas might explain the result to some extent because the H2 production rate was positively correlated with the content of CO (see Fig. S7 in the supplemental material).
Fig 6.
Comparison of the growth (A) and H2 production (B) of the MC01 mutant cultured on steel mill waste gas supplied at flow rates of 60 (black bars) or 180 (gray bars) ml min−1 in a 3-liter bioreactor. The maximum cell densities and maximum H2 production rates of the MC01 mutant were estimated by regression of plots in Fig. 5.
In conclusion, the expression level of the CODH gene cluster involving CO-dependent H2 production was modulated by insertion of a strong promoter and could achieve highly enhanced H2 production from CO in T. onnurineus NA1. Waste gas from the steel industry is likely to be a potential substrate for H2 production.
ACKNOWLEDGMENTS
This work was supported by the KIOST in-house program, the Marine and Extreme Genome Research Centre, and the Development of Biohydrogen Production Technology Using the Hyperthermophilic Archaea program of the Ministry of Land, Transport, and Maritime Affairs in the Republic of South Korea.
We thank Hyundai Steel Corporation (G. Y. Kim) for providing steel mill waste gas.
Footnotes
Published ahead of print 18 January 2013
Supplemental material for this article may be found at http://dx.doi.org/10.1128/AEM.03298-12.
REFERENCES
- 1. Oelgeschlager E, Rother M. 2008. Carbon monoxide-dependent energy metabolism in anaerobic bacteria and archaea. Arch. Microbiol. 190:257–269 [DOI] [PubMed] [Google Scholar]
- 2. Sokolova TG, Henstra AM, Sipma J, Parshina SN, Stams AJ, Lebedinsky AV. 2009. Diversity and ecophysiological features of thermophilic carboxydotrophic anaerobes. FEMS Microbiol. Ecol. 68:131–141 [DOI] [PubMed] [Google Scholar]
- 3. Techtmann SM, Colman AS, Robb FT. 2009. ‘That which does not kill us only makes us stronger’: the role of carbon monoxide in thermophilic microbial consortia. Environ. Microbiol. 11:1027–1037 [DOI] [PubMed] [Google Scholar]
- 4. Jung GY, Jung HO, Kim JR, Ahn Y, Park S. 1999. Isolation and characterization of Rhodopseudomonas palustris P4 which utilizes CO with the production of H2. Biotechnol. Lett. 21:525–529 [Google Scholar]
- 5. Jung GY, Kim JR, Jung HO, Park JY, Park S. 1999. A new chemoheterotrophic bacterium catalyzing water-gas shift reaction. Biotechnol. Lett. 21:869–873 [Google Scholar]
- 6. Lee HS, Kang SG, Bae SS, Lim JK, Cho Y, Kim YJ, Jeon JH, Cha SS, Kwon KK, Kim HT, Park CJ, Lee HW, Kim SI, Chun J, Colwell RR, Kim SJ, Lee JH. 2008. The complete genome sequence of Thermococcus onnurineus NA1 reveals a mixed heterotrophic and carboxydotrophic metabolism. J. Bacteriol. 190:7491–7499 [DOI] [PMC free article] [PubMed] [Google Scholar]
- 7. Sokolova TG, Jeanthon C, Kostrikina NA, Chernyh NA, Lebedinsky AV, Stackebrandt E, Bonch-Osmolovskaya EA. 2004. The first evidence of anaerobic CO oxidation coupled with H2 production by a hyperthermophilic archaeon isolated from a deep-sea hydrothermal vent. Extremophiles 8:317–323 [DOI] [PubMed] [Google Scholar]
- 8. Bae SS, Kim TW, Lee HS, Kwon KK, Kim YJ, Kim MS, Lee JH, Kang SG. 2012. H2 production from CO, formate or starch using the hyperthermophilic archaeon, Thermococcus onnurineus. Biotechnol. Lett. 34:75–79 [DOI] [PubMed] [Google Scholar]
- 9. Fox JD, He YP, Shelver D, Roberts GP, Ludden PW. 1996. Characterization of the region encoding the CO-induced hydrogenase of Rhodospirillum rubrum. J. Bacteriol. 178:6200–6208 [DOI] [PMC free article] [PubMed] [Google Scholar]
- 10. Fox JD, Kerby RL, Roberts GP, Ludden PW. 1996. Characterization of the CO-induced, CO-tolerant hydrogenase from Rhodospirillum rubrum and the gene encoding the large subunit of the enzyme. J. Bacteriol. 178:1515–1524 [DOI] [PMC free article] [PubMed] [Google Scholar]
- 11. Soboh B, Linder D, Hedderich R. 2002. Purification and catalytic properties of a CO-oxidizing:H2-evolving enzyme complex from Carboxydothermus hydrogenoformans. Eur. J. Biochem. 269:5712–5721 [DOI] [PubMed] [Google Scholar]
- 12. Lim JK, Kang SG, Lebedinsky AV, Lee JH, Lee HS. 2010. Identification of a novel class of membrane-bound [NiFe]-hydrogenases in Thermococcus onnurineus NA1 by in silico analysis. Appl. Environ. Microbiol. 76:6286–6289 [DOI] [PMC free article] [PubMed] [Google Scholar]
- 13. Tirado-Acevedo O, Chinn MS, Grunden AM. 2010. Production of biofuels from synthesis gas using microbial catalysts. Adv. Appl. Microbiol. 70:57–92 [DOI] [PubMed] [Google Scholar]
- 14. Najafpour GD, Younesi H. 2007. Bioconversion of synthesis gas to hydrogen using a light-dependent photosynthetic bacterium, Rhodospirillum rubrum. World J. Microbiol. Biotechnol. 23:275–284 [Google Scholar]
- 15. Najafpour GD, Younsei H, Mohamed AR. 2003. Continuous hydrogen production via fermentation of synthesis gas. Petroleum Coal 45:154–158 [Google Scholar]
- 16. Younesi H, Najafpour G, Ku Ismail KS, Mohamed AR, Kamaruddin AH. 2008. Biohydrogen production in a continuous stirred tank bioreactor from synthesis gas by anaerobic photosynthetic bacterium: Rhodospirillum rubrum. Bioresour. Technol. 99:2612–2619 [DOI] [PubMed] [Google Scholar]
- 17. Do YS, Smeenk J, Broer KM, Kisting CJ, Brown R, Heindel TJ, Bobik TA, DiSpirito AA. 2007. Growth of Rhodospirillum rubrum on synthesis gas: conversion of CO to H2 and poly-b-hydroxyalkanoate. Biotechnol. Bioeng. 97:279–286 [DOI] [PubMed] [Google Scholar]
- 18. Kopke M, Mihalcea C, Bromley JC, Simpson SD. 2011. Fermentative production of ethanol from carbon monoxide. Curr. Opin. Biotechnol. 22:320–325 [DOI] [PubMed] [Google Scholar]
- 19. Kopke M, Mihalcea C, Liew FM, Tizard JH, Ali MS, Conolly JJ, Al-Sinawi B, Simpson SD. 2011. 2,3-Butanediol production by acetogenic bacteria, an alternative route to chemical synthesis, using industrial waste gas. Appl. Environ. Microbiol. 77:5467–5475 [DOI] [PMC free article] [PubMed] [Google Scholar]
- 20. Henstra AM, Sipma J, Rinzema A, Stams AJM. 2007. Microbiology of synthesis gas fermentation for biofuel production. Curr. Opin. Biotechnol. 18:200–206 [DOI] [PubMed] [Google Scholar]
- 21. Zhao Y, Cimpoia R, Liu Z, Guiot SR. 2011. Kinetics of CO conversion into H2 by Carboxydothermus hydrogenoformans. Appl. Microbiol. Biotechnol. 91:1677–1684 [DOI] [PubMed] [Google Scholar]
- 22. Kim YJ, Lee HS, Kim ES, Bae SS, Lim JK, Matsumi R, Lebedinsky AV, Sokolova TG, Kozhevnikova DA, Cha SS, Kim SJ, Kwon KK, Imanaka T, Atomi H, Bonch-Osmolovskaya EA, Lee JH, Kang SG. 2010. Formate-driven growth coupled with H2 production. Nature 467:352–355 [DOI] [PubMed] [Google Scholar]
- 23. Bae SS, Kim YJ, Yang SH, Lim JK, Jeon JH, Lee HS, Kang SG, Kim SJ, Lee JH. 2006. Thermococcus onnurineus sp. nov., a hyperthermophilic archaeon isolated from a deep-sea hydrothermal vent area at the PACMANUS field. J. Microbiol. Biotechnol. 16:1826–1831 [Google Scholar]
- 24. Holden JF, Takai K, Summit M, Bolton S, Zyskowski J, Baross JA. 2001. Diversity among three novel groups of hyperthermophilic deep-sea Thermococcus species from three sites in the northeastern Pacific Ocean. FEMS Microbiol. Ecol. 36:51–60 [DOI] [PubMed] [Google Scholar]
- 25. Balch WE, Wolfe RS. 1976. New approach to the cultivation of methanogenic bacteria: 2-mercaptoethanesulfonic acid (HS-CoM)-dependent growth of Methanobacterium ruminantium in a pressurized atmosphere. Appl. Environ. Microbiol. 32:781–791 [DOI] [PMC free article] [PubMed] [Google Scholar]
- 26. Kengen SWM, Stams AJM. 1994. Formation of l-alanine as a reduced end-product in carbohydrate fermentation by the hyperthermophilic archaeon Pyrococcus furiosus. Arch. Microbiol. 161:168–175 [Google Scholar]
- 27. Matsumi R, Manabe K, Fukui T, Atomi H, Imanaka T. 2007. Disruption of a sugar transporter gene cluster in a hyperthermophilic archaeon using a host-marker system based on antibiotic resistance. J. Bacteriol. 189:2683–2691 [DOI] [PMC free article] [PubMed] [Google Scholar]
- 28. Ragsdale SW. 2004. Life with carbon monoxide. Crit. Rev. Biochem. Mol. Biol. 39:165–195 [DOI] [PubMed] [Google Scholar]
- 29. Oh YK, Kim YJ, Park JY, Lee TH, Kim MS, Park S. 2005. Biohydrogen production from carbon monoxide and water by Rhodopseudomonas palustris P4. Biotechnol. Bioprocess Eng. 10:270–274 [Google Scholar]
- 30. Jung GY, Kim JR, Park JY, Park S. 2002. Hydrogen production by a new chemoheterotrophic bacterium Citrobacter sp Y19. Int. J. Hydrogen Energy 27:601–610 [Google Scholar]
- 31. Klasson KT, Lundback KMO, Clausen EC, Gaddy JL. 1993. Kinetics of light limited growth and biological hydrogen production from carbon-monoxide and water by Rhodospirillum rubrum. J. Biotechnol. 29:177–188 [Google Scholar]
- 32. Wolfrum EJ, Watt AS. 2002. Bioreactor design studies for a hydrogen-producing bacterium. Appl. Biochem. Biotechnol. 98:611–625 [DOI] [PubMed] [Google Scholar]
- 33. Amend JP, Shock EL. 2001. Energetics of overall metabolic reactions of thermophilic and hyperthermophilic archaea and bacteria. FEMS Microbiol. Rev. 25:175–243 [DOI] [PubMed] [Google Scholar]


