

Abstract
Purpose: The purpose of this study was to evaluate whether DTI could demonstrate the water diffusivity changes in the corpus callosum (CC), which were not visible on the morphologic imaging in patients with glioblastoma multiforme (GBM) and brain metastases with no midline CC infiltration.
Materials and Methods: Twenty-seven patients with treatment naïve unilateral GBM and eleven patients with a solitary brain metastasis with no midline CC infiltration underwent DTI. Ten controls with normal brain MRI were also included. Based on the tensors, the principal diffusion directions, the anisotropy values, and the prior information about the diffusivity pattern in CC, a similarity measure was proposed. Subsequently, the CC was automatically divided into the Witelson subdivisions.
Results: We observed significantly decreased fractional anisotropy values in all the regions of CC in the patients with GBM and metastases as compared to those in the controls. The mean diffusivity values showed a significant increase in all the regions of CC, except the splenium in patients with GBM and the isthmus in the patients with metastases, as compared to that in the controls respectively.
Conclusion: In conclusion, DTI is more sensitive than the morphologic MR imaging in the evaluation of changes within the CC, in brain tumours which do not infiltrate the CC. However, these changes of the DTI metrics in the CC are due to a Wallerian degeneration rather than a tumour infiltration, as was shown by our results, as similar changes were seen in the GBM as well as the non-infiltrating metastases patients.
Keywords: Corpus callosum, Wallerian degeneration, Glioblastoma multiforme, Brain metastases, Diffusion tensor imaging
INTRODUCTION
The degeneration of white matter (WM) fibres at a distance from a primary lesion, which is referred to as Wallerian degeneration (WD), is a common finding in many diseases of the central nervous system [1–3]. From the primary lesion, the WD proceeds distally towards the axon terminals. The WD is characterized by a highly stereotypical course, starting with the disintegration of the axonal structures within days after an injury, followed by the degradation of the myelin sheath and the infiltration of the macrophages, with the subsequent atrophy of the affected fibre tracts [4,5]. The WD is the inflammatory response of the nervous system to an axonal injury, which is primarily attributable to the production of cytokines [6]. In ischaemic stroke, the WD of the corticospinal tracts is a wellknown phenomenon [3,7]. However, only few studies have reported the WD in the pyramidal tracts in brain tumours [2,3]. The corpus callosum (CC) is the largest commissural fibre that connects the homologous regions of both the cerebral hemispheres of the brain and it plays a key role in the interhemispheric transfer of the sensory, motor and the cognitive information and the brain lateralization [8,9]. The callosal axons exhibit a topographical distribution, with the different CC regions serving the different cortical regions. The most rostral regions of the CC, the genu and the rostrum, have connections between the prefrontal brain regions and the most caudal region, the splenium contains connections between the occipital, temporal and the parietal regions [9].
Diffusion tensor imaging (DTI) is a non-invasive method for characterizing the diffusion properties of tissue water. DTI is extremely sensitive to the subtle differences in the architecture of the white matter at the microstructural level [10]. The white matter tracts of the CC are highly coherent, which make them well suited for a study by using DTI. Fractional anisotropy (FA) and mean diffusivity (MD) are the commonly used metrics that reflect the magnitude and the directionality of the water motion respectively [11]. The degree of the anisotropy depends on the level of organization of the tracts and the degree of hindrance to the water diffusion of the oriented axonal membranes and the myelin sheath [12,13]. When the WM tracts degenerate, as in cerebral infarction, a decrease in the diffusion anisotropy is observed. The CC white matter tracts are significantly influenced by the cortical damage; a previous study demonstrated the WD changes in different segments of the CC, in patients with large middle cerebral artery strokes by using DTI at different time points [14]. DTI therefore appears to be well suited for studying the water diffusivity changes in the CC, in patients with brain tumours which do not infiltrate the CC.
The purpose of this retrospective study was to evaluate whether DTI could demonstrate the water diffusivity changes in the CC, which were not visible on morphologic imaging, in the patients with glioblastoma multiforme (GBM) with no midline CC infiltration. However, whether the changes which are seen on DTI in the CC of patients with brain tumours which do not infiltrate the CC are due to the tumour infiltration or the WD, is still controversial. Hence, we included the single metastatic tumours with no midline CC infiltration in the present study, with the hypothesis that the CC changes were attributable to the WD, as these would be seen in both the groups.
METHODS
This retrospective study was approved by the institutional review board and it was compliant with the Health Insurance Portability and Accountability Act (HIPAA). Between February 2006 and December 2008, twenty-seven patients with treatment naïve unilateral GBM (WHO grade IV gliomas) (16 males and 11 females; mean age 60 years), which did not infiltrate the midline CC and eleven patients with solitary brain metastases with no midline CC infiltration (3 males and 8 females; mean age 59 years), who underwent MRI with DTI at our institution, were reviewed. The primary lesions which were responsible for the metastases included lung cancer (n=5), breast cancer (n=3), ovarian cancer (patient=1) and malignant melanoma (n=2). For the control group, ten patients (7 males and 3 females; mean age 48 years) who underwent brain MRI for a nonspecific headache or a single idiopathic seizure with normal MRI results, were also included.
The MRI Technique
All the patients underwent both conventional MRI and DTI on a 3T scanner (Excite HD, GE Medical Systems, Milwaukee, WI) by using an 8-channel head coil. The 3T MRI acquisitions included the axial T2 images (TR 3000ms, TE 102ms), the axial FLAIR images (TR 10000ms, TE 120ms, inversion time 2250ms) and the axial T1 FLAIR images (TR 3000ms, TE minimum full). All these images were performed with FOV=240×240mm, at a 5mm slice thickness with no interslice gap and a 320×224 image matrix. DTI was performed in the axial plane with a single-shot spin-echo-echo-planar imaging with TR=17000ms; TE=84.3ms; the gradients were applied in 25 non-collinear directions; b=0, 1000s/mm2; FOV=240×240mm; 256×256 image matrix; at a slice thickness of 5mm with no gap.
The dTI data Processing and the Segmentation of the CC
The imaging in-plane pixel and the matrix size were 0.975×0.975 and 256×256mm2 respectively, with a slice thickness of 5mm. These values were originally 1.95 × 1.95 and 128 × 128mm2, but they were automatically interpolated to 256×256 by the GE console. To improve the inter-plane resolution, to simultaneously reduce the size of the data and to take advantage of having a homogeneous voxel size in segmenting the CC, we interpolated the diffusion data back to the matrix size of 128×128 and the voxel size of 0.975 × 0.975 × 0.98mm3. Finally, after calculating the tensor, we extracted its principal diffusion direction (PDD) (the vector which was assigned to the largest tensor eigen value) and the FA, and the MD values for each voxel.
For segmenting the CC, we used an automatic 3-dimensional level-set method. The corpus callosum is a commissural fibre bundle with a specific diffusion pattern, which can be coded as a prior knowledge in the segmentation framework. By using this information, we prevented the hyper-surface from propagating into the adjacent white matter structures such as the cingulum, tapetum, the minor and the major forceps, and the corticospinal tracts. Although the dissimilarity among the tensors helps in this case, the smooth and the gradual transition in the shape and the direction of the DTI tensors from the CC to the minor and the major forceps makes the segmentation difficult. We defined a similarity measure between every voxel on the propagating hyper-surface and its neighbours in the propagation direction, based on the tensors, the anisotropies, and the PDD in the neighbouring voxels.
By using the fact that the diffusivity in the CC was perpendicular to the mid-sagittal plane of the brain, we considered a threshold ( ) for the x-component of the PDD for the front propagation. Besides, we considered two more thresholds on the collinearity of the PDD vectors ( ) and the similarity of the FA values ( ) in the neighbouring voxels.
The segmentation steps were as follows:
Select the initial seeds in the CC in the mid-sagittal plane manually.
Initiate the hyper-surface as the congregation of small spheres around the seed points.
- Do until convergence
- For each point, r on the hyper-surface at step, t:
- Calculate the normal direction to the surface.
- Calculate the 26-neighbourhood and keep the neighbours rn for r, which are collinear with the normal, with respect to the r.
-
If PDD(r).PDD(nr) > Collinearity_Threshold& FA(nr) > FA Threshold& PDDx(r) > PDDx_Threshold
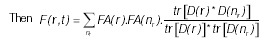 The threshold F(r, t) to diminish the effect of the negligible speeds.Use the resultant speed in the level-set framework.
Extract the zero level-set as the segmented CC.
where tr(.) is the matrix trace and D(r) is the tensor at point r.
The proposed method propagates a hyper-surface within the CC without penetration into the neighbouring fibre bundles. It takes 5 minutes on an average to segment the CC for each patient by using a PC with an Intel Core 2Due CPU (E8400@ 3.00 GHz, 3.00 GHz), an 8 GB RAM and a 64 bit VISTA operating system with MATLB R2009a.
After segmenting the CC, the Witelson subdivisions of the CC were automatically extracted [9] to quantify the various diffusion parameters. First, the critical point between the genu and the rostrum of the CC was calculated, where the curvature of the structure boundary in the mid-sagittal plane had changed. Then, the segmented CC was automatically subdivided into the Witelson subdivisions in the mid-sagittal plane: the rostrum, the genu, the rostral body, the anterior midbody, the posterior midbody, the isthmus and the splenium [Table/Fig-1] [9].
[Table/Fig-1]:
![[Table/Fig-1]:](https://www.ncbi.nlm.nih.gov/core/lw/2.0/html/tileshop_pmc/tileshop_pmc_inline.html?title=Click%20on%20image%20to%20zoom&p=PMC3&id=3592302_jcdr-7-320-g001.jpg)
Segmentation results for the corpus callosum obtained by our proposed segmentation method for 10 control subjects (a) 12 glioblastoma multiforme patients, not all the patients shown here (b) and 11 metastases patients (c) The colors show the Witelson subdivisions results for the corpus callosum. Rostrum: blue, Genu: green, Rostral Body: cyan, Anterior Mid-body: red, Posterior Mid-body: turquoise, Isthmus: yellow, Splenium: gray.
Statistical Analysis
In the following analyses, three groups of patients were included; the controls (n=10), the patients with GBM (n=27) and the patients with metastatic tumours (n=11). The means and the standard deviations were computed for each of the three groups for the seven different regions of the CC. Two sample t-tests were done for the pairwise comparisons of the three groups. Two sample t-tests were also done to compare the patients with GBM and the patients with metastases for their ages and sizes. A Chi-square test was done to compare the two groups for sex. The p-values which were less than 0.05 were considered to be statistically significant and no adjustments were done for the multiple testing. All the data analyses were conducted by using SAS (SAS version 9.2, SAS Institute Inc., Cary, NC).
RESULTS
The locations of the tumours in the twenty-seven GBM patients were frontal (n=1), parietal (n=2), occipital (n=1), temporal (n=11), fronto-parietal (n=3), fronto-temporal (n=2), parieto-occipital n=2), temporo-parietal (n=2) and temporo-occipital (n=3). In the eleven metastatic patients, the tumours were located as frontal n=2), temporal (n=1), fronto-parietal (n=1), parieto-occipital (n=4), temporo-parietal (n=1) and temporo-occipital (n=2). The mean sizes of the tumours in the patients with GBM and in those with metastases were 1481.1mm2 and 1080.8mm2 respectively [Table/Fig-2]. No significant differences were detected between the patients with GBM and those with metastases for the age, area and sex [Table/Fig-2].
[Table/Fig-2]:
Descriptive Statistics for Sex, Age and Area (mm2) for Patients with GBM and Metastases.
| Variable | GBM (n=27) | Metastases (n=11) | p-value | |
|---|---|---|---|---|
| Sex, n (%) | Female | 11 (41%) | 8 (73%) | 0.073 |
| Male | 16 (59%) | 3 (27%) | ||
| Age | Mean | 59.7 | 59.1 | 0.897 |
| SD | 13.9 | 11.5 | ||
| Median | 60 | 63 | ||
| Range | 21-91 | 37-93 | ||
| Area, mm2 | Mean | 1481.1 | 1080.8 | 0.230 |
| SD | 945.4 | 840.0 | ||
| Median | 1262.66 | 595.02 | ||
| Range | 80.96-3548.16 | 351.26-2661.68 | ||
GBM = glioblastoma multiforme; SD = standard deviation. p < 0.05 was statistically significant.
[Table/Fig-1] shows the segmentation results for the CC which were obtained by our proposed segmentation method for the control subjects (a), the GBM patients (b), and the metastases patients (c) along with the Witelson subdivisions. In some patients with GBM, the tumours has forced the CC into a deviation; still the algorithm was capable of extracting the CC and its subdivisions.
The means and the standard deviations of the FA and the MD values for the seven different regions of the CC for the controls, the patients with GBM and for those with metastases, are shown in [Table/Fig-3]. The FA values were significantly decreased in the patients with GBM and in those with metastases in all the regions of the CC as compared to those in the controls respectively. We did not find any significant difference in the FA values for all the seven regions of the CC in the patients with GBM as compared to those in the patients with metastases [Table/Fig-3, Table/Fig-4].
[Table/Fig-3]:
Descriptive Statistics for FA values and MD values (×10-3mm2/s) (mean±SD) in Controls, Patients with GBM and Metastases (first three columns), and p-values from Two Sample T-test for Pairwise Group Comparisons for FA and MD Values (second three columns) in Seven Different Regions of CC
| Region | Controls (n=10) | GBM (n=27) | Metastases (n=11) | Gbm vs. Control | Metastases vs. Control | GBM vs. Metastases | |
|---|---|---|---|---|---|---|---|
| Rostrum | FA | 0.53 ± 0.05 | 0.43 ± 0.11 | 0.42 ± 0.10 | 0.001 | 0.007 | 0.699 |
| MD | 0.70 ± 0.08 | 0.84 ± 0.22 | 0.89 ± 0.23 | 0.007 | 0.024 | 0.543 | |
| Genu | FA | 0.55 ± 0.02 | 0.50 ± 0.05 | 0.50 ± 0.05 | <0.001 | 0.004 | 0.601 |
| MD | 0.61 ± 0.05 | 0.67 ± 0.08 | 0.69 ± 0.09 | 0.028 | 0.022 | 0.583 | |
| Rostral body | FA | 0.49 ± 0.04 | 0.40 ± 0.07 | 0.41 ± 0.08 | <0.001 | 0.008 | 0.957 |
| MD | 0.67 ± 0.08 | 0.80 ± 0.15 | 0.82 ± 0.16 | 0.014 | 0.015 | 0.681 | |
| Anterior midbody | FA | 0.49 ± 0.05 | 0.38 ± 0.07 | 0.39 ± 0.09 | <0.001 | 0.005 | 0.614 |
| MD | 0.68 ± 0.08 | 0.86 ± 0.17 | 0.85 ± 0.16 | <0.001 | 0.009 | 0.75 | |
| Posterior midbody | FA | 0.49 ± 0.04 | 0.39 ± 0.05 | 0.40 ± 0.07 | <0.001 | 0.005 | 0.416 |
| MD | 0.72 ± 0.09 | 0.89 ± 0.13 | 0.85 ± 0.15 | <0.001 | 0.025 | 0.42 | |
| Isthmus | FA | 0.47 ± 0.05 | 0.39 ± 0.07 | 0.39 ± 0.08 | 0.003 | 0.015 | 0.884 |
| MD | 0.79 ± 0.11 | 0.90 ± 0.15 | 0.89 ± 0.16 | 0.041 | 0.116 | 0.799 | |
| Splenium | FA | 0.58 ± 0.04 | 0.53 ± 0.05 | 0.52 ± 0.05 | 0.004 | 0.005 | 0.413 |
| MD | 0.64 ± 0.05 | 0.68 ± 0.07 | 0.70 ± 0.07 | 0.083 | 0.032 | 0.466 |
FA = fractional anisotropy; MD = mean diffusivity; GBM = glioblastoma multiforme; CC = corpus callosum; SD = standard deviation. p < 0.05 was statistically significant.
[Table/Fig-4]:
![[Table/Fig-4]:](https://www.ncbi.nlm.nih.gov/core/lw/2.0/html/tileshop_pmc/tileshop_pmc_inline.html?title=Click%20on%20image%20to%20zoom&p=PMC3&id=3592302_jcdr-7-320-g002.jpg)
(a) Post-contrast T1-weighted axial, (b) Fluid attenuated inversion recovery image, (c) Mean diffusivity and (d) Fractional anisotropy maps in a 79-year old male with glioblastoma multiforme in left parietooccipital lobe not infiltrating the corpus callosum. (e-h) Corresponding images in a 68-year old male with enhancing necrotic metastasis in left parieto-occipital lobe.
The MD values, on the other hand, showed a significant increase in the patients with GBM as compared to those in the controls in all the regions of the CC, except the splenium [Table/Fig-3]. In the patients with metastases, a significant increase in the MD values was observed in the rostrum, the genu, the rostral body, the anterior midbody, the posterior midbody and the splenium, except the isthmus as compared to those in the controls. None of the seven regions of the CC showed a significant difference in the MD values between the patients with GBM and those with metastases [Table/Fig-3].
DISCUSSION
DTI has been proposed as a promising tool for the delineation of the extent of the tumour infiltration by primary brain tumours [15] and it also has been shown to demonstrate the changes away from the primary tumour, which were attributed to the tumour infiltration and were not visible on the morphologic imaging [16]. However, DTI provides information about the water diffusivity within the WM tracts, which was based on a number of inter-related factors which were not just limited to the tumour cell density, the tumour cell invasion and the oedema, but also included a component of the WD which had been mostly ignored by most of the researchers till now. The present study investigated the DTI metrics of the CC in patients with unilateral brain tumours which were not infiltrating or involving the midline CC. We observed significantly decreased FA values in all the regions of the CC in the patients with GBM and metastases as compared to those in the controls. The MD values showed a significant increase in all the regions of the CC except the splenium in the patients with GBM and the isthmus in the patients with metastases as compared to those in the controls respectively. However, no significant difference in the FA and the MD values for all the seven regions of the CC was found in the patients with GBM as compared to the patients with metastases, thus suggesting that these changes of the DTI metrics in the CC were due to the WD rather than the tumour infiltration, as the metastases were not known to infiltrate the WM tracts. A previous study had attributed the water diffusivity changes within the CC to the tumour infiltration in the patients with high grade gliomas [16]. However, it had neither evaluated the non—infiltrating tumours such as the metastases to support that, as was done in the present study, nor had they shown any histological or follow-up imaging proof of the CC infiltration.
Previous experimental studies which had been done on the WD had demonstrated that in the white matter, the anisotropy of the diffusion had mainly resulted from the axonal structures and the myelin sheath [17,18]. The disintegration of the axonal structures and the myelin sheath as it occurs in the WD, results in a reduced anisotropy on DTI. In the patients with ischaemic stroke, DTI has been used to detect and to quantify the WD of the pyramidal tract in the early subacute stage [19] as well as in the chronic stage of stroke [20,21]. In the current study, the observed decrease in the FA values was probably related to the WD that had resulted in the destruction of the fibre structures within the tissue, followed by gliosis and an increase in the extracellular matrix, disturbing the movement of the water molecules which were parallel to the fibres rather than the reduced FA values which were seen with the tissue destruction, which were related to the microscopic tumour infiltration, as similar changes were seen in the patients with GBM as well as in the patients with metastases.
Previous DTI studies had demonstrated that the diffusivity was markedly increased in the primary white matter lesion and that it was not changed or increased slightly in the Wallerian (secondary) degeneration [20,21]. Pierpaoli et al demonstrated that in the regions which were primarily affected by the stroke, the resolution of the liquefactive necrosis had led to the formation of the ccystic spaces which were filled with the cerebrospinal fluid [21]. The increased content of the isotropically diffusing water in these cavities was consistent with a marked increase in the MD. In contrast, in the WD, there is neither a significant water accumulation in the interstitial spaces nor the formation of cysts, leading to a limited increase in the MD [21]. In the pyramidal tract, no clear changes of the MD could be detected in the early subacute stage [19]; however, in the chronic stage, with the progression of the structural degradation due to the WD, an increase in the MD was obvious [21]. The probable reason which had been reported for the insignificant change in the MD in the pyramidal tract was related to the WD. Although the disruption of the myelin and the axons might be expected to increase the MD of the water molecules, an accumulation of the cellular debris from the breakdown of the axons may hinder the water molecule motion [22]. Furthermore, the WD is characterized histologically by the glial proliferation [18,23], which would also be expected to restrict the mobility of the water molecules. Both of these factors may contribute to the apparent normality of the MD in the affected pyramidal tract. Our study showed a significant increase in the MD values in all the regions of the CC except the splenium in the patients with GBM and the isthmus in the patients with metastases. This finding may be explained by a cumulative loss of the cell membranes which was caused by the delayed damage of the axons and the proliferation of the glial cells within the cerebral white matter.
The cortico-callosal topographical relationship has been reported in humans [9,24,25]. Witelson measured the midsagittal area of the CC in its entirety and in its seven subdivisions in 50 human brains which were consecutively obtained from the autopsies of individuals who had a neuropsychological testing before their deaths [9]. The seven regions of the CC were assigned anatomical labels by Witelson as the rostrum, the genu, the rostral body, the anterior midbody, the posterior midbody, the isthmus and the splenium [9]. Witelson also reported the topography of the callosal fibers in relation to the cortical regions of the origin and termination, which were based mainly on the experimental work with monkeys, which involved ablation/degeneration studies [26] and also clinical human studies [24]. The rostrum contains the fibres from the caudal/orbital prefrontal and the inferior premotor regions and the genu contains fibres from the prefrontal regions. These fibres form the premotor and the supplementary motor course through the rostral body. The WM fibers from the motor somaesthetic and the posterior parietal regions course through the anterior body and the posterior body respectively. The isthmus contains fibres from the superior temporal and the posterior parietal regions and the splenium contains fibres from the occipital and the inferior temporal regions [9]. In another study, de Lacoste et al reported the relationship between the cortical lesion sites which were due to ischaemic infarctions or circumscribed contusions in 13 postmortem brains and the sites of the WD in each region of the CC [24]. To localize the site of the axon degeneration, de Lacoste et al divided the CC into five subregions that generally corresponded to the genu (which included the rostrum), the anterior body, the midbody, the posterior body and the splenium. The WM fibres from the inferior frontal, the prefrontal and the anterior inferior parietal regions course through the anterior subregion of the rostrum and the genu. The callosal fibers from the superior frontal and the anterior parietal regions course through the anterior two-thirds of the body of the CC. The fibres which project into the splenium and the caudal portion of the body of the CC correspond to the temporo-parietooccipital junctional region [24]. In the human postmortem brains, a splenium degeneration that corresponded to a single occipital lobe lesion has been reported [25]. A previous study demonstrated the secondary white matter degeneration of the splenium of the CC by using DTI in patients with temporal lobe epilepsy [27]. In our study, most of the patients had involvement of the frontal, parietal, temporal, parieto-occipital and the temporo-occipital regions, which was secondary to the GBM and the metastases. This suggested that the interhemispheric fibres from the frontal, parietal, occipital and the temporal lobes that coursed through the rostrum, the genu, the rostral body, the anterior midbody, the posterior midbody, and the splenium [24] were the most affected fibres, which were secondary to the tumour related WD changes in these regions of the CC.
The limitations of our study included the small sample size, the unequal number of patients in both the GBM and the metastases groups and the almost ten year discrepancy in the ages within the two tumour types and the controls. Another limitation was the absence of a histological or a follow-up imaging evidence of the tumour infiltration in both the patients with GBM and in those with metastases. Our study showed that the changes in the DTI metrics in the patients with GBM and metastases were due to the WD, which was likely to be correct in the cases with metastases; while in the GBM patients, the microscopic tumour infiltration could not be distinguished from the WD through the FA and the MD measurements alone and therefore, a histological confirmation was necessary to prove the presence or the absence of the WD in the GBM patients.
CONCLUSIONS
The current study showed that DTI was more sensitive than the morphologic MR imaging in the evaluation of the changes within the CC in brain tumours which were not infiltrating or directly involving the CC. However, these changes in the DTI metrics in the CC were more likely to be due to the WD rather than the tumour infiltration, since similar findings were seen in GBM which did not directly infiltrating the CC, as in the non-infiltrating metastases.
Financial or Other Competing Interests
None.
REFERENCES
- [1].Kuhn MJ, Johnson KA, Davis KR. The Wallerian degeneration: an evaluation with MR imaging. Radiology. 1988;168:199–202. doi: 10.1148/radiology.168.1.3380957. [DOI] [PubMed] [Google Scholar]
- [2].Lahrmann H, Horvath-Mechtler B, Hitzenberger P, Oberndorfer S, Struhal W, Grisold W. Pyramidal tract degeneration in an astrocytoma. J Neurooncol. 2005;72:271–72. doi: 10.1007/s11060-004-2342-6. [DOI] [PubMed] [Google Scholar]
- [3].Sawlani V, Gupta RK, Singh MK, Kohli A. An MRI demonstration of the Wallerian degeneration in various intracranial lesions and its clinical implications. J Neurol Sci. 1997;146:103–08. doi: 10.1016/s0022-510x(96)00299-7. [DOI] [PubMed] [Google Scholar]
- [4].Johnson AC, McNabb AR, Rossiter RJ. The chemistry of the Wallerian degeneration. A review of recent studies. Arch Neurol Psychiat. 1950;64:105–21. doi: 10.1001/archneurpsyc.1950.02310250111010. [DOI] [PubMed] [Google Scholar]
- [5].Lampert PW, Cressman MR. The fine-structural changes of the myelin sheaths after an axonal degeneration in the spinal cord of rats. Am J Pathol. 1966;49:1139–55. [PMC free article] [PubMed] [Google Scholar]
- [6].Shamash S, Reichert F, Rotshenker S. The cytokine network of the Wallerian degeneration: the tumor necrosis factor-alpha, the interleukin-1alpha, and the interleukin-1beta. The J of Neurosci. 2002;22:3052–60. doi: 10.1523/JNEUROSCI.22-08-03052.2002. [DOI] [PMC free article] [PubMed] [Google Scholar]
- [7].Matsusue E, Sugihara S, Fujii S, Kinoshita T, Ohama E, Ogawa T. Wallerian degeneration of the corticospinal tracts: the postmortem MR-pathologic correlations. Acta Radiol. 2007;48:690–94. doi: 10.1080/02841850701342112. [DOI] [PubMed] [Google Scholar]
- [8].Gazzaniga MS. The cerebral specialization and the interhemispheric communication: does the corpus callosum enable the human condition? Brain. 2000;123:1293–1326. doi: 10.1093/brain/123.7.1293. [DOI] [PubMed] [Google Scholar]
- [9].Witelson SF. The hand and sex differences in the isthmus and the genu of the human corpus callosum. A postmortem morphological study. Brain. 1989;112:799–835. doi: 10.1093/brain/112.3.799. [DOI] [PubMed] [Google Scholar]
- [10].Le Bihan D. Looking into the functional architecture of the brain with diffusion MRI. Nat Rev Neurosci. 2003;4:469–80. doi: 10.1038/nrn1119. [DOI] [PubMed] [Google Scholar]
- [11].Pierpaoli C, Basser PJ. Towards a quantitative assessment of diffusion anisotropy. Magn Reson Med. 1996;36:893–906. doi: 10.1002/mrm.1910360612. [DOI] [PubMed] [Google Scholar]
- [12].Beaulieu C, Allen PS. The determinants of the anisotropic water diffusion in the nerves. Magn Reson Med. 1994;31:394–400. doi: 10.1002/mrm.1910310408. [DOI] [PubMed] [Google Scholar]
- [13].Basser PJ, Pierpaoli C. The microstructural and the physiological features of the tissues which were elucidated by quantitative-diffusiontensor MRI. J Magn Reson B. 1996;111:209–19. doi: 10.1006/jmrb.1996.0086. [DOI] [PubMed] [Google Scholar]
- [14].Gupta RK, Saksena S, Hasan KM, Agarwal A, Haris M, Pandey CM, Narayana PA. A focal Wallerian degeneration of the corpus callosum in a large middle cerebral artery stroke: a serial diffusion tensor imaging. J Magn Reson Imaging. 2006;24:549–55. doi: 10.1002/jmri.20677. [DOI] [PubMed] [Google Scholar]
- [15].Provenzale JM, McGraw P, Mhatre P, Guo AC, Delong D. The peritumoral brain regions in the gliomas and the meningiomas: investigations which were done by using isotropic diffusion-weighted MR imaging and diffusion-tensor MR imaging. Radiology. 2004;232:451–60. doi: 10.1148/radiol.2322030959. [DOI] [PubMed] [Google Scholar]
- [16].Stieltjes B, Schlüter M, Didinger B, Weber MA, Hahn HK, Parzer P, Rexilius J, Konrad-Verse O, Peitgen HO, Essig M. Diffusion tensor imaging in primary brain tumors: the reproducible quantitative analysis of the corpus callosum infiltration and the contralateral involvement by using a probabilistic mixture model. Neuroimage. 2006;31:531–42. doi: 10.1016/j.neuroimage.2005.12.052. [DOI] [PubMed] [Google Scholar]
- [17].Beaulieu C. The basis of theanisotropic water diffusion in the nervous system—a technical review. NMR Biomed. 2002;15:435–55. doi: 10.1002/nbm.782. [DOI] [PubMed] [Google Scholar]
- [18].Kreutzberg GW, Blakemore WF, Graeber MB. Greenfield’s neuropathology. 6th. London: Arnold; 1997. The cellular pathology of the central nervous system. In: Graham DI, Lantos PL, ed; pp. 104–07. [Google Scholar]
- [19].Thomalla G, Glauche V, Koch MA, Beaulieu C, Weiller C, Röther J. Diffusion tensor imaging detects the early Wallerian degeneration of the pyramidal tract after an ischemic stroke. Neuroimage. 2004;22:1767–74. doi: 10.1016/j.neuroimage.2004.03.041. [DOI] [PubMed] [Google Scholar]
- [20].Werring DJ, Toosy AT, Clark CA, Parker GJ, Barker GJ, Miller DH, Thompson AJ. Diffusion tensor imaging can detect and quantify the corticospinal tract degeneration after stroke. J Neurol Neurosurg Psychiatry. 2000;69:269–72. doi: 10.1136/jnnp.69.2.269. [DOI] [PMC free article] [PubMed] [Google Scholar]
- [21].Pierpaoli C, Barnett A, Pajevic S, Chen R, Penix LR, Virta A, Basser P. The water diffusion changes in the Wallerian degeneration and their dependence on the white matter architecture. Neuroimage. 2001;13:1174–85. doi: 10.1006/nimg.2001.0765. [DOI] [PubMed] [Google Scholar]
- [22].Beaulieu C, Does MD, Snyder RE, Allen PS. The changes in the water diffusion which were due to the Wallerian degeneration in the peripheral nerve. Magn Reson Med. 1996;36:627–31. doi: 10.1002/mrm.1910360419. [DOI] [PubMed] [Google Scholar]
- [23].Zhang Z, Guth L. An experimental spinal cord injury: the Wallerian degeneration in the dorsal column is followed by revascularization, glial proliferation, and nerve regeneration. Exp Neurol. 1997;147:159–71. doi: 10.1006/exnr.1997.6590. [DOI] [PubMed] [Google Scholar]
- [24].de Lacoste MC, Kirkpatrick JB, Ross ED. The topography of the human corpus callosum. J Neuropathol Exp Neurol. 1985;44:578–91. doi: 10.1097/00005072-198511000-00004. [DOI] [PubMed] [Google Scholar]
- [25].Clarke S, Miklossy J. The occipital cortex in man: the organization of the callosal connections, the related myelo- and cytoarchitecture, and the putative boundaries of the functional visual areas. J Comp Neurol. 1990;298:188–214. doi: 10.1002/cne.902980205. [DOI] [PubMed] [Google Scholar]
- [26].Pandya DN, Karol EA, Heilbronn D. The topographical distribution of the interhemispheric projections in the corpus callosum of the Rhesus monkey. Brain Res. 1971;32:31–43. doi: 10.1016/0006-8993(71)90153-3. [DOI] [PubMed] [Google Scholar]
- [27].Kim H, Piao Z, Liu P, Bingaman W, Diehl B. The secondary white matter degeneration of the corpus callosum in patients with intractable temporal lobe epilepsy: a diffusion tensor imaging study. Epilepsy Res. 2008;81:136–42. doi: 10.1016/j.eplepsyres.2008.05.005. [DOI] [PubMed] [Google Scholar]