

Abstract
Genome-wide association studies (GWAS) are a useful approach in the study of the genetic components of complex phenotypes. Aside from large cohorts, GWAS have generally been limited to the study of one or a few diseases or traits. The emergence of biobanks linked to electronic medical records (EMRs) allows the efficient re-use of genetic data to yield meaningful genotype-phenotype associations for multiple phenotypes or traits. Phase I of the electronic MEdical Records and GEnomics (eMERGE-I) Network is a National Human Genome Research Institute (NHGRI)-supported consortium composed of five sites to perform various genetic association studies using DNA repositories and EMR systems. Each eMERGE site has developed EMR-based algorithms to comprise a core set of fourteen phenotypes for extraction of study samples from each site’s DNA repository. Each eMERGE site selected samples for a specific phenotype, and these samples were genotyped at either the Broad Institute or at the Center for Inherited Disease Research (CIDR) using the Illumina Infinium BeadChip technology. In all, approximately 17,000 samples from across the five sites were genotyped. A unified quality control (QC) pipeline was developed by the eMERGE Genomics Working Group and used to ensure thorough cleaning of the data. This process includes examination of sample quality, marker quality, and various batch effects. Upon completion of the genotyping and QC analyses for each site’s primary study, the eMERGE Coordinating Center merged the datasets from all five sites. This larger merged dataset re-entered the established eMERGE QC pipeline. Based on lessons learned during the process, additional analyses and QC checkpoints were added to the pipeline to ensure proper merging. Here we explore the challenges associated with combining datasets from different genotyping centers and describe the expansion to the eMERGE QC pipeline for merged datasets. These additional steps will be useful as the eMERGE project expands to include additional sites in eMERGE-II and also serve as a starting point for investigators merging multiple genotype data sets accessible through the National Center for Biotechnology Information (NCBI) in the database of Genotypes and Phenotypes (dbGaP). Our experience demonstrates that merging multiple datasets after additional QC can be an efficient use of genotype data despite new challenges that appear in the process.
Keywords: quality control, genome-wide association (GWAS), eMERGE, dbGaP, merging datasets
Introduction
Genome-wide association studies (GWAS) have become a useful approach for identifying common disease susceptibility genetic variants associated with complex genetic disorders (1). Various genotyping platforms have been designed to give high coverage of common variation across the entire genome using single nucleotide polymorphisms (SNPs) (2-5). These SNP “chips” allow for cost-effective genotyping of millions of variants on thousands of individuals.
It has become clear that large sample sizes are required to identify the many variants with small effect sizes characteristic of most complex traits (6). In lieu of case-control or population-based cohort studies that ascertain participants for specific diseases or traits, biobanks linked to the electronic medical record (EMR) can be used in genetic research (7-12). Compared with studies that are limited in phenotypic scope, biobanks allow the efficient re-use of genetic information for the study of numerous phenotypes due to the extensive phenotypic data available in the EMR.
The electronic MEdical Records and GEnomics (eMERGE) Network is a National Human Genome Research Institute (NHGRI)-supported consortium composed of five sites in eMERGE-I that use DNA repositories linked with EMR systems to perform genetic association studies. The five sites include Group Health Seattle (Group Health Cooperative, the University of Washington, and the Fred Hutchinson Cancer Research Center), Marshfield Clinic, Mayo Clinic, Northwestern University, and Vanderbilt University Medical Center (10,13). Electronic classification algorithms have been developed for fourteen specific phenotypes to allow for the identification and extraction of study samples from each site’s repository (www.gwas.net). DNA samples from each site were initially genotyped for one site-specific phenotype. These samples were genotyped at the Broad Institute or the Center for Inherited Disease Research (CIDR) using the Illumina 660W-Quad array for those of self-reported (or observer-reported) European or unknown ancestry and the Illumina 1M-Duo array for those of self-reported (or observer-reported) African ancestry. In all, approximately 17,000 samples were genotyped. Because merging of genetic data was part of the overall goal of the eMERGE Network, the same array and HapMap controls were used at the two genotyping centers to facilitate multiple future quality control (QC) steps.
As part of the eMERGE Network, a QC pipeline was developed by the Genomics Working Group to ensure thorough cleaning of the genotype data (currently di-allelic markers only) (14). This QC process included examination of sample quality and composition (i.e., sex inconsistency checks, sample call rates, sample relatedness, and population stratification), marker quality (i.e., marker call rate, duplicate concordance, minor allele frequency, and Hardy-Weinberg equilibrium), and of batch effects (i.e., average call rates and minor allele frequency per plate) (14). The eMERGE Coordinating Center at Vanderbilt University collaborated with the Genomics Workgroup (consisting of members from each of the five sites, the genotyping facilities, the NHGRI, and the National Center for Biotechnology Information (NCBI)) in the development of the QC pipeline. Each site’s data was subjected to the QC pipeline, resulting in site-specific “clean” datasets for analyses. A description of these procedures, a detailed QC report (14), and the genotype data themselves are accessible through NCBI in the database of Genotypes and Phenotypes (dbGaP), as mandated by the National Institute of Health’s (NIH) data sharing policies (15).
Upon completion of genotyping and QC analyses for each site, the eMERGE Coordinating Center was charged with the task of merging the seven datasets (five primarily European-ancestry datasets (one from each site) and two African-ancestry datasets (one each from Vanderbilt and Northwestern Universities)). The merged dataset offered greater power for site-specific tests of association of the primary phenotype or trait of interest because of the increase in sample size. Across the network, the merged dataset offered a large sample size from which to define an additional nine phenotypes for network-wide tests of association.
These data, as with all NIH-funded GWAS datasets, are accessible by the research community via dbGaP for replication studies and meta-analyses. These data can be merged with other data for joint analyses or used as controls (15). However, merging the data introduces new challenges. Although each set may have undergone QC independently, these merged data will require additional QC measures to ensure high quality as errors can be introduced in the merging process (shown in subsequent sections). The proper methods to merge clean datasets must be determined to allow for the combination of data generated by different genotyping facilities, with temporal differences as well as platform differences. As described below, merging already clean datasets can be a surprisingly daunting task. In this eMERGE QC project we investigate the issues that arise when merging data on the same platform generated at different genotyping facilities. These include possible strand orientation issues, sample and marker checks, and various batch effects in steps that go beyond those seen in the site-specific QC pipeline. The goal of this paper is to provide approaches to merge data successfully.
Quality Control Pipeline for Merged Data
Strand Orientation
Like the original QC pipeline used, PLINK and PLATO software were used for most of the merged QC analyses (14,16,17). When creating a merged dataset, an important issue is the choice in strand orientation for the presentation of alleles in genotype calls (i.e., forward or reverse orientation with respect to a genome build). By convention, the forward strand tends to be used. With the periodic re-assembly of the genome and the possibility of a SNP’s reference sequence changing orientation, Illumina (San Diego, CA) developed a method known as “TOP/BOT” strand that relies solely on the local sequence of a SNP and its flanks. This designation is based on the given polymorphism’s alleles or on the surrounding sequence for certain polymorphisms and is intended to make all SNP alleles unambiguous (i.e., for A/T or C/G SNPs) (http://www.illumina.com/documents/products/technotes/technote_topbot.pdf). The NCBI database of genetic variation (dbSNP) lists the TOP/BOT designation for all sub-SNP entries (15). The“TOP/BOT” strand designation was used for these datasets to promote consistency across the eMERGE network; namely by listing all alleles on the TOP strand. It must be noted that allele strand orientation is not guaranteed to be consistent across datasets in dbGaP. Thus, a priori knowledge of the designation used is essential for rapid and accurate merging of multiple datasets.
The forward/reverse and “TOP/BOT” nomenclatures are not mutually exclusive. Some of the SNPs will have the same genotype calls in both the forward/reverse and the “TOP/BOT” orientations. Moreover, given that current SNP-based BeadChips are strictly di-allelic or intensity-only probes, many strand flips will be detectable because there will be more than two nucleotides present at a locus in a merged set. But, for a fraction of the SNPs, if datasets with different orientations are merged, it may not be initially apparent that there are issues related to orientation.
The genotyping centers that generated the data in eMERGE released the data to the sites using different file formats. Broad released single sample files and PLINK files; the Coordinating Center worked from the PLINK files. CIDR released single sample files, which were then converted to PLINK files by the Coordinating Center. These PLINK files from the different centers were used to create version 1 of the merged dataset using data from four study sites (the fifth site was still in genotyping production), and the initial QC merged analyses did not detect issues with the merged genotype file. However, when population stratification was investigated using Eigenstrat (18), a clear separation was observed between Marshfield and Group Health samples (genotyped at CIDR) from Mayo and Vanderbilt samples (genotyped at the Broad) (Figure 1). To investigate the effect of this dispersion, tests of association were performed for one of the primary outcomes. Over 200 random genome-wide significant associations were observed across the genome (Figure 2). These association signals were absent of expected linkage disequilibrium (LD) patterns, which suggested that the results of these tests of association were false positives. Upon review of these plots, specific SNPs were extracted for investigation and the source of error was determined. Two of the datasets were reported FORward alleles (i.e. forward/reverse designation) and two of the datasets were reported TOP alleles (i.e. using ‘TOP/BOT’ designation).
Figure 1.
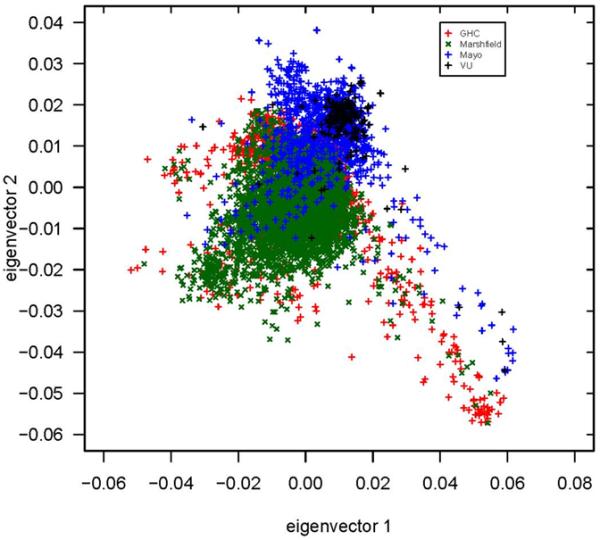
Principal components analysis (comparing eigenvector 1 vs. eigenvector 2 using Eigenstrat) color-coded by eMERGE site (prior to strand fix and prior to merging the Northwestern “clean” dataset). The tail observed was originally thought to be the non-European American samples. The green “x” and red “+” correspond to Marshfield and Group Health samples, respectively, which were genotyped at CIDR; the blue “+” and black “+” correspond to Mayo and Vanderbilt samples, respectively, which were genotyped at the Broad.
Figure 2.
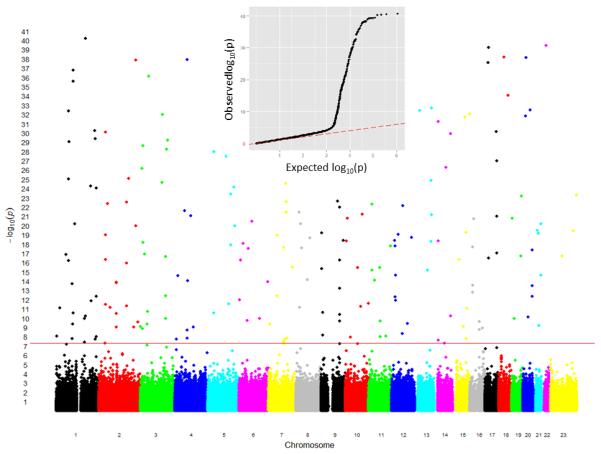
Manhattan plot showing test of association results for a merged dataset (prior to strand fix). The x-axis corresponds to the each genotyped SNP along the genome; the y-axis corresponds to the -log (p-value). The red line indicated genome-wide significance. The q-q plot (top) illustrates that there are many more significant results (black line) than it expected by chance (red dotted line).
Given the thorough eMERGE QC procedures, it was concerning that these strand orientation issues were not detected earlier in the merging process. To investigate, the following items were explored:
Evaluate concordance of HapMap samples
Inspection of original source file strand designation
Random allele frequency comparisons
These tests uncovered not only the source of the strand orientation issue, but also several other important points. First, when evaluating HapMap concordance, it is critical to do across-study-site HapMap comparisons (Figure 3). In this instance, we are describing HapMap control samples genotyped in different laboratories, but depending on the study design, these could be other known control samples. For eMERGE I, both genotyping laboratories used some of the same HapMap controls (one per plate at the Broad, two per plate at CIDR), such that concordance could be evaluated between genotyping centers. The initial QC concordance tests had been performed within site and so would not have identified a strand issue. However, once the across-study-site comparisons were performed, strand definition issues became evident. Second, upon careful inspection of the PLINK files, it was apparent that these were created using different strand designations. Thus, it would have been beneficial to merge files from the individual sample files, rather than the PLINK files if possible. Finally, upon comparison of allele frequencies for a random set of SNPs, the strand issues became quite clear. As such, these three QC steps should be an important component of data set merging.
Figure 3.
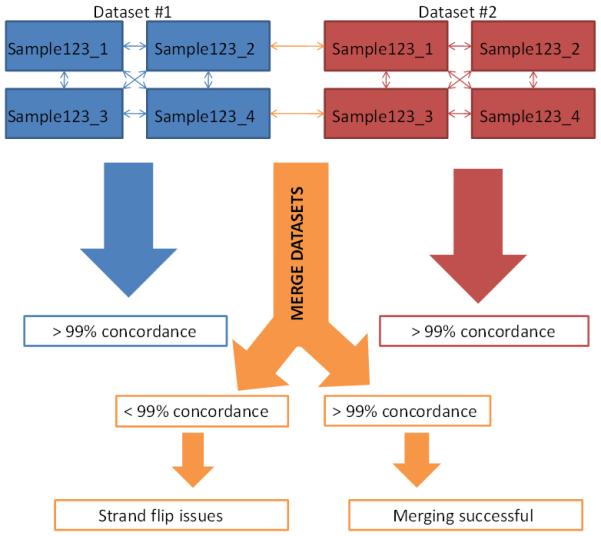
Flowchart illustrating concordance checks for HapMap and duplicate samples within each dataset (i.e. Dataset #1 (blue) and #2 (red)) and complications that can arise in a merged dataset (orange) if there are strand issues.
With the strand orientation issue resolved, the five datasets were merged (version 2). eMERGE QC pipeline procedures were then initiated to first ensure that the findings of the merged dataset were consistent with the original findings found in each individual site’s QC report. Additional steps were added to examine our finding across the different datasets. Figure 4 illustrates the Manhattan plot after the strand orientation issue was resolved.
Figure 4.
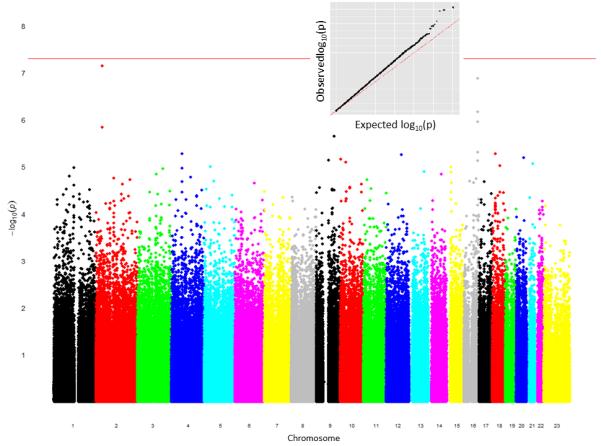
Manhattan plot showing test of association results for a merged dataset (after the strand fix). The x-axis corresponds to the each genotyped SNP along the genome; the y-axis corresponds to the -log (p-value). The red line indicated genome-wide significance. The q-q plot (top) illustrates that there are a few more significant results (black line) than it expected by chance (red dotted line).
Sample checks
Most of what was observed in the merged dataset was consistent with what was found in the individual dataset QC process (13). The unique elements that emerged for sample QC include sample relatedness and population stratification.
We investigated sample relatedness using the --genome option in PLINK, which calculates pairwise kinship estimates based on the proportion of loci where each pair of individuals shares 0, 1, and 2 alleles identical by descent (IBD) (16). We followed the same procedure as the single-site eMERGE QC pipeline and used 100,000 good quality, independent markers (i.e. we removed SNPs with low call rates, low minor allele frequencies, and SNPs in high LD with one another) to compute stable kinship estimates (14). Using these guidelines, we can provide evidence for plausible relationships in our dataset. We performed this step for the merged dataset and compared our relationships to our initial QC steps for each individual study. We found the same relative pairs within each dataset, and additional evidence for several related pairs where pair members were from different sites (Figure 5). The data shows 6 inferred across-site related pairs: 3 full siblings and 3 half-sibling/avuncular pairs (Table 1).
Figure 5.
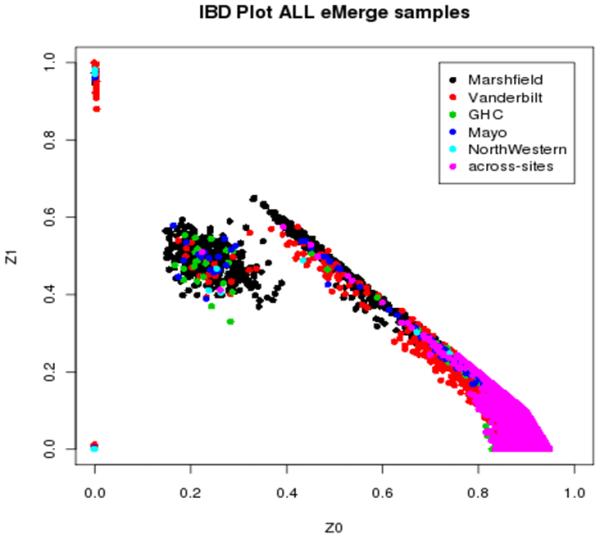
Identical by descent (IBD) plot from merged dataset illustrating the proportion of SNPs that are shared between each pair-wise group of samples (represented by a dot on the plot). Z0 corresponds to the sharing of 0 alleles between each pair. Z1 corresponds to the sharing of 1 allele between each pair. The pairs at (0,0) correspond to duplicate pairs who share 2 alleles in common.
Table 1.
List of observed related samples based on IBD estimates across eMERGE sites
| FID | DECADE BIRTH | FID | DECADE BIRTH | Suggestion | Sites |
|---|---|---|---|---|---|
| 1 | 1920’s | 7 | 1950’s | Full Sibs | Marshfield & Vanderbilt |
| 2 | 1930’s | 8 | 1930’s | Full Sibs | Marshfield & Mayo |
| 3 | 1920’s | 9 | 1930’s | Full Sibs | Marshfield & Group Health |
| 4 | 1940’s | 10 | 1930’s | Half Sibs? | Marshfield & Mayo |
| 5 | 1940’s | 11 | 1930’s | Half Sibs? | Marshfield & Mayo |
| 6 | 1920’s | 12 | 1960’s | Half Sibs? | Marshfield & Mayo |
Vanderbilt and Northwestern contributed samples to various eMERGE sites to increase the sample size for the sites’ primary phenotypes; thus, additional related pairs (that were not genotyped as part of the same study initially) were identified among these two biobanks’ samples. We found 13 full sibling pairs, 23 half-sibling/avuncular pairs, and 12 parent-offspring pairs across the merged dataset. Also, we identified eight unreported pairs of monozygotic twins/duplicates among the Vanderbilt samples. When we examined Vanderbilt’s Synthetic Derivative, six of these duplicates were determined to be the same subject with different study ID numbers (10). One pair was determined to be the same subject with two different medical record numbers. The last pair indicated two different subjects associated with different decades of birth indicating a possible sample handling error. The sample with the lowest call rate from each duplicate pair was removed, except both subjects from the last duplicate pair were removed since the identity of the sample was in question.
It is not uncommon to identify duplicates (with different IDs) or related samples across datasets. For eMERGE, this was anticipated as three of the sites (Marshfield, Mayo Clinic, and Northwestern University) are in relatively close geographical proximity to one another and therefore may lead to a situation where an individual is enrolled in multiple biobanks. Even though each individual study likely identified plausible relationship pairs in its dataset, it is vital to examine relatedness across merged datasets to ensure samples are independent. There likely may only be a trivial number of samples identified, but there is the rare occasion when one dataset may contain a significant subset of samples from another dataset, which could inflate the risk estimates (if more cases are overlapping) or create more noise by reducing the risk estimates (if more controls are overlapping).
Another QC step is investigation of population stratification (18,19). In the merged dataset, about 14,000 samples were classified (i.e., either self-reported or third-party assigned) as being of European ancestry. We used Eigenstrat on this set of samples to examine population stratification using only SNPs that were ancestry informative (continentally informative) based on the Illumina Test Panel (Figure 6) (18,20). We observed that using ancestry informative markers (AIMs) gave comparable results to using a random larger set of SNPs in less amount of computational time. Given the magnitude of the dataset and the various geographic regions of these samples, Figure 6 shows a large, loose clustering of samples. Although the plot appears to be tightly clustered, given the size of the cluster, there is likely some degree of population stratification even among the European ancestry samples in our dataset. Further evidence of population stratification is notable when we examine batch effects across the eMERGE sites (see Batch Effects section).
Figure 6.
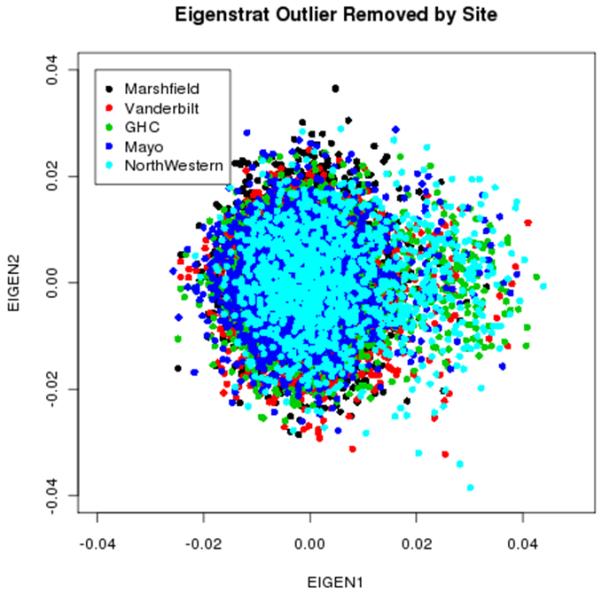
Principal components analysis (comparing eigenvector 1 vs. eigenvector 2 using Eigenstrat) color-coded by eMERGE site (after the strand fix). The non-European American samples were removed in the analysis, thus, no tail is observed as in Figure 1.
The question remains how to statistically handle this population stratification. Traditional epidemiologic studies with various ancestry groups adjust the analyses using a race indicator variable. However, these are all European ancestry samples; thus, using the principal components computed in Eigenstrat may be the best solution for controlling for the diversity within the European ancestry group (i.e. different regions of Europe: southeastern vs. northwestern Europeans) (18). When dealing with larger datasets (i.e. various datasets merged together), population stratification within ancestry groups may become non-trivial and should be considered in analyses to decrease spurious associations (21).
Marker Checks
As with the sample QC checks, we also followed the previously established eMERGE QC pipeline for marker checks, including efficiency checks (call rates), minor allele frequencies (MAF), and Hardy-Weinberg equilibrium (HWE) analyses (14). As mentioned previously, this merged dataset was genotyped at two different genotyping centers, and both centers fail a small proportion of SNPs but each used different criteria to determine these failures. The failures are dataset-specific even within a center so any particular SNP might fail for only one dataset. When merging datasets, if one SNP fails in one of the datasets, then the marker genotyping efficiency will likely be lower than the established threshold because the denominator (total SNPs attempted) differs between substudies. Figure 7 illustrates this effect indicated by a large proportion of SNPs dropping out simultaneously unlike the smooth curve observed from each individual dataset (Figure 8).
Figure 7.
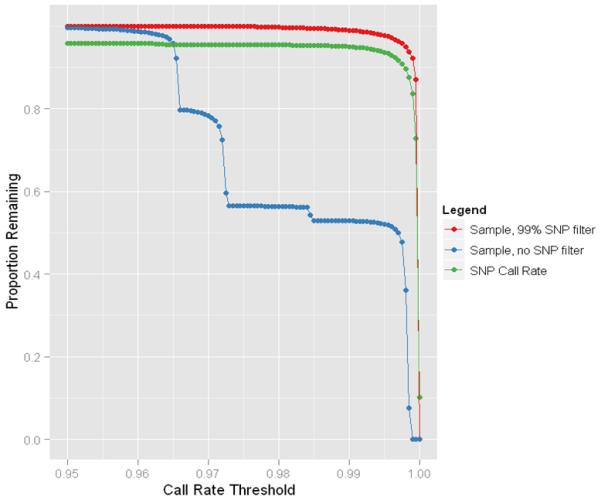
Sample and marker call rates for the raw merged dataset (before filtering SNPs from each dataset below 95% genotyping efficiency and then re-merging the datasets together).
Figure 8.
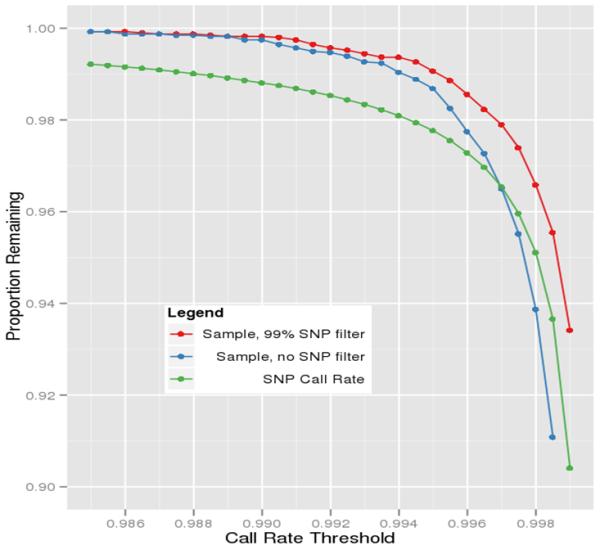
Sample and marker call rates for one of the individual datasets.
To eliminate this marker call rate problem, we initiated the merged QC process using the original datasets and removed all SNPs with call rates < 95% genotyping efficiency from any single study. The datasets were then merged with only high quality genotyping data. Because we wish to only keep SNPs that were successfully genotyped in all datasets, we start out with fewer SNPs in the merged dataset. Following this step, we chose a genotyping threshold of 99% for the merged dataset (i.e. genotyping efficiency over 99% in all 17,753 samples). For our merged dataset, 5.9% of SNPs (SNPs from the 660W) were eliminated for having efficiencies under the threshold, and all SNPs unique to the 1M SNP chip were removed for QC as only about 2,300 samples had genotyping data for these SNPs. This resulted in 528,179 SNPs in 17,753 samples.
Next, minor allele frequencies were investigated. As expected, not as many SNPs were removed for being monomorphic from the merged dataset as from each individual site’s dataset. After applying the 99% SNP genotyping threshold, only one SNP had MAF <0.0001. With more samples and ancestry groups genotyped, there are likely to be at least one or two minor alleles for SNPs with very low MAFs present.
In contrast to the MAF analysis, the number of SNPs out of Hardy-Weinberg equilibrium was expected to be larger given that multiple ancestry groups are present (22). As expected, when all ancestries are jointly considered, about a third of the SNPs are out of HWE at a p-value threshold of 10-4 or less (Table 2). This is likely due to population stratification and differing allele frequencies between the various ancestry groups. To address this, we divided the samples into the two main ancestry groups based on self or third-party report: European and African ancestries. Once we did this and removed the SNPs with <99% call rates, there were <1% SNPs out of HWE at a p-value <10-4 threshold in both groups (Table 2). As is often observed in GWAS data, this count (n= 4,393) still exceeded expectations and is attributed to population stratification within the ancestry groups, long-range linkage disequilibrium, selection bias, and/or technical problems with the SNP assay(s).
Table 2.
List of the number of SNPs out of Hardy-Weinberg Equilibrium in the overall merged dataset (not race-stratified), samples, and 2,308 African American samples.
| Overall (not race-stratified) | 14,127 European American samples | 2,308 African American samples | |||||||
|---|---|---|---|---|---|---|---|---|---|
| p-Value Threshold |
# SNPs Below Threshold |
Expected # Below Threshold |
Excess # SNPs Below Threshold |
# SNPs Below Threshold |
Expected # Below Threshold |
Excess # SNPs Below Threshold |
# SNPs Below Threshold |
Expected # Below Threshold |
Excess # SNPs Below Threshold |
| 0.05 | 299770 | 26409 | 273361 | 46904 | 26409 | 20495 | 43018 | 26409 | 16609 |
| 1.00E-02 | 250920 | 5282 | 245638 | 17716 | 5282 | 12434 | 14946 | 5282 | 9664 |
| 1.00E-03 | 207066 | 528 | 206538 | 7047 | 528 | 6519 | 5664 | 528 | 5136 |
| 1.00E-04 | 178598 | 53 | 178545 | 4393 | 53 | 4340 | 3556 | 53 | 3503 |
| 1.00E-05 | 158300 | 5 | 158295 | 3256 | 5 | 3251 | 2759 | 5 | 2754 |
| 1.00E-06 | 142916 | 1 | 142916 | 2629 | 1 | 2628 | 2307 | 1 | 2306 |
| 1.00E-07 | 130738 | 0 | 130738 | 2231 | 0 | 2231 | 1996 | 0 | 1996 |
Population stratification, reflected by the excess number of SNPs out of HWE, can bias results. Eliminating SNPs with very low HWE p-values (such as 10-4 threshold) and verifying that any significant SNPs from the association analysis are in HWE (i.e. check p-values for HWE after association p-values) are ways to decrease potentially spurious results. At the very least, SNPs with HWE p-values <10-4 should be flagged for manual investigation if these emerge as significant associations in the study.
Batch Effects
The eMERGE QC pipeline illustrated the importance of checking for batch effects among larger studies that have to be broken up into smaller “batches” of samples for genotyping in the lab (14,23). For each study, samples were randomized within lab batch on variables that were thought to be important in analysis, including case/control status, sex, race, age, and BMI. By randomizing these variables, we hoped to control for possible confounders if gross differences in the metrics for the batches (i.e. sample plates) should occur. By testing serially each plate individually against all other plates (Table 3), we examined the average minor allele frequencies and average call rates (% missing genotypes and log missing genotypes) across all SNPs to investigate potential batch effects. We tested independence of allele frequency with plate membership and compared the distribution of chi-square (χ2) statistics to the null distribution (average p-Value for all SNPs and # SNPs p<0.0001)(14). As shown in Table 3, there are clearly differences across the studies with Vanderbilt-1M and Northwestern-1M having the largest number of SNPs with chi-square p-values <0.0001. This is not surprising given these studies include exclusively African Americans and the other studies are more heterogeneous.
Table 3.
Batch effects for the merged dataset using each study as its own "batch."
| Raw (561490 SNPs :17753 samples) | 99% SNP filter (528179 SNPs :17753 samples) | ||||||||
|---|---|---|---|---|---|---|---|---|---|
| Study | N | Average p value for all SNPs |
# SNPs p<0.0001 |
Average % missing genotypes |
Log10 missing genotypes |
Average p value for all SNPs |
# SNPs p<<0.0001 |
Average % missing genotypes |
Log10 missing genotypes |
| Marshfield | 3972 | 0.092 | 316924 | 0.005 | −2.325 | 0.091 | 299143 | 0.0003 | −3.578 |
| Group Health | 3325 | 0.151 | 190429 | 0.004 | −2.427 | 0.151 | 175982 | 0.0002 | −3.815 |
| Mayo | 3405 | 0.101 | 291799 | 0.029 | −1.542 | 0.103 | 268676 | 0.0009 | −3.066 |
| Vanderbilt-IM | 498 | 0.046 | 435582 | 0.017 | −1.763 | 0.047 | 408068 | 0.0007 | −3.143 |
| Vanderbilt-660W | 2697 | 0.121 | 252274 | 0.034 | −1.468 | 0.124 | 228085 | 0.0008 | −3.077 |
| Northwestern-1M | 1656 | 0.024 | 495919 | 0.022 | −1.650 | 0.025 | 465132 | 0.0005 | −3.295 |
| Northwestern-660W | 1851 | 0.182 | 153492 | 0.040 | −1.401 | 0.188 | 128665 | 0.0010 | −2.993 |
For the merged dataset, it seemed likely that population stratification for one plate versus all other plates across all studies would show gross differences in allele frequencies, and we had not detected any significant batch effects within each individual study. Thus, we concluded that examining “study” effects was a better analysis for a large merged dataset. We examined average call rates and minor allele frequencies across each eMERGE site’s original dataset. However, we already had evidence that the merged dataset had significant population stratification, which we observed when we examined allele frequencies and p-values for SNPs per study, especially between the two earliest-completed studies (Marshfield and Vanderbilt) (Table 3). The earliest dataset genotyped (Marshfield Clinic) contained many more related samples than the rest of the datasets; thus, a member from each first degree relative was removed from our dataset for the batch effect analyses. When this did not eliminate the effect we observed, we considered only a tighter cluster of samples of European ancestry. Even with a tighter clustering of samples, we still observed the same two studies have more significant results (Table 4). Removing SNPs < 99% genotyping efficiency and using a tighter cluster of samples of European ancestry eliminates most of the batch effects from these two datasets, though still not entirely (Table 4).
Table 4.
Batch effects for the merged dataset minus Marshfield related individuals and using a tighter European clustered group. Each study using samples of European descent was treated as a “batch.”
| Raw (561490 SNPs :13028 “European American cluster minus cataract relateds” samples) |
99% SNP filter (528179 SNPs :13028 “European American cluster minus cataract relateds” samples) |
||||||||
|---|---|---|---|---|---|---|---|---|---|
| Study | N | Chi- square count p<0.0001 |
Logistic regression adjusted with pc1/age/sex count p<0.0001 |
Average % missing genotypes |
Log10 missing genotypes |
Chi- square count p<0.0001 |
Logistic regression adjusted with pc1/age/sex count p<0.0001 |
Average % missing genotypes |
Log10 missing genotypes |
| Marshfield | 2996 | 5068 | 2254 | 0.0047 | −2.323 | 2409 | 2130 | 0.0003 | −3.571 |
| Group Health | 3030 | 3340 | 288 | 0.0037 | −2.428 | 235 | 227 | 0.0001 | −3.846 |
| Mayo | 3132 | 16530 | 341 | 0.0287 | −1.542 | 539 | 307 | 0.0009 | −3.066 |
| Vanderbilt-660W | 2540 | 21596 | 1362 | 0.0340 | −1.468 | 2490 | 1321 | 0.0008 | −3.073 |
| Northwestern- 660W | 1330 | 25878 | 547 | 0.0398 | −1.400 | 3543 | 526 | 0.0011 | −2.960 |
Discussion
We have expanded the single-site eMERGE QC pipeline (14) to include additional steps to be used when merging datasets either for replication, higher-powered studies, or meta-analysis (see Figure 9). Taking “clean” datasets and merging them together is a non-trivial, time-consuming task (24,25). Various other consortia have developed important QC and quality assurance (QA) pipelines to ensure thorough cleaning of data, especially GWAS data (23,26,27). These processes should not be neglected nor marginalized, as they help to reduce the number of false positive and false negative results. The best place to start is with a good study design. At the inception of the eMERGE network, we anticipated merging our datasets, thus, we included various safeguards to reduce the number of complications that could occur (for example: the same HapMap controls were genotyped across the studies to check for concordance, the same Illumina BeadChip was used for majority of our samples, and the majority of our samples are of the same ancestry group (European descent)).
Figure 9.

Flowchart illustrating additional QC steps when merging several datasets
We illustrate here a less complex merging of datasets than might be the case in other pooled studies, including data pooled from dbGaP. Merging genotype data from various centers across different platforms creates additional complications and may require imputation. Likewise, merging phenotype data across studies also has its complexities. Other groups are developing phenotype harmonization methods for ease of merging phenotype data (PhenX and PAGE) (28,29).
Quality control analyses had already been performed on each individual dataset, which was an important check when doing these analyses on the merged dataset. When pooling GWAS data, we have demonstrated that thorough cleaning of the individual datasets prior to merging, and then cleaning of the combined dataset once merged, are essential to obtaining good quality data. Establishing that strand orientation of alleles is consistent among datasets prior to merging is an important first step. Once merged, investigation of kinship coefficients is important to check for unintended duplicates or related pairs across datasets.
Following QC of the merged dataset, genetic analyses will be conducted within eMERGE-I to identify variants associated with fourteen phenotypes using subsets of individuals with each of the case and control definitions for the phenotypes available. Given the demographics, the merged dataset will likely be split into two populations for application of stratified regression analyses: European ancestry and African ancestry. QC procedures, such as Eigenstrat, batch effects, and HWE analysis, will need to be performed on the subsets used for each particular phenotype to adjust for principal components, to ensure associations findings are not confounded by which studies the samples came from, and to ensure associated SNPs are not grossly out of HWE, respectively.
When extracting subsets of samples for additional phenotype association studies, it is important to examine the distribution of samples among the different studies. Pulling the majority of samples from one of these two studies (Marshfield or Vanderbilt-660W) could lead to spurious results as observed in the batch effect analyses. In other words, if the proportion of cases and controls differ by site, an association observed could be a result of a batch effect instead of a true effect.
Through the eMERGE network, we have learned a significant amount of detail about large-scale quality control to ensure data integrity. In particular, merging datasets for joint analysis introduced interesting, unanticipated subtleties. We identified some potential points of concern when merging datasets as well as approaches to address these (Figure 9). Such approaches will become even more important as we venture increasingly more into all the possibilities offered by dbGaP. With careful merging of datasets, we enable an increase in sample size, and likewise power to detect genetic associations and improve our understanding of the genetic architecture of complex traits.
Reference List
- 1.Manolio TA. Genomewide association studies and assessment of the risk of disease. N. Engl. J. Med. 2010;363:166–176. doi: 10.1056/NEJMra0905980. [DOI] [PubMed] [Google Scholar]
- 2.Klein RJ, Zeiss C, Chew EY, Tsai JY, Sackler RS, Haynes C, Henning AK, SanGiovanni JP, Mane SM, Mayne ST, et al. Complement factor H polymorphism in age-related macular degeneration. Science. 2005;308:385–389. doi: 10.1126/science.1109557. [DOI] [PMC free article] [PubMed] [Google Scholar]
- 3.Pritchard JK. Are rare variants responsible for susceptibility to complex diseases? Am. J. Hum. Genet. 2001;69:124–137. doi: 10.1086/321272. [DOI] [PMC free article] [PubMed] [Google Scholar]
- 4.Pritchard JK, Cox NJ. The allelic architecture of human disease genes: common disease-common variant…or not? Hum. Mol. Genet. 2002;11:2417–2423. doi: 10.1093/hmg/11.20.2417. [DOI] [PubMed] [Google Scholar]
- 5.Reich DE, Lander ES. On the allelic spectrum of human disease. Trends Genet. 2001;17:502–510. doi: 10.1016/s0168-9525(01)02410-6. [DOI] [PubMed] [Google Scholar]
- 6.Teslovich TM, Musunuru K, Smith AV, Edmondson AC, Stylianou IM, Koseki M, Pirruccello JP, Ripatti S, Chasman DI, Willer CJ, et al. Biological, clinical and population relevance of 95 loci for blood lipids. Nature. 2010;466:707–713. doi: 10.1038/nature09270. [DOI] [PMC free article] [PubMed] [Google Scholar]
- 7.Denny JC, Ritchie MD, Crawford DC, Schildcrout JS, Ramirez AH, Pulley JM, Basford MA, Masys DR, Haines JL, Roden DM. Identification of Genomic Predictors of Atrioventricular Conduction. Using Electronic Medical Records as a Tool for Genome Science. Circulation. 2010 doi: 10.1161/CIRCULATIONAHA.110.948828. [DOI] [PMC free article] [PubMed] [Google Scholar]
- 8.Kullo IJ, Ding K, Jouni H, Smith CY, Chute CG. A genome-wide association study of red blood cell traits using the electronic medical record. PLoS One. 2010;5 doi: 10.1371/journal.pone.0013011. [DOI] [PMC free article] [PubMed] [Google Scholar]
- 9.Ritchie MD, Denny JC, Crawford DC, Ramirez AH, Weiner JB, Pulley JM, Basford MA, Brown-Gentry K, Balser JR, Masys DR, et al. Robust replication of genotype-phenotype associations across multiple diseases in an electronic medical record. Am. J. Hum. Genet. 2010;86:560–572. doi: 10.1016/j.ajhg.2010.03.003. [DOI] [PMC free article] [PubMed] [Google Scholar]
- 10.Roden DM, Pulley JM, Basford MA, Bernard GR, Clayton EW, Balser JR, Masys DR. Development of a large-scale de-identified DNA biobank to enable personalized medicine. Clin Pharmacol. Ther. 2008;84:362–369. doi: 10.1038/clpt.2008.89. [DOI] [PMC free article] [PubMed] [Google Scholar]
- 11.Turner SD, Berg RL, Linneman JG, Peissig PL, Crawford DC, Denny JC, Roden DM, McCarty CA, Ritchie MD, Wilke RA. Knowledge-Driven Multi-Locus Analysis Reveals Gene-Gene Interactions Influencing HDL Cholesterol Level in Two Independent EMR-Linked Biobanks. PLoS. ONE. 2011;6:e19586. doi: 10.1371/journal.pone.0019586. [DOI] [PMC free article] [PubMed] [Google Scholar]
- 12.Kullo IJ, Fan J, Pathak J, Savova GK, Ali Z, Chute CG. Leveraging informatics for genetic studies: use of the electronic medical record to enable a genome-wide association study of peripheral arterial disease. J Am Med. Inform. Assoc. 2010;17:568–574. doi: 10.1136/jamia.2010.004366. [DOI] [PMC free article] [PubMed] [Google Scholar]
- 13.McCarty CA, Chisholm RL, Chute CG, Kullo IJ, Jarvik GP, Larson EB, Li R, Masys DR, Ritchie MD, Roden DM, et al. The eMERGE Network: a consortium of biorepositories linked to electronic medical records data for conducting genomic studies. BMC. Med. Genomics. 2011;4:13. doi: 10.1186/1755-8794-4-13. [DOI] [PMC free article] [PubMed] [Google Scholar]
- 14.Turner S, Armstrong LL, Bradford Y, Carlson CS, Crawford DC, Crenshaw AT, de AM, Doheny KF, Haines JL, Hayes G, et al. Quality control procedures for genome-wide association studies. Curr. Protoc. Hum. Genet. 2011 doi: 10.1002/0471142905.hg0119s68. Chapter 1, Unit1. [DOI] [PMC free article] [PubMed] [Google Scholar]
- 15.Mailman MD, Feolo M, Jin Y, Kimura M, Tryka K, Bagoutdinov R, Hao L, Kiang A, Paschall J, Phan L, et al. The NCBI dbGaP database of genotypes and phenotypes. Nat. Genet. 2007;39:1181–1186. doi: 10.1038/ng1007-1181. [DOI] [PMC free article] [PubMed] [Google Scholar]
- 16.Purcell S, Neale B, Todd-Brown K, Thomas L, Ferreira MA, Bender D, Maller J, Sklar P, de Bakker PI, Daly MJ, Sham PC. PLINK: a tool set for whole-genome association and population-based linkage analyses. Am. J. Hum. Genet. 2007;81:559–575. doi: 10.1086/519795. [DOI] [PMC free article] [PubMed] [Google Scholar]
- 17.Sexton DP, McCauley JL, Giles JT, Bush WS, Bradford Y, Haines JL. The Whole-genome Association Study Pipeline (WASP): A Comprehensive Tool for Large-Scale Association Stuides. Am J Hum Genet. 2007;57:413S. [Google Scholar]
- 18.Price AL, Patterson NJ, Plenge RM, Weinblatt ME, Shadick NA, Reich D. Principal components analysis corrects for stratification in genome-wide association studies. Nat. Genet. 2006;38:904–909. doi: 10.1038/ng1847. [DOI] [PubMed] [Google Scholar]
- 19.Pritchard JK, Stephens M, Donnelly P. Inference of population structure using multilocus genotype data. Genetics. 2000;155:945–959. doi: 10.1093/genetics/155.2.945. [DOI] [PMC free article] [PubMed] [Google Scholar]
- 20.Dumitrescu L, Ritchie MD, Brown-Gentry K, Pulley JM, Basford M, Denny JC, Oksenberg JR, Roden DM, Haines JL, Crawford DC. Assessing the accuracy of observer-reported ancestry in a biorepository linked to electronic medical records. Genet. Med. 2010;12:648–650. doi: 10.1097/GIM.0b013e3181efe2df. [DOI] [PMC free article] [PubMed] [Google Scholar]
- 21.Moscou S, Anderson MR, Kaplan JB, Valencia L. Validity of racial/ethnic classifications in medical records data: an exploratory study. Am. J. Public Health. 2003;93:1084–1086. doi: 10.2105/ajph.93.7.1084. [DOI] [PMC free article] [PubMed] [Google Scholar]
- 22.Balding DJ. A tutorial on statistical methods for population association studies. Nat. Rev. Genet. 2006;7:781–791. doi: 10.1038/nrg1916. [DOI] [PubMed] [Google Scholar]
- 23.Pluzhnikov A, Below JE, Konkashbaev A, Tikhomirov A, Kistner-Griffin E, Roe CA, Nicolae DL, Cox NJ. Spoiling the whole bunch: quality control aimed at preserving the integrity of high-throughput genotyping. Am. J. Hum. Genet. 2010;87:123–128. doi: 10.1016/j.ajhg.2010.06.005. [DOI] [PMC free article] [PubMed] [Google Scholar]
- 24.Alberts B. Editorial expression of concern. Science. 2010;330:912. doi: 10.1126/science.330.6006.912-b. [DOI] [PubMed] [Google Scholar]
- 25.Sebastiani P, Solovieff N, Puca A, Hartley SW, Melista E, Andersen S, Dworkis DA, Wilk JB, Myers RH, Steinberg MH, et al. Genetic Signatures of Exceptional Longevity in Humans. Science. 2010 doi: 10.1126/science.1190532. [DOI] [PubMed] [Google Scholar]
- 26.Laurie CC, Doheny KF, Mirel DB, Pugh EW, Bierut LJ, Bhangale T, Boehm F, Caporaso NE, Cornelis MC, Edenberg HJ, et al. Quality control and quality assurance in genotypic data for genome-wide association studies. Genet. Epidemiol. 2010;34:591–602. doi: 10.1002/gepi.20516. [DOI] [PMC free article] [PubMed] [Google Scholar]
- 27.Han B, Hackel BM, Eskin E. Postassociation cleaning using linkage disequilibrium information. Genet. Epidemiol. 2011;35:1–10. doi: 10.1002/gepi.20544. [DOI] [PubMed] [Google Scholar]
- 28.Matise TC, Ambite JL, Buyske S, Carlson CS, Cole SA, Crawford DC, Haiman CA, Heiss G, Kooperberg C, Le Marchand L, et al. Population Architecture using Genetics and Epidemiology. Am J Epidemiol. 2011 doi: 10.1093/aje/kwr160. [DOI] [PMC free article] [PubMed] [Google Scholar]
- 29.Stover PJ, Harlan WR, Hammond JA, Hendershot T, Hamilton CM. PhenX: a toolkit for interdisciplinary genetics research. Curr. Opin. Lipidol. 2010;21:136–140. doi: 10.1097/MOL.0b013e3283377395. [DOI] [PMC free article] [PubMed] [Google Scholar]