


Abstract
Single-nucleotide polymorphisms (SNPs) are often linked to critical phenotypes such as diseases or responses to vaccines, medications and environmental factors. However, the specific molecular mechanisms by which a causal SNP acts is usually not obvious. Changes in RNA secondary structure emerge as a possible explanation necessitating the development of methods to measure the impact of single-nucleotide variation on RNA structure. Despite the recognition of the importance of considering the changes in Boltzmann ensemble of RNA conformers in this context, a formal method to perform directly such comparison was lacking. Here, we solved this problem and designed an efficient method to compute the relative entropy between the Boltzmann ensembles of the native and a mutant structure. On the basis of this theoretical progress, we developed a software tool, remuRNA, and investigated examples of its application. Comparing the impact of common SNPs naturally occurring in populations with the impact of random point mutations, we found that structural changes introduced by common SNPs are smaller than those introduced by random point mutations. This suggests a natural selection against mutations that significantly change RNA structure and demonstrates, surprisingly, that randomly inserted point mutations provide inadequate estimation of random mutations effects. Subsequently, we applied remuRNA to determine which of the disease-associated non-coding SNPs are potentially related to RNA structural changes.
INTRODUCTION
Genotype–phenotype association studies continue to provide ever larger sets of single-nucleotide polymorphisms (SNPs) linked to diseases or associated with responses to vaccines, medications and environmental factors. Such associations provide an important step in studies of the genetic underpinnings of human diseases. To gain further insight, a deeper understanding of the molecular mechanisms by which SNP affects cell function is necessary. When a SNP is localized within a gene or in the close neighborhood of a gene, then it is generally assumed that it affects the phenotype through changes at the expression level, the function or other properties of this particular gene. However, the molecular mechanisms that lead to the change are usually not obvious. In the case of non-synonymous SNPs, where the underlying mutation occurs in the gene coding region and changes an amino acid, it is usually expected that this amino acid change affects protein function, expression, conformation or stability. However, numerous results point to diseases related to occurrences of SNPs in non-translated regions (1,2) and synonymous SNPs [reviewed in (3)], suggesting that amino acid change is not the sole explanation. In such cases, pinpointing the mechanism responsible for the functional change is considerably more challenging. Possible causes include, among others, structural changes in the RNA transcript that can in turn influence splicing [reviewed in (4)], expression (5,6), stability (7) or translational regulation (8). Interestingly, a recent study indicated that a common amino acid deletion that was long thought to be responsible for cystic fibrosis is coincident with a synonymous mutation that results in a change in messenger RNA (mRNA) structure that may be responsible for the disease (9). There is also statistical evidence for a conserved, local secondary structure in the coding regions of eukaryotic mRNAs and pre-mRNAs (10) and selection for mRNA stability [see (11,12) and references within]. However, the current understanding of the role of SNP-induced RNA structural alterations on phenotypic changes is limited.
To study the effect of SNP-related changes in RNA structure on cell function, it is necessary to have a rigorous and efficient way of measuring the structural changes caused by SNPs. Although there have been several previous attempts to address this question, none of the existing approaches have fully solved the problem. The simplest approach is to compare the minimum free energy structures of the two variants of the polymorphic sequence (13). However, it is necessary to search for changes on all suboptimal secondary structures (14). Structural changes introduced by a SNP are very subtle. A change of one nucleotide is more likely to create a slight change in the energy landscape rather than to produce gross structural changes. To be able to capture such subtle changes, RNA structure should be viewed as an ensemble of possible structures where each structure occurs with a probability defined by the Boltzmann distribution. Consistent with this more precise view, the whole RNA structural ensemble has to be considered in such comparisons (Figure 1). Moving toward ensemble-based methods, Halvorsen et al. (15) developed a program named SNPfold, which computes the Pearson Correlation Coefficient between the nucleotide pairing probabilities of the two sequences. A nucleotide pairing probability is the probability of a given nucleotide forming a base pair with any other nucleotide. This can be readily computed using a program such as RNAfold (16). However, the nucleotide pairing probabilities lose some information about the RNA structural ensemble, and it is possible that two quite different ensembles have similar nucleotide pairing probabilities. In another approach, Johnson et al. (17) quantified the effect of SNPs on mRNA structure by computing the differences in free energy of optimal and suboptimal structures. However, changes in the value of free energy or even partition function do not fully represent the changes in the ensemble structures. A quite different direction has been taken by Waldispuhl et al. (18,19) who developed a method allowing to sample the combined Boltzmann ensemble of all structures for all sequences that differ by k mutations from the reference sequence. They used this approach to study the mutational robustness of the structure considered to be the native structure of the reference sequence. On structure comparison level, sampled structures were compared with the reference structure using the base pair distance. Thus, although this method allows to estimate the robustness for a structure to mutations, it does not provide an approach to measure the distance between two structural ensembles.
Figure 1.

Impact of SNPs on RNA structural ensembles. Both the G32C and C90T SNPs in the 5′-UTR of the L-ferritin (FTL) gene are associated with hereditary hyperferritinemia-cataract syndrome (20,21)]. Projection using multi-dimensional scaling (MDS) of sampled ensembles (22) of wild-type FTL 5-UTR is displayed in blue, the G32C mutant in red and the C90T mutant in green. Each circle represents an RNA secondary structure, and the size of the circle is proportional to the probability of the structure in the corresponding ensemble. A sensitive comparison method should be able to detect that the G32C mutant introduces more drastic changes to the probability distribution than the C90T mutant.
We propose that to measure the impact of a point mutation on RNA structure, one should measure the difference in probability distributions of the wild-type and mutant Boltzmann ensembles. Such differences should be able to capture the emergence of new structural clusters and shifts in energy landscape (Figure 1). In information theory, the well-established measure for comparing probability distributions is relative entropy. Although theoretically logical, it was not obvious how to efficiently compute relative entropy for ensembles of RNA structures. Note that ensemble size grows exponentially with RNA length and enumerating all the elements of such an ensemble is not usually feasible. Thus, a more sophisticated approach was necessary. In this work, we close this gap and provide, remuRNA, an efficient method to compute relative entropy between the wild-type and mutant RNA structural ensembles.
We used remuRNA to compare the impact of SNPs naturally occurring in populations to the impact of point mutations randomly inserted into the RNA sequences. If RNA structure is important for gene function, then inserting a point mutation into a position where it naturally does not occur should, on average, generate more significant changes than changes caused by SNPs naturally occurring in the human population. This is indeed what we found. This result indicates that there is natural selection against SNPs that significantly change RNA structure. This is also an important factor that needs to be taken into account when such random point mutations are used as a background for estimating the prominence of structural changes caused by disease-associated SNPs, as proposed in (15).
Subsequently, we applied remuRNA to examine which of the disease-associated SNPs are potentially related to structural changes in RNA. Although the method applies to any type of RNA sequence, the importance of RNA structure, especially in the 5′-untranslated region (UTR) is very well established and thus studies of non-coding RNA provide a good test of our approach. Although our method pointed to many SNPs previously identified by Halvorsen et al. (15), it also identified many additional SNPs in which RNA structure alteration is a cause for the disease phenotype. We stress, that just as it is in the case of variation in DNA sequence, most variations in mRNA structure are expected to be neutral. These results indicate that the proposed approach is not only mathematically well justified and computationally efficient but also a powerful way to study the impact of SNP-induced RNA structural changes on gene expression and function.
MATERIALS AND METHODS
remuRNA: relative entropy of wild-type and mutant RNA structural ensembles
As explained earlier, to measure the impact of a point mutation on RNA secondary structure, we need to compare two ensembles of structures. An ensemble of structures can be formally seen as a probability distribution over all accessible structures. In the Boltzmann distribution for RNA secondary structure, the probability of a structure s with free energy Gs is proportional to  , where R is the universal gas constant, and T is the temperature. Specifically
  where the partition function Q is the weighted sum over the set S of all possible secondary structures:
  .
.
In probability theory and information theory, the ‘relative entropy’ or the ‘Kullback–Leibler divergence’ is an accepted measure of the difference between two probability distributions. For probability distributions  and
and  over a discrete set of states S, relative entropy is defined as follows:
 |
(1) |
To be able to apply relative entropy to compare the wild-type and mutant RNA structure Boltzmann distributions, they should have the same set of structures in their ensembles. However, there are some structures that exist only in one of the ensembles, as they can form only for one of the sequences. This problem can be naturally resolved by extending the set of possible structures S to the union of the two ensembles as explained later.
The main challenge in calculating the relative entropy between the wild-type and mutant structural ensembles is related to the fact that a natural method relying on enumeration of all structures would require an exponential number of steps, which is not computationally feasible for most RNA sequences. We designed a novel efficient dynamic programming algorithm remuRNA to compute the relative entropy between the wild-type and mutant ensembles. We present the mathematical relationships on which our dynamic program is built in the following subsection.
Dynamic programming algorithm
We use the standard energy model for pseudoknot-free RNA secondary structure—the nearest neighbor thermodynamic energy model (23). In this model, the free energy Gs of a secondary structure s is computed as the sum of free energy  associated with each loop L in the structure s, so the total the free energy of a structure is
  . The possible loop elements of RNA secondary structure are hairpin loops, interior loops (consecutive stacking pairs, bulges and internal loops) and multi-loops (multi-branch loops).
The energy function for a hairpin loop is denoted by  and is a function of the loop size and the nucleotides in the closing base pair. The energy function for an interior loop is denoted by
  and is a function of loop size (0 for stacking pairs), closing base pairs and the fraction of bases in each of its two single-stranded components. For the multi-loop, there are three parameters:
  —the penalty for having the loop (reflecting destabilizing energy of a loop),
  —the penalty for each unpaired base (reflecting the increase of loop entropy with its length) and
  —the penalty for each branch in the multi-loop. We denote the energy function for the multi-loop with b unpaired bases and c branches by
  . Moreover, the energy associated with a subsequence that contains no base pair and is external to all loops is set to be zero, and the energy of an undefined or infeasible substructure is infinite.
Consider a structure  , which has energy
  for wild-type sequence and energy
  for the mutant sequence. We conceptually decompose structure s into two substructures
  and
and  , where
  has the same sequence and, therefore, the same energy value for wild-type and mutant sequences, whereas
  contains the mutated nucleotide that can result in different energy values. Recall that to apply relative entropy, we need to ensure common probability space, therefore we extended the set of possible structures S to the union of the two ensembles. The structures that are added to each ensemble to ensure the common summation set S contain a non-standard base pair whose energy contribution is defined by parameter
  , which must be higher than the energy of a canonical base pair. Here, we set
  . The energy of a substructure with such a non-standard base pair is always higher than the energy of the corresponding substructure with a regular base pair. For example, if such non-standard base pair closes a hairpin, the energy of hairpin loop is equal to the loop size penalty because the energy contribution of a non-standard base pair is set to zero.
With the above definitions, the relative entropy between the wild-type and mutant RNA secondary structure Boltzmann distributions can be expressed as follows:
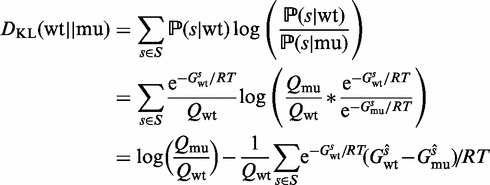 |
(2) |
Thus, given the partition functions  and
and  for the extended ensembles of wild-type and mutant (setting the energy of a non-strandard base pair to
  ), respectively, we need to compute
| (3) |
to calculate the relative entropy  .
.
Our algorithm to compute relative entropy is built on McCaskill’s dynamic programming algorithm (24), the standard algorithm for computing the partition function for RNA secondary structure. McCaskill’s algorithm computes in addition to the partition function, Q, two auxiliary conditional partition functions  and
and  . All three quantities are calculated iteratively for all RNA subsequences [i, j], where i is the first base of the subsequence and j is the last.
  is the partition function with the condition that there is a base pair between nucleotides i and j, and
  with the condition that there is at least one base pair in the structure for subsequence [i, j].
Our algorithm generalizes McCaskill’s algorithm and additionally computes quantities: H,  and
and  (based on Equation 3). As for the partition function Q, in addition to the value
  we compute two auxiliary values
  and
and  with the condition that there is a base pair between nucleotides i and j and that there is at least one base pair in the substructure, respectively. Using dynamic programming, quantities H,
  and
and  are computed for all subsequences [i, j] that contain the mutated nucleotide. It starts from the shortest sequence [i, i], where all quantities are valued zero and proceeds iteratively till it reaches [1, n], which is the full sequence. Note that H for all subsequences [i, j] that do not contain the mutated nucleotide is set to zero. Figure 2 illustrates all possible recursion cases that our algorithm considers to compute H,
  and
and  .
.
Figure 2.

Recursion cases for relative entropy of wild-type and mutant RNA secondary structure Boltzmann distributions when subsequence [i, j] contains the mutated nucleotide. In these recursion diagrams, the horizontal line indicates the phosphate backbone. A red horizontal line indicates it contains the point mutation nucleotide. Dots indicate the indices, and if colored red, the mutation can occur at this boundary position. A solid curved line indicates a base pair, and a dashed curved line encloses a region and denotes its two terminal bases, which may be paired or unpaired. Letter(s) within a region specify a recursive quantity. White regions are recurred over, and blue regions indicate those portions of the secondary structure that are fixed at the current recursion level.
The computation of  (illustrated in the first line in Figure 2) consists of three nontrivial cases. In the first case, an unpaired base is introduced at position i, where it is not the mutated nucleotide. Note that there is no need to consider the case where i is the mutated nucleotide, because in this case it does not have any effect on energy value, and thus the corresponding structure does not contribute to H. In the second and third cases, a base pair is introduced between i and k. In the second case, the mutated nucleotide is located in subsequence [i, k], and in the third case, the mutated nucleotide is located in subsequence [k + 1, j]. Therefore,
| (4) |
The second line in Figure 2 illustrates the recursion cases for computing  . By definition, i and j are base paired. The base pair
  can close different substructures: hairpin loop, interior loop or multi-loop. In addition, we need to accurately differentiate cases with respect to the location of the point mutation. This results in a larger number of possible cases. For simplicity of presentation, we do not show cases dealing with dangling energy (energy from the unpaired bases at the beginning or end of the sequences), as it results in complex recursion cases, which would obscure the presentation. However, dangling energy is implemented in the software. The first case corresponds to the situation where the base pair
  closes a hairpin. The next five cases deal with the situation where the base pair
  closes the interior loop, and in the last three cases, the base pair
  closes a multi-loop. Within the interior loop cases, the more complicated cases 4–6 correspond to the situation where the mutation is in the inner base pair
  . In such a case, the mutation contributes to energy difference in the two adjacent loops one of which is an inner loop and the second is a loop of any of the three possible types. Finally, in the case of a multi-loop (cases 7–9), if the mutation is located in the loop, it does not have any effect on energy value and does not contribute to H. So the three cases correspond to the situation where it is located in one of the branches and thus can contribute to H. Considering all cases in Figure 2,
  is defined as follows:
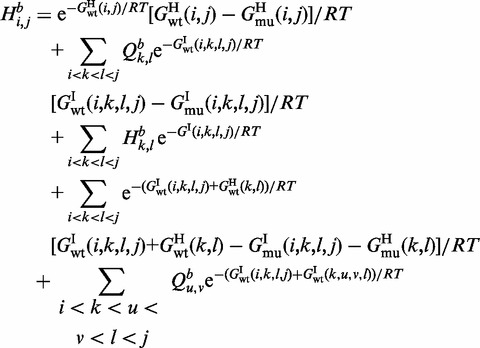 |
 |
(5) |
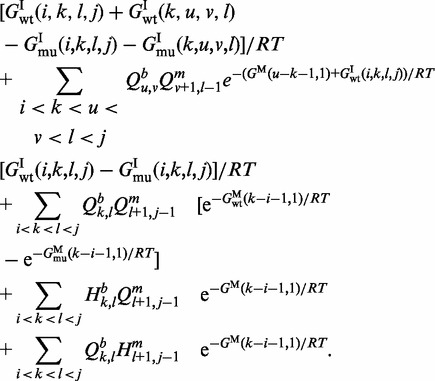
The third line in Figure 2 illustrates recursion cases for computing  assuming the region constitutes at least one base pair. Taking into account the location of the point mutation,
  is defined as follows:
 |
(6) |
To compute each one of the quantities (H,  and
and  ), we expand recursion cases in McCaskill’s algorithm for the corresponding quantity based on the location of mutated nucleotide. It is easy to confirm that recursion cases in our algorithm are all the possible cases and that the cases are disjointed. Thus, our algorithm guarantees considering every possible alteration in the secondary structure exactly once. Similar to McCaskill’s algorithm, we can introduce auxiliary quantity
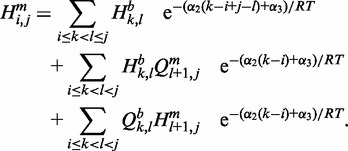
  for substructures in multi-loops that have exactly one branch enclosed by a base pair ending at nucleotide j. Thus, using arguments similar to those for McCaskill’s algorithm, it is not hard to verify the algorithm for relative entropy algorithm has
  time and
  space complexity.
Localized measure
For large mRNA sequences and genome-wide studies, the changes in RNA structure should be studied locally. Thus, one needs to compute the local relative entropy. The localized version of our algorithm computes the average relative entropy for all subsequences of size w that include the mutated nucleotide [similar to (25)].
Data set
We used the UCSC genome browser to retrieve data from the hg19 build of the Human genome (26). The coordinates and alleles of the SNPs were obtained from the ‘Common SNPs(132)’ table. The coordinates in ‘refgene’ and ‘wgRna’ tables were used to map the SNPs to RNA regions. The analyzed SNPs are at least 10 nt away from any transcription or translation start or stop sites. SNPs known to be associated with alternative splicing were not included in this data set. For accuracy, we considered the local version of remuRNA with a window size equal to 150 nucleotides. The SNPs in the data set were categorized as 4439 coding regions, 9094 5′-UTRs, 36 821 3′-UTRs, 3883 non-coding RNAs and 255 miRNAs/snoRNAs.
The data set of disease-associated SNPs that map to the 5′-UTRs of human genes was compiled by Halvorsen et al. (15) from the Human Genetic Mutation Database (27). The data set contains 296 disease-associated SNPs in 206 5′-UTR sequences.
RESULTS
Being able to efficiently measure the impact of SNPs on RNA secondary structure, we wanted to explore their importance on a genome-wide scale. There are a number of studies indicating a key role of RNA structure changing SNPs in diseases. However, are these only isolated cases or is it possible to capture the structural impact of SNPs in a broader context? We hypothesized that if SNP-related RNA structural changes affect gene function, then, on average, common SNPs naturally occurring in human populations should have fewer structural effects than randomly inserted point mutations.
Different types of RNA have different functions and structural features, so they have to be considered separately when testing the above hypothesis. In addition to answering the question above, this provides an opportunity to explore the effect of SNPs on different types of RNA. We studied five categories of SNPs based on their location in RNA sequences. The categories included the coding sequence, the 5′-UTR, 3′-UTR, mi/snoRNA and ncRNA regions (see Supplementary Data for details).
SNPs have different effects on different types of RNA sequences
We applied remuRNA to common SNPs in our data set. Figure 3 shows the distribution of these scores in the range (0–10) for different regions of mRNA. The results of a similar analysis for ncRNAs and mi/snoRNAs are presented in Supplementary Figure S1. For each relative entropy value, the fraction of mutations with equal or higher scores is displayed. Thus, a plot with higher tail values represents mutations with more structural changes. Our experiments show distinguishable distribution patterns for different categories of SNPs based on their structural changes. The differences are statistically significant (Supplementary Table S1). In general, SNPs have a more pronounced effect on 5′-UTR RNA structures in comparison to other regions of mRNA. The observation that 5′-UTRs are more responsive to SNPs when compared with coding regions and 3′-UTRs is interesting, because we know that 5′-UTRs are more structurally functional.
Figure 3.

Relative entropy distribution for mutations in different regions of human mRNAs.
Common naturally occurring SNPs introduce less structural change than random point mutations
To compare the distribution of relative entropy for common SNPs and random point mutations, for each SNP we randomly change the position of point mutation in the corresponding sequence. Thus, we guarantee the same transition/transversion mutation ratio for each group of mutations by keeping the type of each mutation. For all types of RNA sequences, the relative entropy values of random point mutations are on average higher than the values of common SNPs. The differences are statistically significant as shown by Wilcoxon test results in Table 1. This is consistent with the hypothesis that SNPs introducing pronounced effects on RNA structure are disfavored in evolution. Thus, random point mutations cannot serve as a background for comparing naturally occurring SNPs.
Table 1.
Comparison of the impact of natural polymorphism and randomly inserted mutations on mRNA structure
| SNP class | CDS | 5′-UTR | 3′-UTR |
|---|---|---|---|
| P | 4e-4 | 7e-3 | 1e-6 |
CDS, coding sequence. P-values for random mutations introducing higher change are calculated using paired Wilcoxon test.
Disease-associated SNPs accompanied with significant changes in RNA structure
We next used remuRNA to analyze a data set of disease-associated SNPs that map to the 5′-UTRs of the human genes compiled by Halvorsen et al. (15) from the Human Genetic Mutation Database (27). The 5′-UTR of mRNA contributes to translation regulation by controlling mRNA stability, mRNA accessibility to the ribosome and translational efficiency. Cis-regulatory elements in 5′-UTRs such as upstream open reading frames, internal ribosome entry sites and iron-responsive elements (IRE) influence the translation rate. Furthermore, 5′-UTRs contain several interaction sites that are employed to regulate expression of specific genes by binding them. RNA secondary structure is the critical feature in the function of these cis-regulatory elements (28). There are several SNPs in the 5′-UTR of mRNAs, which are known to be involved in human diseases (29).
We present a list of disease-associated SNPs in the 5′-UTR that cause significant changes in RNA secondary structure with P value  (Table 2). P values are computed based on the distribution of relative entropy for common SNPs presented in Figure 3. We compared the structural impact of disease-associated SNPs with the effect of common SNPs. We identified disease-associated SNPs that alter the RNA structure significantly, but there is no simple threshold-based method that could predict whether SNP-induced structural RNA change is likely to cause a disease. Thus, just as in the case of sequence mutation, RNA structure alteration cannot be considered as a single factor leading to a disease, but rather one has to consider a broader context that defines how disruptive such structural perturbation is for gene function.
Table 2.
Disease-associated SNPs in the 5′-UTR with significant effects on RNA structure
| Disease/phenotype | Gene | SNP | Relative entropy | P | Motif |
|---|---|---|---|---|---|
| Increased triglyceride levels | ABCA1 | C35G | 8.358 | 0.018 | |
| Obesity and diabetes | AGRP | G79A | 6.966 | 0.041 | |
| Severe iron overload | ALAS2a | C105T | 5.788 | 0.093 | IRE, IRES, uORF |
| Wilson disease | ATP7B | C83A | 6.059 | 0.079 | uORF |
| Reduced serum thyroxine | DIO2 | G260A | 5.963 | 0.086 | SECIS |
| Dyskeratosis congenita, X-linked | DKC1 | C69G | 9.067 | 0.012 | IRES, uORF |
| Glioblastoma | EGFR | G31T | 7.28 | 0.037 | TOP |
| Hypertension | FSHR | G46A | 6.122 | 0.074 | |
| Hyperferritinaemia-cataract synd. | FTLa | C14G | 10.253 | 0.005 | IRE |
| C29G | 7.434 | 0.031 | |||
| G32C | 7.141 | 0.037 | |||
| C36G | 6.150 | 0.075 | |||
| C36A | 6.121 | 0.077 | |||
| Ontotemporal dementia | GRN | G148T | 7.609 | 0.028 | IRES, UORF, MBE |
| Bipolar affective disorder | HTR3A | T97C | 5.956 | 0.088 | IRES |
| Hypercholesterolaemia | LDLRa | C30G | 8.552 | 0.016 | uORF |
| C23A | 6.672 | 0.054 | |||
| C155A | 5.816 | 0.091 | |||
| Increased expression | MX1 | C53A | 5.746 | 0.095 | K-BOX |
| Reduced expression | NEIL2 | C90G | 7.481 | 0.030 | IRES, uORF |
| Reduced transcriptional activity | NR3C1 | C274A | 7.075 | 0.038 | IRES, uORF |
| Increased HDL-C levels | PLTP | C47G | 7.069 | 0.039 | |
| Protein C deficiency | PROC | A31C | 7.104 | 0.038 | |
| Retinoblastoma | RB1 | G17C | 9.003 | 0.012 | IRES |
| Hirschsprung disease | RET | G154C | 12.406 | 0.001 | |
| RET | C164G | 9.095 | 0.012 | ||
| Reduced expression | SLC19A1 | C77T | 5.984 | 0.084 | MBE |
| Diabetic retinopathy | VEGFAa | C398G | 10.674 | 0.003 | IRES |
| Ovarian cancer | XRCC3 | A65G | 6.494 | 0.061 | IRES, uORF |
IRES, internal ribosome entry sites; UORF, upstream open reading frames.
aThese genes are discussed in detail in the Supplementary Data. The UTRscan program (30) was used to identify the UTR functional elements.
In Table 2, some of the disease-associated SNPs assessed by remuRNA to cause significant changes in RNA structures are marked by ‘a’. These SNPs have been reported in the literature to alter the structure of the functional elements and, therefore, affect gene regulation and result in severe human diseases. We discuss these examples in the Supplementary Data.
Stability profile
Within a single RNA, different regions can have different structural complexity, and therefore, SNPs have different effects. For example, SNPs located in a stem are expected to have a higher impact than SNPs in a loop. Thus clusters or structure changing disease-associated mutations can be used as indicators of a structural elemental whose perturbation causes disease. To identify such sensitive regions, we can construct using relative entropy a stability profile of an RNA that shows for each nucleotide position the structural impact of a putative mutation, should it occur in this position.
As an example of the development of such stability profiles, we analyzed mutations in the 5′-UTR region of FTL with a conserved IRE. The HGMD database reports 28 mutations in the 5′-UTR region of FTL associated with HHCS. Interestingly, almost all the disease-associated SNPs are located in the IRE. Halvorsen et al. (15) studied these mutations extensively and identified four that alter the mRNA structural ensemble and, subsequently, a pairwise dependency between some SNPs in this region (31).
In Figure 1, we displayed the ensemble distribution of one of the SNPs in the IRE, G32C, and the one outside of the IRE, C90T. In that figure, we observe more structural changes caused by G32C than by C90T, where the computed relative entropies are 7.1 and 0.9, respectively. Many of the disease-associated SNPs in the 5′-UTR region of FTL are predicted by remuRNA to have significant effect on RNA structure (see Supplementary Data). These SNPs cluster round the beginning of the 5′-UTR region containing the hairpin. We also found 18 mutations in the 5′-UTR of FTL from the dbSNP database with no report on their disease association (32). Among these SNPs, only one is located in the IRE. Our method predicts major structural changes caused by this SNP suggesting that it is also associated with disease. Figure 4a shows the RNA secondary structure of the 5′-UTR of FTL. The IRE in this gene is located within the first 70 nucleotides of the 5′-UTR. Figure 4b shows the relative entropy values at each nucleotide position of the 5′-UTR of FTL. Disease-associated SNPs are red, and other SNPs from dbSNP are green. The average relative entropy in the IRE region is 3.4, whereas it is 2.5 for the rest of the 5′-UTR. Thus, the IRE structure is highly sensitive to point mutations.
Figure 4.
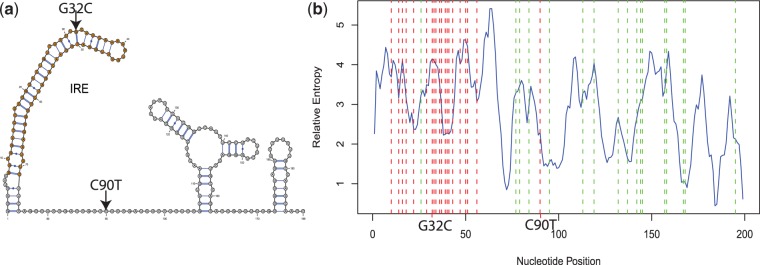
Point mutations in the 5′-UTR of FTL. (a) Predicted minimum free energy RNA secondary structure. (b) The relative entropy for all possible point mutations. Disease-associated SNPs are red, and other SNPs from dbSNP are green. Labeled are the SNPs G32C and C90T from Figure 1.
This suggests that the neighborhood of other structure-changing disease-associated SNPs that destabilize the same region might provide important information for prediction of disease association.
DISCUSSION
SNP-induced changes in RNA secondary structure can potentially impact expression and/or function of a gene. Investigation of structural changes caused by such small sequence changes requires a very sensitive comparison method. Subtle thermodynamic properties of an RNA structure are most precisely captured by the Boltzmann ensemble perspective. Subtle structural changes should be revealed by the differences in the two ensembles. Here, we proposed to use relative entropy—the commonly accepted measure of difference in probability distribution. However, because ensemble size grows exponentially with RNA length, efficient computation of relative entropy is impossible without a critical algorithmic advancement. We close this gap and provide a very efficient algorithm to compute relative entropy between Boltzmann distributions of two RNA structures: one defined by the native sequence and the second by the sequence with a point mutation. Consequently, our algorithm is a powerful tool useful for investigating the impact of SNP-induced change of an RNA sequence on various aspects of its function.
Our comparative analysis of the structural effects of common SNPs and random point mutations clearly indicates that such changes are, in all types of RNA, not neutral and justify studies of their impact on gene expression and function. To provide a proof of principle of the applicability of the method to such studies, we focused on the 5′-UTR region, where the role of RNA structure is best, although not fully, understood. Indeed, for many disease-associated mutations in this 5′-UTR region having a significant effect on RNA structure, we could confirm that the structural changes caused the disease.
An intriguing issue that our method might help to clarify is the mechanism by which a silent mutation can cause disease. Chamary and Hurst (11) presented evidence for the hypothesis that synonymous mutations are under selective pressure as a result of changes in the secondary structure of messengers and their stability. Consistent with this hypothesis, Kudla et al. (33) demonstrated that various GFP constructs that differ only in a single synonymous mutation vary in their GFP expression significantly. The minimum free energy associated with the secondary structure of the first third of the mRNA construct correlates well with GFP expression, which suggests mRNA folding is associated with variation in expression.
Distinguishing whether a silent mutation acts through a change in the binding dynamics between a codon and its cognate tRNAs and/or through a change in mRNA structure is not trivial. Both mechanisms of action lead to changes in protein structure/stability by affecting co-translational folding kinetics [reviewed in (34)]. Both mechanisms can also operate simultaneously and might be considered in the design of recombinant proteins. However, a comprehensive study by the Schäfer group demonstrated that optimized genes that were designed based on codon usage were not necessarily highly expressed in Escherichia coli (35). This implies that it might be important to consider mRNA secondary structure along with codon usage in the design of recombinant proteins [reviewed in (36)].
Our structural ensemble comparison method provides a stepping stone for obtaining further insights into these and related questions. Finally, the proposed approach allows for the measurement of the magnitude of structural changes but does not attempt to make any prediction concerning whether such change leads to a phenotype change. We are working toward combining this approach with evolutionary conservation measurements and other sequence and structure features to obtain a predictive model.
SUPPLEMENTARY DATA
Supplementary Data are available at NAR Online: Supplementary Table 1 and Supplementary Figure 1.
FUNDING
The Intramural Research Program of the National Institutes of Health, National Library of Medicine and National Cancer Institute; the Research Participation program at the Center for Biologics Evaluation and Research FDA; NSERC PDF (in part, to R.S.). The findings and conclusions in this article have not been formally disseminated by the Food and Drug Administration and should not be construed to represent any Agency determination or policy. Funding for open access charge: Intramural Research Program of the National Institutes of Health, National Library of Medicine.
Conflict of interest statement. None declared.
Supplementary Material
ACKNOWLEDGEMENTS
The authors thank George Leiman for his editorial assistance with this manuscript.
REFERENCES
- 1.Kikinis Z, Eisenstein RS, Bettany AJ, Munro HN. Role of RNA secondary structure of the iron-responsive element in translational regulation of ferritin synthesis. Nucleic Acids Res. 1995;23:4190–4195. doi: 10.1093/nar/23.20.4190. [DOI] [PMC free article] [PubMed] [Google Scholar]
- 2.Villette S, Kyle JA, Brown KM, Pickard K, Milne JS, Nicol F, Arthur JR, Hesketh JE. A novel single nucleotide polymorphism in the 3′ untranslated region of human glutathione peroxidase 4 influences lipoxygenase metabolism. Blood Cells Mol. Dis. 2002;29:174–178. doi: 10.1006/bcmd.2002.0556. [DOI] [PubMed] [Google Scholar]
- 3.Sauna ZE, Kimchi-Sarfaty C. Understanding the contribution of synonymous mutations to human disease. Nat. Rev. Genet. 2011;12:683–691. doi: 10.1038/nrg3051. [DOI] [PubMed] [Google Scholar]
- 4.Buratti E, Baralle FE. Influence of RNA secondary structure on the pre-mRNA splicing process. Mol. Cell. Biol. 2004;24:10505–10514. doi: 10.1128/MCB.24.24.10505-10514.2004. [DOI] [PMC free article] [PubMed] [Google Scholar]
- 5.Nackley AG, Shabalina SA, Tchivileva IE, Satterfield K, Korchynskyi O, Makarov SS, Maixner W, Diatchenko L. Human catechol-O-methyltransferase haplotypes modulate protein expression by altering mRNA secondary structure. Science. 2006;314:1930–1933. doi: 10.1126/science.1131262. [DOI] [PubMed] [Google Scholar]
- 6.de Smit MH, van Duin J. Secondary structure of the ribosome binding site determines translational efficiency: a quantitative analysis. Proc. Natl Acad. Sci. USA. 1990;87:7668–7672. doi: 10.1073/pnas.87.19.7668. [DOI] [PMC free article] [PubMed] [Google Scholar]
- 7.Duan J, Wainwright MS, Comeron JM, Saitou N, Sanders AR, Gelernter J, Gejman PV. Synonymous mutations in the human dopamine receptor D2 (DRD2) affect mRNA stability and synthesis of the receptor. Hum. Mol. Genet. 2003;12:205–216. doi: 10.1093/hmg/ddg055. [DOI] [PubMed] [Google Scholar]
- 8.Tellam J, Smith C, Rist M, Webb N, Cooper L, Vuocolo T, Connolly G, Tscharke DC, Devoy MP, Khanna R. Regulation of protein translation through mRNA structure influences MHC class I loading and T cell recognition. Proc. Natl Acad. Sci. USA. 2008;105:9319–9324. doi: 10.1073/pnas.0801968105. [DOI] [PMC free article] [PubMed] [Google Scholar]
- 9.Bartoszewski RA, Jablonsky M, Bartoszewska S, Stevenson L, Dai Q, Kappes J, Collawn JF, Bebok Z. A synonymous single nucleotide polymorphism in DeltaF508 CFTR alters the secondary structure of the mRNA and the expression of the mutant protein. J. Biol. Chem. 2010;285:28741–28748. doi: 10.1074/jbc.M110.154575. [DOI] [PMC free article] [PubMed] [Google Scholar]
- 10.Meyer IM, Miklos I. Statistical evidence for conserved, local secondary structure in the coding regions of eukaryotic mRNAs and pre-mRNAs. Nucleic Acids Res. 2005;33:6338–6348. doi: 10.1093/nar/gki923. [DOI] [PMC free article] [PubMed] [Google Scholar]
- 11.Chamary JV, Hurst LD. Evidence for selection on synonymous mutations affecting stability of mRNA secondary structure in mammals. Genome Biol. 2005;6:R75. doi: 10.1186/gb-2005-6-9-r75. [DOI] [PMC free article] [PubMed] [Google Scholar]
- 12.Ancel LW, Fontana W. Plasticity, evolvability, and modularity in RNA. J. Exp. Zool. 2000;288:242–283. doi: 10.1002/1097-010x(20001015)288:3<242::aid-jez5>3.0.co;2-o. [DOI] [PubMed] [Google Scholar]
- 13.Churkin A, Barash D. RNAmute: RNA secondary structure mutation analysis tool. BMC Bioinformatics. 2006;7:221. doi: 10.1186/1471-2105-7-221. [DOI] [PMC free article] [PubMed] [Google Scholar]
- 14.Wuchty S, Fontana W, Hofacker IL, Schuster P. Complete suboptimal folding of RNA and the stability of secondary structures. Biopolymers. 1999;49:145–165. doi: 10.1002/(SICI)1097-0282(199902)49:2<145::AID-BIP4>3.0.CO;2-G. [DOI] [PubMed] [Google Scholar]
- 15.Halvorsen M, Martin JS, Broadaway S, Laederach A. Disease-associated mutations that alter the RNA structural ensemble. PLoS Genet. 2010;6:e1001074. doi: 10.1371/journal.pgen.1001074. [DOI] [PMC free article] [PubMed] [Google Scholar]
- 16.Gruber AR, Lorenz R, Bernhart SH, Neubock R, Hofacker IL. The Vienna RNA website. Nucleic Acids Res. 2008;36:W70–W74. doi: 10.1093/nar/gkn188. [DOI] [PMC free article] [PubMed] [Google Scholar]
- 17.Johnson AD, Trumbower H, Sadee W. RNA structures affected by single nucleotide polymorphisms in transcribed regions of the human genome. WebmedCentral Bioinformatics. 2011;2:WMC001600. [Google Scholar]
- 18.Waldispühl J, Devadas S, Berger B, Clote P. Efficient algorithms for probing the RNA mutation landscape. PLoS Comput. Biol. 2008;4:e1000124. doi: 10.1371/journal.pcbi.1000124. [DOI] [PMC free article] [PubMed] [Google Scholar]
- 19.Waldispuhl J, Devadas S, Berger B, Clote P. RNAmutants: a web server to explore the mutational landscape of RNA secondary structures. Nucleic Acids Res. 2009;37:W281–W286. doi: 10.1093/nar/gkp477. [DOI] [PMC free article] [PubMed] [Google Scholar]
- 20.Campagnoli MF, Pimazzoni R, Bosio S, Zecchina G, DeGobbi M, Bosso P, Oldani B, Ramenghi U. Onset of cataract in early infancy associated with a G32C transition in the iron responsive element of L-ferritin. Eur. J. Pediatr. 2002;161:499–502. doi: 10.1007/s00431-002-1019-4. [DOI] [PubMed] [Google Scholar]
- 21.Cremonesi L, Paroni R, Foglieni B, Galbiati S, Fermo I, Soriani N, Belloli S, Ruggeri G, Biasiotto G, Cazzola M, et al. Scanning mutations of the 5′UTR regulatory sequence of L-ferritin by denaturing high-performance liquid chromatography: identification of new mutations. Br. J. Haematol. 2003;121:173–179. doi: 10.1046/j.1365-2141.2003.04253.x. [DOI] [PubMed] [Google Scholar]
- 22.Ding Y, Chan CY, Lawrence CE. RNA secondary structure prediction by centroids in a Boltzmann weighted ensemble. RNA. 2005;11:1157–1166. doi: 10.1261/rna.2500605. [DOI] [PMC free article] [PubMed] [Google Scholar]
- 23.Mathews DH, Sabina J, Zuker M, Turner DH. Expanded sequence dependence of thermodynamic parameters improves prediction of RNA secondary structure. J. Mol. Biol. 1999;288:911–940. doi: 10.1006/jmbi.1999.2700. [DOI] [PubMed] [Google Scholar]
- 24.McCaskill J. The equilibrium partition function and base pair binding probabilities for RNA secondary structure. Biopolymers. 1990;29:1105–1119. doi: 10.1002/bip.360290621. [DOI] [PubMed] [Google Scholar]
- 25.Bernhart SH, Hofacker IL, Stadler PF. Local RNA base pairing probabilities in large sequences. Bioinformatics. 2006;22:614–615. doi: 10.1093/bioinformatics/btk014. [DOI] [PubMed] [Google Scholar]
- 26.Rhead B, Karolchik D, Kuhn RM, Hinrichs AS, Zweig AS, Fujita PA, Diekhans M, Smith KE, Rosenbloom KR, Raney BJ, et al. The UCSC Genome Browser database: update 2010. Nucleic Acids Res. 2010;38:D613–D619. doi: 10.1093/nar/gkp939. [DOI] [PMC free article] [PubMed] [Google Scholar]
- 27.Stenson PD, Mort M, Ball EV, Howells K, Phillips AD, Thomas NS, Cooper DN. The Human Gene Mutation Database: 2008 update. Genome Med. 2009;1:13. doi: 10.1186/gm13. [DOI] [PMC free article] [PubMed] [Google Scholar]
- 28.Kozak M. Regulation of translation via mRNA structure in prokaryotes and eukaryotes. Gene. 2005;361:13–37. doi: 10.1016/j.gene.2005.06.037. [DOI] [PubMed] [Google Scholar]
- 29.Chatterjee S, Pal JK. Role of 5′- and 3′-untranslated regions of mRNAs in human diseases. Biol. Cell. 2009;101:251–262. doi: 10.1042/BC20080104. [DOI] [PubMed] [Google Scholar]
- 30.Pesole G, Liuni S, Grillo G, Ippedico M, Larizza A, Makalowski W, Saccone C. UTRdb: a specialized database of 5′ and 3′ untranslated regions of eukaryotic mRNAs. Nucleic Acids Res. 1999;27:188–191. doi: 10.1093/nar/27.1.188. [DOI] [PMC free article] [PubMed] [Google Scholar]
- 31.Martin JS, Halvorsen M, Davis-Neulander L, Ritz J, Gopinath C, Beauregard A, Laederach A. Structural effects of linkage disequilibrium on the transcriptome. RNA. 2012;18:77–87. doi: 10.1261/rna.029900.111. [DOI] [PMC free article] [PubMed] [Google Scholar]
- 32.Sherry ST, Ward MH, Kholodov M, Baker J, Phan L, Smigielski EM, Sirotkin K. dbSNP: the NCBI database of genetic variation. Nucleic Acids Res. 2001;29:308–311. doi: 10.1093/nar/29.1.308. [DOI] [PMC free article] [PubMed] [Google Scholar]
- 33.Kudla G, Murray AW, Tollervey D, Plotkin JB. Coding-sequence determinants of gene expression in Escherichia coli. Science. 2009;324:255–258. doi: 10.1126/science.1170160. [DOI] [PMC free article] [PubMed] [Google Scholar]
- 34.Fedorov AN, Baldwin TO. Cotranslational protein folding. J. Biol. Chem. 1997;272:32715–32718. doi: 10.1074/jbc.272.52.32715. [DOI] [PubMed] [Google Scholar]
- 35.Maertens B, Spriestersbach A, von Groll U, Roth U, Kubicek J, Gerrits M, Graf M, Liss M, Daubert D, Wagner R, et al. Gene optimization mechanisms: a multi-gene study reveals a high success rate of full-length human proteins expressed in Escherichia coli. Protein Sci. 2010;19:1312–1326. doi: 10.1002/pro.408. [DOI] [PMC free article] [PubMed] [Google Scholar]
- 36.Welch M, Villalobos A, Gustafsson C, Minshull J. Designing genes for successful protein expression. Methods Enzymol. 2011;498:43–66. doi: 10.1016/B978-0-12-385120-8.00003-6. [DOI] [PubMed] [Google Scholar]
Associated Data
This section collects any data citations, data availability statements, or supplementary materials included in this article.