


Abstract
The development of new high-throughput technologies enables us to measure genome-wide transcription levels, protein abundance, metabolite concentration, etc. Nevertheless, these experimental data are often noisy and incomplete, which hinders data analysis, modeling and prediction. Here, we propose a method to predict expression values of genes involved in stable cellular phenotypes from the expression values of the remaining genes in a literature-based gene regulatory network. The consistency between predicted and known stable states from experimental data is used to guide an iterative network pruning that contextualizes the network to the biological conditions under which the expression data were obtained. Using the contextualized network and the property of network stability we predict gene expression values missing from experimental data. The prediction method assumes a Boolean model to compute steady states of networks and an evolutionary algorithm to iteratively prune the networks. The evolutionary algorithm samples the probability distribution of positive feedback loops or positive circuits and individual interactions within the subpopulation of the best-pruned networks at each iteration. The resulting expression inference is based not only on previous knowledge about local connectivity but also on a global network property (stability), providing robustness in the predictions.
INTRODUCTION
The wealth of experimental data from high-throughput technologies in different areas of biology, and especially at a transcriptomics level, allows us to incorporate such data as networks of interactions. These networks can be reconstructed based on knowledge resources such as literature or specific databases (e.g. KEGG, Reactome, Transfac) or purely from experimental data by inferring interactions between genes from their co-expression patterns (1) or mutual information (2).
During the network reconstruction process from literature, genes and interactions are introduced by an expert or using algorithms in the attempt to capture the essential events to describe a particular biological system. In addition, gene expression values are taken into account in order to perform a network reconstruction. Nevertheless, it is often the case that gene expression values of some genes are missing despite their relevance in gene regulation. Usually, the inference of expression values of these genes based on regulation relationships extracted from literature is not correct, since this information can relate to different biological conditions, such as different cellular types, tissues, pathological or physiological states or even organisms. Furthermore, the potential introduction of ‘false’ interactions, even a few of them, could significantly modify predicted gene expression states.
Here, we propose a method that uses network stability to guide the iterative network pruning of literature-based network interactions, which are apparently not active in the biological context under study according to expression data. This pruning is driven by the compatibility between predicted and experimentally verified steady state gene expression patterns. Hence, it is reasonable to assume that interactions removed by pruning are not present in these steady states. Once these interactions have been removed, we predict the missing expression values using the optimized pruned networks explaining the best-known expression values (Figure 1).
Figure 1.

Flowchart of the method to predict missing expression values using an iterative network pruning and training against experimental data. The network stability is exploited to select the models that best explain the experimental expression values. The prediction of missing values is determined by a population of optimized pruned networks.
Given that our method relies on network stability analysis of different cellular conditions, we selected for our study examples of transitions between different cellular phenotypes. In these cases we assumed that cellular phenotypes correspond to steady states (3,5) of gene regulatory networks describing these processes. Namely, the analyzed examples include the following: (i) HL60-neutrophil differentiation (HL60), (ii) epithelial to mesenchymal transition (EMT) and (iii) mesodermal progenitor cells (MPCs) differentiation to osteoblasts. The method performance was tested in these examples, showing its predictability power. Moreover, in order to further demonstrate the utility of our method, we decided to expand the HL60-neutrophil differentiation gene regulatory network by adding some previously reported genes as relevant for this differentiation process (3), and predicting their expression values. The results show that our predictions are consistent with the experiment performed by Huang et al. (3) for most of these genes. In addition, we found that the networks within the family of optimized pruned networks exhibit a very similar response under perturbation of specific genes, with the same three genes able to trigger the transition from one phenotype to the other one when perturbed by changing its expression values.
In summary, we propose a novel method to predict missing or noisy gene expression values in transcriptomics data, which correspond to specific biological processes. Therefore, it can be used for curating experimental gene expression data and can help with data analysis, modeling and prediction.
Comparing approaches for inference of regulatory and signaling networks
Gene regulatory networks can be inferred from literature or using reverse engineering approaches based on gene expression covariation patterns, such as Bayesian network analysis (2,4) or inferred systems of differential equations (5). Nevertheless, networks inferred purely from experimental data and those assembled from the literature have different limitations. In the first case, a wealth of data about interactions previously described in literature is ignored. On the other hand, literature-based networks are too disconnected from experimental data to be able to describe input–output relationships, such as cellular responses under specific biological stimuli or mechanisms that determine specific stable (long-term) expression patterns.
Although the main goal of our method is to predict missing gene expression values, it requires the inference of a set of optimized networks underlying these genes expression patterns. In this context, our network inference strategy contains several differences and similarities with previously introduced approaches.
An important characteristic of our method is that it explores a reduced search space due to the fact that only interactions previously reported in literature can be included in the network. Methods purely based on experimental data (2,4,6) rely on a large amount of data to statistically validate network interactions and explore larger search spaces since interactions are not constrained by literature information. In some cases, literature-based methods can also deal with large search spaces, especially when additional interactions can be added and/or regulatory logic rules are flexible (7,8).
A clear advantage of the method here we present is that only a single experiment is required—a microarray experiment comparing two stable states of a biological system. Other approaches combine literature information with experimental data; however, they require a significant number of perturbation experiments, i.e. different combinations of inputs and outputs (8,7). In order to be able to train the model these methods require perturbation experiments targeting different starting points in the network including combinations of perturbations to solve the cross-talking between different pathways in the graph until the entire network is covered. More details are included in the Supplementary Data.
Another remarkable difference between the work published by Irit Gat-Viks et al. (8) and the approach we present consists on the complete confidence that this previous method has in the experimental data. The assumption is that this information is always correct, adjusting the regulation functions that define the state of a specific node based on the states of its parents in an acyclic graph. If after this process some discrepancies or local inconsistencies still remain, the model is refined by addition of novel regulatory hypothesis (with interactions not described in literature) using a learning algorithm. In the method we propose, a local inconsistency could be accepted if the global consistency of the computed network state and experimental expression data is increased, strategy suitable to deal with noisy expression data. Given that the main goal of our approach is to predict missing expression values and not to describe the specific regulatory mechanism, we do not introduce interactions not described before in literature to refine the model and we only work on the contextualization of networks with enough connectivity to explain missing expression values.
Another important feature of the method here we present is that it provides a strategy to increase the match with expression data using an evolutionary algorithm that considers the probability distribution of positive circuits and individual edges in an iterative process so it is not necessary to exhaustively explore the entire search space as in previously published works that also exploit the attractors of the system, as in the work published by Layek et al. (9). In this work the authors proposed a method to infer regulatory networks using a priori information of biological pathways and the concordance between network attractors and experimental data. In their method, they integrate information from pathways described in literature to create a family of possible networks. Secondly they check if experimentally observed stable states agree with computed attractors of the family of possible networks and they select the top ones (different alternative networks could fit expression data). If the match is not good they can question the validity of the pathway information, so the stable states distribution data can be used to assess the accuracy of the pathway information, but there is no method to improve this match. Here, we distinguish our method by providing a systematic technique to improve the match between experimental and computed steady states.
Summarizing, the method presented here to predict missing expression values rests on a strategy for network inference that works on a reduced search space of literature-based networks, requires a reduced amount of experimental data as it exploits the stability of the network and uses a strategy to increase the match between the model and the experimental expression data.
Finally, it is worth noting that our method exploits global network information, i.e. network stability, whereas several other methods rely on local network information, such as pairwise gene expression covariation (2,4), or response to perturbations of specific genes (5). Hence, our method constitutes a good compromise between robustness in predictions and the amount of required experimental information.
MATERIALS AND METHODS
Principle of the approach
In order to illustrate the idea, let us consider a microarray experiment comparing two cellular phenotypes which provides a list of three genes differentially expressed between the phenotype 1 and phenotype 2—gene b is upregulated and genes a and c are downregulated. According to this description we can generate two Booleanized phenotypes which are: the phenotype 1 with the gene b in OFF (0) and genes a and c in ON (1); the phenotype 2 with the gene b in ON and genes a and c in OFF (Figure 2A) corresponding with the two classes compared in the microarray experiment. Let us pretend that there are two interactions described in literature that allow us to reconstruct a small gene regulatory network with the three differentially expressed genes and these two interactions. Assuming that cellular phenotypes correspond with stable states as proposed by several authors (10–12), these two Booleanized phenotypes should be steady states of this small network. After the computation of the attractors of this network in a dynamical Boolean system with a synchronous updating scheme (13) and using our own implementation of the method described by Garg et al. (14), we found that this network only have one attractor corresponding with phenotype 2. The logic rule applied by default is the following: if none of its inhibitors and at least one of its activators is active, then a gene becomes active; otherwise the gene is inactive. This result is consistent with the results obtained using previously published software to compute attractors in Boolean systems [Boolnet (15), GenYsis (14), GinSim (16)]. In other words, this network is clearly not suitable to describe this two steady states system with the known gene states.
Figure 2.

(A) Gene regulatory network with three genes and two inhibitions. Two Booleanized phenotypes are generated from microarray experiment. Nodes in blue and red represent genes down and upregulated, respectively, according to microarray experiments. Nodes in grey and white represent genes ON (1) and OFF (0), respectively, in the Booleanized phenotypes. The attractor computation of this network in a dynamical Boolean system with a synchronous updating scheme provides only one steady state corresponding to the phenotype 2. (B) Gene regulatory network with four genes, two inhibitions and two activations. Only the expression values of genes a, b and care known, while the expression value of gene d (in pale grey) is missing. Nodes in blue and red represent genes down and upregulated, respectively, according to microarray experiments. Nodes in dark grey and white represent genes ON (1) and OFF (0), respectively, in steady states (attractors) computed according to a Boolean dynamical model. Gene d is predicted as downregulated (in pale blue).
But let us introduce in our small network an additional gene d without known expression values (Figure 2B). Because gene d is involved in a positive regulatory feedback loop (a positive circuit), its state should because and consequence of the states of its partners in the loop. Positive circuits or positive feed-back loops are necessary to guarantee the exchange of information from different parts of the network, allowing more than one self-maintained state. Specifically in the context of the dynamical behavior of biological regulatory networks, positive circuits, or circuits with an even number of negative interactions (inhibitions), have been reported as necessary condition for multistability (multiple fixed points or attractors with only one state) (17). In contrast, the presence of negative circuits, or circuits with an odd number of negative interactions, is a necessary condition for oscillatory behavior (cycles or stable states with at least two states). In our specific example, the introduction of the node d closing the loop provides a way back for the signal to node a, that is required to maintain its state active. The attractor computation using the Boolean dynamical model for this expanded network (four genes and four interactions) results in two steady states matching perfectly with the states of the genes a, b and c in the Booleanized phenotypes 1 and 2. According to these two attractors, the gene d is ON in the phenotype 1 and OFF in the phenotype 2. In other words, our method is able to predict the gene d as downregulated.
However, the prediction becomes complicated for a gene d involved in multiple regulatory feedback loops, because its states could be different depending on the loops being considered. Our method handles these inconsistencies by using an optimization process preserving interactions consistent with experimental data and removing inconsistent interactions considered as not active in the biological context under study. This optimization process is performed using an estimation of distribution algorithm (EDA).
Estimation of distribution algorithm
EDAs are evolutionary search algorithms that can be applied to high-dimensional optimization problems and have been applied in several bioinformatic problems (18). EDAs use a set of selected solutions to create a probabilistic model that guides the search/optimization process. Compared to other evolutionary algorithms, they avoid premature convergence of solutions, due to the modeling of the probability distribution over many iterations. Within the population of solutions, different patterns of interactions between genes may be represented as probabilities. This knowledge in terms of probability is used to sample new solutions.
Depending on the complexity of the probabilistic models used to capture the interdependencies between the variables, EDAs can be divided into univariate and multivariate approaches. Univariate EDAs assume that all variables are independent and factorize the joint probability of the selected solutions as the product of univariate marginal probabilities. Multivariate EDAs factorize the joint probability distribution using statistics observing more than one variable at a time. In particular, the possibility of defining the interdependencies between variables constitutes the main advantage of EDAs in comparison with genetic algorithms.
Here we propose an EDA to perform an iteratively prune a literature-based network using populations of alternative pruned networks that are scored and selected using expression data. These selected highest scored pruned networks are used to generate the next population of alternative pruned networks successively until the fulfillment of the stop criteria. For each iteration of the algorithm, the new population of pruned networks is generated by sampling the probability distribution of positive circuits and individual interactions found in the best pruned networks of the previous population. When the iteration stops the last optimized population of pruned networks is then used to predict missing expression values. Each pruned network is scored comparing their predicted steady states with a Booleanized representation of the experimental expression data. Given that the scoring of the pruned networks is based on the stability, a property that rests on the global topology of the network, we cannot assess each interaction separately. In our method, the dependencies between variables (interactions) are captured using information about the network topology. Specifically, we treat all the interactions belonging to positive circuits as a unique entity, considering that this entity is present if and only if all of its interactions are present too or, in other words, if the circuit is complete.
In the expanded gene regulatory network (Figure 2B), the contribution of each interaction to generate two steady states cannot be assessed separately because all of these interactions are necessary to close the loop and produce a bi-stable behavior. These interactions are not independent from the stability point of view.
Algorithm steps and scores
To look for a set of alternative optimized pruned networks to explain the experimental expression data and predict missing values the following algorithm was implemented in four steps (Figure 3):
Generation of an initial population of pruned networks—In this step the first population of pruned networks is generated by random removal of interactions from the original literature-based network, in other words, sampling individual interactions with a probability of 0.5. No considerations about topological features such as preserving the degree of the nodes or a scale-free topology are taken into account. The only constraint we introduce is that all networks are forced to include at least one positive circuit, a necessary condition for multi-stability (17). This positive circuit is randomly selected from the pool of all positive circuits in the original literature-based network. The population size is defined by the user; a larger population size increases the likelihood of achieving global optimum but also increases computational expense and, in general, requires more iterations to converge to one or multiple solutions.
Selection of best-scored pruned network—Each pruned network is scored using the objective function (described below) and a defined number of best-scored pruned networks are selected. The user can define this selection number, which is 50% of the population size by default.
Termination criteria—The algorithm checks the fulfillment of the stop criteria (defined by the user): either the maximum number of iterations is reached, or all the scores in the population of pruned networks are higher than a defined value (e.g. 80%). If this criteria is not fulfilled the algorithm proceeds with the generation of next population of pruned networks.
Generation of next pruned network population—The next population of pruned networks is created by sampling the probability distributions of each positive circuit and individual interaction, calculated from the best-scored pruned network selection, to decide whether circuits and individual interactions are included or not in the new pruned networks. In other words, taking the top scored pruned networks we check how many times one specific positive circuit appears, creating a background for the next population random generation. For example, assume that a hypothetical set of 10 pruned networks has been selected due to their high scores, and one specific circuit is present in 7 of these 10 pruned networks. Then, the probability of this circuit is 0.7 and when we generate the next population of pruned networks, on ∼70% of the new networks will have this circuit. Once the circuits are sampled we follow the same sampling on individual interactions to model interactions not present in selected circuits. Additionally, in order to retain the best scoring networks we implemented elitism—pruned networks with the best scores within the subset of selected pruned networks are directly transferred to the next generation. The algorithm also introduces a certain amount of noise in the optimization process by sampling the truncated probability of both circuits and interactions. These probability distribution values are truncated to 0.2, in the case of frequencies <0.2 and to 0.8 in the case of frequencies >0.8. This strategy avoids convergence (all pruned networks with or without a specific circuit or interaction) by chance, and enables efficient optimization for smaller population size.
Figure 3.

Iterative network pruning using an EDA.
The objective function
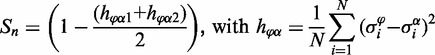
The objective function assesses the match between predicted steady states (see section on computation of attractors) and a Booleanized representation of the experimental expression data assigning a score to each sampled pruned network (n). This score S uses the normalized Hamming distance (h) to compare N Boolean gene expression values (σ) between all calculated steady states (α) of a pruned network and the two known phenotypes (φ1 and φ2) defined by the expression data, in order to identify the two best-matching phenotype/steady state couples (φα1 and φα2). Finally, the pruned network score (from 0 to 1) is defined as:
 |
Prediction of gene expression
Once the iterative pruning terminates, we calculate five prediction scores for each gene. The scores correspond to five classifications—UP or DOWN (differentially expressed genes), ON or OFF (invariant genes), or UNK (genes with unknown expression). For instance, the classification score for UP (resp. DOWN, ON, OFF, UNK) is equal to the number of solutions with a steady state couple  equal to {1,0} (resp. {0,1}, {1,1},{0,0}, {−,−}) for this gene g divided by the total number of solutions. The classification with the highest score corresponds to our predicted gene expression for the gene g. In case of more than one highest score, we predict the gene expression as UNK.
Computation of attractors and circuits
In order to compute the attractors, we model the network as a dynamical system using a deterministic rule-based approach or, more specifically, a Boolean dynamical model. Other possible dynamic models include continuous models, which have the benefit of being easily compared to quantitative experimental data (19), and discrete models with more than two possible values (20). However, since the continuous models would have to be studied numerically as opposed to analytically, the computation of attractors becomes computationally expensive. Furthermore, biological regulatory processes are such that the graph of rate of expression between a regulated gene as a function of its regulator, commonly exhibits a sharp sigmoid curve, which can be approximated to a Boolean switch-like behavior (21).
Within this Boolean dynamical model the network is created as a graph, which is directed and signed, in order to represent positive or negative regulation. The nodes represent genes and the edges denote regulation. Each node has an associated value ‘1’ or ‘0’ encoding the activation/presence or inactivation/absence, respectively. The logic functions that encode the regulation for each specific node are represented using the disjunctive normal form representation, that uses only AND, OR and NOT operators (22). Given the regulators (activators and inhibitors) for each node, the Boolean function is evaluated using rules proposed by (14): if none of its inhibitors and at least one of its activators are active, then a gene becomes active; otherwise, the gene is inactive. Finally, we use a synchronous updating scheme (13), where all genes in the network update their expression levels simultaneously in each time step. We use synchronous updating scheme as it facilitates computation due to the smaller state space and yet preserves the generic qualitative properties of the network (23). An alternative updating scheme, which we do not investigate, would be the asynchronous scheme, which would have a much larger state space, leading to a higher complexity of computing attractors (13). With this synchronous updating scheme all the genes are updated from one step to the next one at the same time.
Using the set of Boolean functions for each node and synchronous updating, we then compute the attractors of the network, i.e. the set of states towards which a dynamical system evolves over time. The attractors were computed using an efficient method to model the network dynamics using Reduced Order Binary Decision Diagrams (ROBDD or in short BDD), due to their compact representation of Boolean functions and the ease of computing complex Boolean operations(14). More details about attractor computation are included in the Supplementary Data.
The Johnsons algorithm (24) is used to detect all elementary circuits in the network. A circuit is a path in which the first and the last nodes are identical. A path is elementary if no node appears twice. A circuit is elementary if no node but the first and the last appears twice. Once we have all elementary circuits, we select positive circuits, or circuits for which the difference between the number of activating edges and the number of inhibiting edges is even. Johnson’s algorithm uses backtracking to eliminate partial candidate solutions, where the partial candidates are created by building elementary paths. The algorithm begins from a root node s and creates elementary paths from s. Additionally, the algorithm provides two advantages—it reduces the search space considerably by blocking nodes as they are added to an elementary path and the method also reduces the search space by removing the previous root nodes so that new cycles are generated. The algorithm runs in O(n + e)(c + 1) time and requires a storage space of O(n + e), where n is the number of nodes, c is the number of elementary circuits and e is the number of edges.
Availability and implementation
The computation of attractors and the detection of circuits were implemented in C++, the EDA algorithm was developed in Perl and the interface was designed in PHP as a module of M@IA (25). The tool (named as XPred) and source code are freely available for academic use at http://maia.uni.lu/XPred.
Simulations to test the consistency in response to perturbation within a family of optimized pruned networks
To perform these simulations we used a continuous dynamical model based on a set of ordinary differential equations (ODE) implementing the method described by Mendoza et al. (19). In this continuous system the steady state computed in the Boolean model is introduced as initial state. Then we proceeded to perturb one by one every gene in the network, changing its state to ON (1) or to OFF(0) depending on the case and checking if such a perturbation is able to trigger the transition to the steady state corresponding to the neutrophils phenotype or not. The results of these simulations were consistent with the results obtained with a previous implementation of this method published by (26).
RESULTS
Approach optimizing pruned networks and predicting missing expression values
Our method is designed for stable cellular phenotypes with known expressions values. It means that, for microarray expression data, the two phenotypes should correspond to steady states or long-term expression patterns. The three biological examples used to illustrate and validate the method correspond to three cellular differentiation networks (HL60–neutrophil differentiation, EMT and MPCs differentiation to osteoblasts). The list of differentially expressed genes provided by the expression data analysis is transformed to generate two Booleanized phenotypes. Then, our method generates alternative configurations of the original network in order to select those having attractors, computed with a Boolean model, with the best fit to Booleanized phenotypes. Finally, these optimized pruned networks show interactions that best explain the known expression values, and the gene states of its attractors are used to predict missing expression values.
Illustration of the method using a toy network
In order to illustrate the algorithm and to interpret the results, we constructed a toy network with 18 nodes, 23 edges and three positive circuits (Figure 4, up-left), and an incomplete gene expression dataset for two ‘experimental’ stable states that represent a microarray experiment (node A, C and F without expression). The gene expression dataset is used to generate two Booleanized phenotypes (Figure 4, up-right). This network has only one steady state or fixed point according to a Boolean dynamical model following the rules described in the ‘Materials and Methods’ section, so it is clearly not suitable to describe a system with at least two steady states.
Figure 4.

Top-left—Toy network with 18 nodes, 23 edges and three positive circuits. Top-right—Incomplete gene expression data for two ‘experimental’ stable states that are going to be used to generate two Booleanized phenotypes. Bottom—Alternative solutions with a perfect match to expression data. Pale red and blue indicates prediction of up and downregulation, respectively. Circuit 1 was removed in both solutions, but circuits 2 and 3 constitute alternative pathways so the presence of either (could be both) is enough to generate two stable states with a perfect match with expression values.
We run 40 iterations of the algorithm with a population size of 30 and a best-score network selection number of 12, that is, at each iteration, we selected 12 best-scoring individuals from a population of 30. The new generation is created by sampling the probability distribution of positive feedback loops (positive circuits) and individual edges in these 12 selected individuals. The elitism method directly transfers the best six solutions to the next population.
In the final population, some edges are removed by the algorithm because they prevent a perfect match between the Booleanized phenotypes and the computed attractors (considering only genes with known expression data, i.e. all of them but A, C and F). These edges represent interactions that are described in literature, but apparently are not active in the context under study. According to the predictions performed using the optimized pruned network, the algorithm predicts missing expression values for genes A (downregulated), C (upregulated) and F (upregulated).
We noticed that the interactions B -| D, E -> P and Q -> J are correctly removed from all solutions with a 100% matching score because their presence avoided the perfect match. Interestingly, we noticed that in such solutions, the interactions B -> C and G -> C could be missing but not simultaneously. They constitute alternative pathways to guarantee the bi-stability of the system. In other words, some of the perfect matching solutions have one and only one of these interactions missing. Interestingly, the probability distribution of the circuits in these 100% matching solutions shows that the circuit 1 is always absent, but circuits 2 or 3 could be missing (but not both at the same time) precisely because the missing B -> C and G -> C interactions break them (Figure 4, down).
The interaction J -> Q can be present or absent according to our model and the logic gate that rules the regulation of Q, without change in the state of this node in the attractors. It highlights a limitation of our method, as we cannot remove this link due to a lack of evidence (it could be present or absent in a perfect matching solution). The validation of such links in the specific biological context defined by the experimental data is out of the scope of this method.
Biological sample cases
We chose three cellular differentiation processes as examples to illustrate and validate the method (Table 1): HL60–neutrophil differentiation (HL60), EMT and differentiation of MPCs to osteoblasts. The gene regulatory network reconstruction process is described in the Supplementary Data, and references about the interactions are included in the Supplementary Material SII.
Table 1.
Gene regulatory networks of three biological examplesa
| Network properties | HL60–neutrophils | EMT | MPC–osteoblast |
|---|---|---|---|
| Number of nodes | 18 | 46 | 67 |
| Number of edges | 39 | 129 | 123 |
| Activations | 37 | 92 | 72 |
| Inhibitions | 2 | 37 | 51 |
| Feed-back loops (circuits) | |||
| Positive | 5 | 38 | 5 |
| Negative | 1 | 71 | 1 |
| Feed;forward loops (up to 5 nodes) | 326 | 1074 | 1121 |
aHL60–neutrophil differentiation network, epithelial–mesenchymal transition network, MPC–osteoblast differentiation network. Information about number of nodes, edges, circuits and feed-forward loops is shown in the table.
The multipotentpromyelocytic leukemia cell line HL60 was originally isolated by Dr Steven Collins from an acute promyelocytic leukemia (APL) patient (27). The HL60 system was used by Huang et al. (12) to demonstrate the correspondence between cell fates and high-dimensional attractor states of the underlying network. This cell line can be stimulated to differentiate into neutrophils using different chemical agents. In order to reconstruct the HL60-neutrophil differentiation gene regulatory network, we used a set of genes composed by genes differentially expressed between HL60 cells (precursor or phenotype 1) and neutrophils (phenotype 2), where the differentiation was induced by dimethyl sulfoxide (DMSO) in the experiment performed by Mollinedo et al. (28). We were able to reconstruct a gene regulatory network with 18 genes and 38 interactions representing positive or negative effect over gene expression.
EMT plays a crucial role in cancerogenesis and metastasis, by initiating by the breakdown of epithelial cell homeostasis correlated with the acquisition of invasive capacities and stemness properties. We used a set of differentially expressed genes between epithelial and mesenchymal cells obtained from an experiment performed by Vetter et al. (29) where the transition is triggered by the induced expression of the EMT master transcription regulator SNAI1 (human snail). We obtained a gene regulatory network with 46 genes and 129 interactions representing positive or negative effect over gene expression.
Single human bone marrow-derived MPCs differentiate into osteoblasts, chondrocytes, adipocytes, myocytes and endothelial cells. In the experiment performed by Qi et al. (30), MPCs were induced to differentiate into osteoblasts, cells involved in bones formation, by adding dexamethasone, ascorbic acid and β-glycerophosphate to the cell cultures. A microarray analysis performed afterwards yielded a list of differentially expressed genes between osteoblasts and MPCs. The resulting network includes 67 genes and 123 interactions representing positive or negative effect over gene expression.
Figure 5 shows the results after the application of our method to the three biological examples. Using the prediction scores described in ‘Material and Methods’ section, we are able to obtain a consensus among a population of optimized pruned networks.
Figure 5.

Illustration of results after the application our algorithm on the three biological examples. (a) Raw networks. Missing expression values, upregulated genes and downregulated genes are in grey, bright red and dark blue, respectively. (b) Genes predicted as upregulated and downregulated are in pale red and pale blue, respectively. Genes in white and yellow are predicted as invariant-inactive and invariant active, respectively. (c) Prediction scores are displayed in a range from black (low prediction scores) to white (high prediction scores).
Statistical validation
In our biological examples, to statistically validate predicted expression values, we compared the distribution of network scores generated by our optimized pruned networks from multiple training sets, with the distribution of scores corresponding to a population of randomly generated expression patterns (Figure 6). This population of random expression patterns was generated assigning randomly one of the following values for each gene in the network: upregulated, downregulated, invariant-up and invariant-down. These values correspond to genes that in a Booleanized model changes from 0 to 1 and from 1 to 0 in the first two cases, and that remain invariant in 1 and 0 for the latter two cases, respectively. Once we assign values to all genes, expression patterns are scored using the Booleanized phenotypes from experimental data. This scoring scheme is the same used during the optimization process, reflecting the match between the random expression pattern and the experimental Booleanized phenotypes. We repeated the process 10 000 times, obtaining a population of random expression patterns with the respective scores. Then, we compared this population with the population of optimized pruned networks (30 alternative pruned networks, which constitute the last population of optimized pruned networks after the last iteration of the algorithm) for 20 different and randomly selected training and predicted sets of genes. We use different training sets to perform this cross-validation, since not all possible training sets are equally predictive due to the fact that not all genes are equally informative according to our method. For example, highly connected genes are in general more informative than genes with few interactions. Preliminary tests showed that the optimal percentage of genes for which gene expression values can be predicted was 35%, based on the expression values of the remaining 65%. For instance, in the HL60 network, that includes 18 genes, 12 genes were used to predict the expression values of the remaining six genes for 20 different combinations of training and predicted genes. Then, we scored the match between predictions and expression data using the same scoring process as in the pruning, but now considering all the 18 genes since some of the computed expression values of the training set genes could mismatch with experimental expression values. Therefore, we have a population of 600 pruned networks (30 × 20) with the corresponding scores. Then, we proceeded to compare this population with the randomly generated population of scored expression patterns. This comparison was done to show that gene expression predicted values were better than those predicted by chance.
Figure 6.

Workflow for validation of predictions. Comparison between the distributions of network scores generated by our optimized pruned networks and the distribution of network scores corresponding to a population of randomly generated expression patterns. This strategy was done from multiple training sets.
Furthermore, we used the Welch’s t-test to estimate the similarity between the predicted and randomly generated populations of gene expression values scores. Results demonstrated that the P-values for the similarity of the two distributions were very low for the three examples, stressing the statistical significance of predictions obtained by our algorithm. Figure 7 shows the cumulative frequency distributions of the scores for each example, illustrating that pruned network tends to have steady states describing well cellular phenotypes. Particularly, 10% of highest scoring random expression patterns have scores above 0.47, 0.39 and 0.42 for HL60, EMT and MPC networks, respectively. The corresponding scores using the optimized networks increased to 0.94, 0.59 and 0.52, and the corresponding P-values using the Welch’s t-test are 2.2e−16, 2.812e−9 and 2.2e−16 (Figure 6).
Figure 7.

The cumulative frequency distribution of the scores, which indicate similarity to the experimental phenotypes, applying the algorithm for the HL60 (top), EMT (middle) and MPC (bottom) networks. The above plot shows that for example, 10% of highest scoring within the population of random expression patterns have scores above 0.47, 0.39, 0.42 for HL60, EMT and MPC networks, respectively. The corresponding scores using the optimized networks increased to 0.94, 0.59 and 0.52. Evidently, for less complex networks such as HL60, the prediction performance increases. The corresponding P-values for the Welch’s t-test of the hypothesis that both distributions have the same true mean are 2.2e−16, 2.812e−9 and 2.2e−16.
Expanded gene regulatory networks of HL60, EMT and MPC: prediction of missing expression values
Once we validated the method by predicting previously known expression values using different training and predicted sets, we applied this strategy to predict expression values of new genes in expanded gene regulatory networks of HL60, EMT and MPC.
The strategy to expand the networks was the following. We looked in literature [using Ariadne’s Med Scan technology (31,32)] for interactions that allow us to connect new genes to our original networks in such a way that they are included in regulatory circuits, i.e. the signal flows from the original network to the genes and back, so all the new genes have incoming and outgoing edges. The list of genes involved in such circuits was compared with a list of candidate genes. Genes present in both lists were selected, and these genes and their corresponding interactions were used to obtain the expanded network. The lists of candidate genes were obtained from a specific experiment in the case of the HL60 network (3). In the cases of the EMT and MPC networks the lists of candidate genes were obtained from Biograph, a data mining frame-work for the computational identification of suitable targets among candidate genes in a biomedical context (33). Using Biograph we obtained two lists with the 100 top scoring genes involved in the epithelial–mesenchymal transition and mesodermal–osteoblast differentiation. The genes that were common between the lists obtained by Biograph, and those involved in the circuits described above, were used to expand the networks, and their expression values were predicted applying our approach.
HL60
The list of candidate genes for the network expansion was extracted from an experiment performed by Huang et al. (3). In this work the authors applied two different treatments (different in dosage and duration but using the same agent, all-trans-retinoic acid or ATRA) to an HL60 multipotentpromyelocyticleukemia cell line, generating two populations at the apparently same stage of differentiation. However, once the treatments finished, one of the populations proceeded toward a differentiated neutrophil population while the other one reverted back toward the undifferentiated promyelocytic state. The list of genes differentially expressed between these two populations (see Supplementary Data for details), potentially relevant for the neutrophil differentiation process, was used to expand our original HL60 gene regulatory network constructed using only genes differentially expressed between the undifferentiated promyelocytic and differentiated neutrophil states. Notice that genes differentially expressed according to the experiment performed by Huang et al. (3) constitute a comparison between two populations of cells in transient states, and they cannot be considered differentially expressed genes between the two stable phenotypes (HL60 and neutrophils). To illustrate the integration of the two experiments used to construct the HL60 expanded example we included the Supplementary Figure S11.
This procedure allowed us to add six new genes and 15 new interactions (seven activations and eight inhibitions), four (ORM1, CCNE1, TRH and PLK1) from the new list of genes and two (CDKN1A and CAST) from the original list of differentially expressed genes between the undifferentiated promyelocytic and differentiated neutrophil states, that can be included in the gene regulatory network now thanks to the connectivity with the other four new genes (see Table 3 and Figure 8a and b). After computing the attractors of this expanded network using the Boolean model with the synchronous updating scheme we obtained only one steady state or fixed point with all the genes in ‘OFF’ but CAST, PLK1 and TRH. Clearly this network is not suitable to describe a system with at least two steady states or fixed points
Table 3.
HL60 expanded example
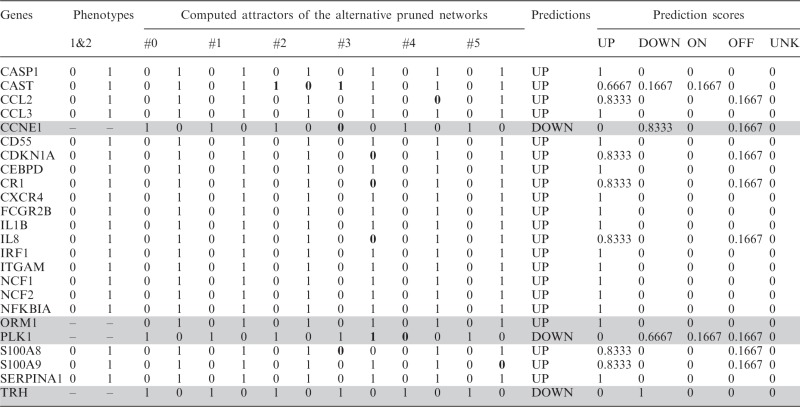 |
The table shows the computed attractors for the six best optimized pruned networks, the predicted expression values and the confidence scores. All predictions obtained high confidence scores that reflect a good consensus in the attractors of different optimized pruned networks. Discrepancies in the attractors are represented in bold. Genes without experimental expression values are highlighted in grey.
Figure 8.

(a) HL60 network. Genes in red are upregulated according to experimental expression values (b) HL60 expanded network. Genes in red and grey are upregulated and unknown, respectively. Six new genes and 15 new interactions (seven activations and eight inhibitions) were added: four (ORM1, CCNE1, TRH and PLK1) from the new list of genes and two (CDKN1A and CAST) from the original list of differentially expressed genes between the undifferentiated promyelocytic and differentiated neutrophil states. (c) Genes in pale red and pale blue correspond with genes predicted as upregulated and downregulated, respectively. (d) Prediction scores of HL60 expanded network.
Once we have this expanded HL60 gene regulatory network with 24 nodes and 54 interactions (44 activations and 10 inhibitions) our algorithm was applied to prune the network and predict the values of the newly added genes (see Table 3 and Figure 8c and d).
The consistency of the predictions between different pruned networks was very high (Table 2) due to the fact that the attractors are practically identical for all the networks, with highest prediction scores always > 0.66, according to the definition given in the ‘Materials and Methods’ section, meaning that at least 66% of the optimized pruned networks gave the same prediction for any given gene. Discrepancies in the attractors are represented in Table 3 (in bold).
Table 2.
Gene regulatory networks of three expanded examplesa
| Network properties | HL60–neutrophils expanded | EMT expanded | MPC–osteoblast expanded |
|---|---|---|---|
| Number of nodes | 24 | 50 | 73 |
| Number of edges | 54 | 182 | 193 |
| Activations | 44 | 134 | 134 |
| Inhibitions | 10 | 48 | 72 |
| Feed-back loops (circuits) | |||
| Positive | 8 | 1533 | 1771 |
| Negative | 3 | 1566 | 1802 |
| Feed-forward loops (up to 5 nodes) | 829 | 46 807 | 3009 |
aHL60–neutrophil differentiation network, epithelial–mesenchymal transition network, MPC-osteoblast differentiation network. Information about number of nodes, edges, circuits and feed-forward loops is shown in the table.
Interestingly, the predicted expression for three of these four new genes, ORM1, CCNE1 and PLK1 is consistent with the expression profile of the population of stimulated promyelocytic cells that are going to differentiate to neutrophils in the experiment performed by Huang et al. (3) where ORM1 is upregulated and CCNE1 and PLK1 are downregulated. There is a discrepancy between this experiment and our prediction concerning to TRH, which is upregulated in the experiment but downregulated in the predictions.
We also performed and experiment on the HL60 expanded network to test if not only the steady states but also the network response under perturbation (change of expression values) of specific genes are consistent for different optimized pruned networks. Interestingly, in the six top-scored pruned networks CASP1, IRF1 and IL1B were the genes able to trigger the transition from the HL60 to the neutrophil phenotype when perturbed. The perturbation of remaining genes failed to cause such a transition. These simulations showed that despite the differences in topology between different optimized pruned networks, the response under specific perturbations were consistent. These three triggering genes are involved in a positive circuit without incoming edges but with a number of genes directly or indirectly regulated by them, so they constitute a ‘head’ of regulation in a network that resembles the ‘medusa model’ described by Kauffman (34). In particular, IRF1 has been reported as an inductor of the myeloid differentiation of HL60 cells (35), which constitutes an experimental validation of the key role played by this gene in HL60 differentiation processes.
More details about these simulations and tables with the results are available in the Supplementary Information and Supplementary File SII, respectively.
EMT
The network expansion allowed us to add five new genes (BMP4, CTNNB1, EP300, TGFB1 and TP53) and 53 new interactions (42 activations and 11 inhibitions). Once we have this expanded EMT gene regulatory network with 50 nodes and 182 interactions (134 activations and 48 inhibitions) our algorithm was applied to prune the network and predict the values of the newly added genes. Three of these five genes, BMP4, CTNNB1 and EP300 were predicted as upregulated, invariant ‘OFF’ and invariant ‘OFF’, respectively, with highest prediction scores always >0.66, according to the definition given in the ‘Materials and Methods’ section, meaning that at least 66% of the optimized pruned networks gave the same prediction for any given gene. TGFB1 and TP53 were classified as ‘unknown’ due to discrepancies in its predictions within the family of optimized pruned networks. In both cases 50% of the pruned networks classified these genes as upregulated and the other 50% as invariant ‘ON’. Details about results are included in the Supplementary Information.
The prediction of BMP4 as upregulated is consistent with previously published work (36) where BMP4 was reported as an inducer of the epithelial–mesenchymal transition. CTNNB1 has been reported as downregulated by activation of TRKB in the context of EMT-like transformation (37). Although we predict CTNNB1 gene as invariant ‘OFF’ and not downregulated, the result is consistent with the absence of activity of this gene. Ep300 has been reported as involved in a regulatory mechanism regulating the transcriptional suppressor/activator role of ZEB1 in the epithelial–mesenchymal transition (38), acting as a cofactor for ZEB1 and causing the shift towards epithelial characteristics. These mechanisms are consistent with our prediction of Ep300 as inactive in the opposite transition from epithelial to mesenchymal.
MPC
The network expansion allowed us to add six new genes (BCL2, CTNNB1, IL6, JUN, TGFB1 and TP53) and 70 new interactions (49 activations and 21 inhibitions. Interestingly, three of these six genes were also included in the expansion of the EMT example. Once we have this expanded MPC gene regulatory network with 73 nodes and 193 interactions (134 activations and 72 inhibitions) our algorithm was applied to prune the network and predict the values of the newly added genes. Five of these six genes, CTNNB1, IL6, JUN, TGFB1 and TP53 were predicted as invariant ‘OFF’, upregulated, invariant ‘OFF’, upregulated and invariant ‘OFF’, respectively, with highest prediction scores always >0.5, according to the definition given in the ‘Materials and Methods’ section, meaning that at least 50% of the optimized pruned networks gave the same prediction for any given gene. BCL2 was classified as ‘unknown’ due to discrepancies in its predictions within the family of optimized pruned networks. A 50% of the pruned networks classified this gene as upregulated and the other 50% as invariant ‘ON’. Details about results are included in the Supplementary Information. The predicted upregulation of IL6 during the osteoblast differentiation process is consistent with previously published works about the role of IL6 and its receptor (39). The predicted inactive state of TP53 is also consistent with previously published works (40) where TP53-null osteoprogenitor cells have increased osteoblast maturation. TGFB1 has been reported as osteoblastic cell proliferation inductor (41), a description consistent with the predicted upregulation.
Impact of removed interactions on the match with expression values
To get some insights about the effect on the networks of interactions removed during the pruning process we re-introduced some of the least frequent interactions in the final population of optimized pruned networks. In the case of the HL60, re-introducing two interactions that were systematically removed in the pruning process produced a dramatic decrease in the match with expression data from 98.6% to 61.05%. In the case of EMT, the re-introduction of the 10 least frequent interactions within the optimized pruned networks led to a decrease in the match with expression data from 66.5% to 63.3%. Finally, in the MPC example the re-introduction of the ten least frequent interactions within the optimized pruned networks decreased the match with expression data from 57.5% to 55.8%. Details about re-introduced interactions and scores are included in the Supplementary Information. As we can see, the removal of these interactions during the pruning process allows us to construct network that better explain the experimental expression values, increasing the reliability of the predictions.
DISCUSSION
Here we propose a method that enables us to generate optimized pruned networks from literature to predict expression values of a fraction of genes in a network based on the knowledge of experimental stable gene expression values of the remaining genes in the network. This approach, which in particular searches for optimal populations of solutions of pruned networks, overcomes the limitations of classic optimization techniques that try to improve a single solution exploring a limited portion of the solution space. This allows detecting alternative pruned network solutions caused by the multiplicity in network connectivity, which increases the probability of achieving a global optimum that best fits theoretical gene expression values to the experimental ones. It is worth noting that the full agreement between experimental and predicted gene expression values is limited by lack of information on network connectivity.
In order to validate our method, we selected three examples (HL60–neutrophil differentiation, Epithelial–Mesenchymal transition, Mesodermal progenitor–Osteoblast differentiation) and showed the method performance in each case. Results show a good consistency between predicted and experimentally validated gene expression values. Moreover, we expanded the HL60 gene regulatory network with genes with no experimental gene expression values in order to demonstrate the utility of our method. Predicted expression values for these genes were shown to be consistent with independent experimental results. In addition, we carried out an in silico perturbation analysis of each gene corresponding to this expanded HL60 gene regulatory network and found a consistency in genes triggering the HL60-neutrophil differentiation. In particular, IRF1 has been reported as inductor of the myeloid differentiation of HL60 cells (35), which constitutes an experimental validation of the key role played by this gene in HL60 differentiation processes.
A possible extension of the current method could consider not only the existence of steady states but also cyclic stable states, which would require the existence of negative circuits. Such an extended method could be applied to gene regulatory network inference in biological systems with oscillatory behavior, such as cell cycles.
In summary, the presented method constitutes a useful tool for predicting missing or noisy gene expression values, and therefore can be used for curating experimental gene expression data and can help with data analysis, modeling and prediction.
SUPPLEMENTARY DATA
Supplementary Data are available at NAR Online: Supplementary Information, Supplementary Files I–V and Supplementary References [10–14, 27–32,42–50].
FUNDING
Funding for open access charge: Luxembourg Centre for Systems Biomedicine (LCSB) and Life Sciences Research unit (LSRU), University of Luxembourg.
Conflict of interest statement. None declared.
Supplementary Material
ACKNOWLEDGEMENTS
I,C., A,K., A.L.B. and A.dS. participated in the design of the method and drafted the manuscript. IC constructed the network data. I.C. and A.K. implemented the algorithms and performed data analysis. ALB coordinated the study. A.dS. conceived of the study, participated in its design and coordination, and supervised the project.
REFERENCES
- 1.Carro MS, Lim WK, Alvarez MJ, Bollo RJ, Zhao X, Snyder EY, Sulman EP, Anne SL, Doetsch F, Colman H, et al. The transcriptional network for mesenchymal transformation of brain tumours. Nature. 2010;463:318–325. doi: 10.1038/nature08712. [DOI] [PMC free article] [PubMed] [Google Scholar]
- 2.Margolin AA, Nemenman I, Basso K, Wiggins C, Stolovitzky G, Dalla Favera R, Califano A. ARACNE: an algorithm for the reconstruction of gene regulatory networks in a mammalian cellular context. BMC Bioinformatics. 2006;7(Suppl. 1):S7. doi: 10.1186/1471-2105-7-S1-S7. [DOI] [PMC free article] [PubMed] [Google Scholar]
- 3.Huang AC, Hu L, Kauffman SA, Zhang W, Shmulevich I. Using cell fate attractors to uncover transcriptional regulation of HL60 neutrophil differentiation. BMC Syst. Biol. 2009;3:20. doi: 10.1186/1752-0509-3-20. [DOI] [PMC free article] [PubMed] [Google Scholar]
- 4.Sachs K, Perez O, Pe'er D, Lauffenburger DA, Nolan GP. Causal protein-signaling networks derived from multiparameter single-cell data. Science. 2005;308:523–529. doi: 10.1126/science.1105809. [DOI] [PubMed] [Google Scholar]
- 5.Nelander S, Wang W, Nilsson B, She QB, Pratilas C, Rosen N, Gennemark P, Sander C. Models from experiments: combinatorial drug perturbations of cancer cells. Mol. Syst. Biol. 2008;4:216. doi: 10.1038/msb.2008.53. [DOI] [PMC free article] [PubMed] [Google Scholar]
- 6.Gat-Viks I, Shamir R. Chain functions and scoring functions in genetic networks. Bioinformatics. 2003;19(Suppl. 1):i108–i117. doi: 10.1093/bioinformatics/btg1014. [DOI] [PubMed] [Google Scholar]
- 7.Saez-Rodriguez J, Alexopoulos LG, Epperlein J, Samaga R, Lauffenburger DA, Klamt S, Sorger PK. Discrete logic modelling as a means to link protein signalling networks with functional analysis of mammalian signal transduction. Mol. Syst Biol. 2009;5:331. doi: 10.1038/msb.2009.87. [DOI] [PMC free article] [PubMed] [Google Scholar]
- 8.Gat-Viks I, Tanay A, Shamir R. Modeling and analysis of heterogeneous regulation in biological networks. J. Comput. Biol. J. Comput. Mol. Cell Biol. 2004;11:1034–1049. doi: 10.1089/cmb.2004.11.1034. [DOI] [PubMed] [Google Scholar]
- 9.Layek RK, Datta A, Dougherty ER. From biological pathways to regulatory networks. Mol. bioSyst. 2011;7:843–851. doi: 10.1039/c0mb00263a. [DOI] [PubMed] [Google Scholar]
- 10.Kauffman SA. Metabolic stability and epigenesis in randomly constructed genetic nets. J. Theor. Biol. 1969;22:437. doi: 10.1016/0022-5193(69)90015-0. [DOI] [PubMed] [Google Scholar]
- 11.Kauffman SA. The Origins of Order. New York: Oxford University Press; 1993. 1993. [Google Scholar]
- 12.Huang S, Eichler G, Bar-Yam Y, Ingber DE. Cell fates as high-dimensional attractor states of a complex gene regulatory network. Phys Rev. Lett. 2005;94:128701. doi: 10.1103/PhysRevLett.94.128701. [DOI] [PubMed] [Google Scholar]
- 13.Garg A, Di Cara A, Xenarios I, Mendoza L, De Micheli G. Synchronous versus asynchronous modeling of gene regulatory networks. Bioinformatics. 2008;24:1917–1925. doi: 10.1093/bioinformatics/btn336. [DOI] [PMC free article] [PubMed] [Google Scholar]
- 14.Garg A, Xenarios I, Mendoza L, DeMicheli G. An efficient method for dynamic analysis of gene regulatory networks and in silico gene perturbation experimentsresearch in computational molecular biology. In: Speed T, Huang H, editors. Lecture Notes in Computer Science. Vol. 4453. Heidelberg: Springer Berlin; 2007. pp. , pppp. 62–76. [Google Scholar]
- 15.Mussel C, Hopfensitz M, Kestler HA. BoolNet–an R package for generation, reconstruction and analysis of Boolean networks. Bioinformatics. 2010;26:1378–1380. doi: 10.1093/bioinformatics/btq124. [DOI] [PubMed] [Google Scholar]
- 16.Gonzalez AG, Naldi A, Sanchez L, Thieffry D, Chaouiya C. GINsim: a software suite for the qualitative modelling, simulation and analysis of regulatory networks. Bio Systems. 2006;84:91–100. doi: 10.1016/j.biosystems.2005.10.003. [DOI] [PubMed] [Google Scholar]
- 17.Thomas R, Thieffry D, Kaufman M. Dynamical behavior of biological regulatory networks.1. Biological role of feedback loops and practical use of the concept of the loop-characteristic state. Bull. Mathemat. Biol. 1995;57:247–276. doi: 10.1007/BF02460618. [DOI] [PubMed] [Google Scholar]
- 18.Armananzas R, Inza I, Santana R, Saeys Y, Flores JL, Lozano JA, Van de Peer Y, Blanco R, Robles V, Bielza C, et al. A review of estimation of distribution algorithms in bioinformatics. BioData mining. 2008;1:6. doi: 10.1186/1756-0381-1-6. [DOI] [PMC free article] [PubMed] [Google Scholar]
- 19.Mendoza L, Xenarios I. A method for the generation of standardized qualitative dynamical systems of regulatory networks. Theor. Biol. Med. Modelling. 2006;3:13. doi: 10.1186/1742-4682-3-13. [DOI] [PMC free article] [PubMed] [Google Scholar]
- 20.Garg A, Mendoza L, Xenarios I, DeMicheli G. Modeling of multiple valued gene regulatory networks. 2007 doi: 10.1109/IEMBS.2007.4352560. . Conference proceedings: Annual International Conference of the IEEE Engineering in Medicine and Biology Society IEEE Engineering in Medicine and Biology Society Conference 2007, Lyon, France, pp. 1398–1404. [DOI] [PubMed] [Google Scholar]
- 21.Thomas R. Laws for the dynamics of regulatory networks. Int. J. Dev. Biol. 1998;42:479–485. [PubMed] [Google Scholar]
- 22.Mendelson E. Schaum's Outline of Boolean Algebra and Switching Circuits. New York: McGraw-Hill; 1970. [Google Scholar]
- 23.Speed THH. Regulatory networks and in-silico gene perturbation experiments. Research in Computational Molecular Biology. Springer Berlin, Heidelberg, pp. 62–76. Lect. Notes Comput. Sci. 2007;4453:62–76. [Google Scholar]
- 24.Johnson DB. Finding all the elementary circuits of a directed graph. SIAM J. Comput. 1975;4:77–84. [Google Scholar]
- 25.Le Bechec A, Zindy P, Sierocinski T, Petritis D, Bihouee A, Le Meur N, Leger J, Theret N. M@IA: a modular open-source application for microarray workflow and integrative datamining. In Silico Biol. 2008;8:63–69. [PubMed] [Google Scholar]
- 26.Di Cara A, Garg A, De Micheli G, Xenarios I, Mendoza L. Dynamic simulation of regulatory networks using SQUAD. BMC Bioinformatics. 2007;8:462. doi: 10.1186/1471-2105-8-462. [DOI] [PMC free article] [PubMed] [Google Scholar]
- 27.Gallagher R, Collins S, Trujillo J, McCredie K, Ahearn M, Tsai S, Metzgar R, Aulakh G, Ting R, Ruscetti F, et al. Characterization of the continuous, differentiating myeloid cell line (HL-60) from a patient with acute promyelocytic leukemia. Blood. 1979;54:713–733. [PubMed] [Google Scholar]
- 28.Mollinedo F, Lopez-Perez R, Gajate C. Differential gene expression patterns coupled to commitment and acquisition of phenotypic hallmarks during neutrophil differentiation of human leukaemia HL-60 cells. Gene. 2008;419:16–26. doi: 10.1016/j.gene.2008.04.015. [DOI] [PubMed] [Google Scholar]
- 29.Vetter G, Le Bechec A, Muller J, Muller A, Moes M, Yatskou M, Al Tanoury Z, Poch O, Vallar L, Friederich E. Time-resolved analysis of transcriptional events during SNAI1-triggered epithelial to mesenchymal transition. Biochem. Biophys. Res. Commun. 2009;385:485–491. doi: 10.1016/j.bbrc.2009.05.025. [DOI] [PubMed] [Google Scholar]
- 30.Qi H, Aguiar DJ, Williams SM, La Pean A, Pan W, Verfaillie CM. Identification of genes responsible for osteoblast differentiation from human mesodermal progenitor cells. Proc. Natl Acad. Sci. USA. 2003;100:3305–3310. doi: 10.1073/pnas.0532693100. [DOI] [PMC free article] [PubMed] [Google Scholar]
- 31.Novichkova S, Egorov S, Daraselia N. MedScan, a natural language processing engine for MEDLINE abstracts. Bioinformatics. 2003;19:1699–1706. doi: 10.1093/bioinformatics/btg207. [DOI] [PubMed] [Google Scholar]
- 32.Daraselia N, Yuryev A, Egorov S, Novichkova S, Nikitin A, Mazo I. Extracting human protein interactions from MEDLINE using a full-sentence parser. Bioinformatics. 2004;20:604–611. doi: 10.1093/bioinformatics/btg452. [DOI] [PubMed] [Google Scholar]
- 33.Liekens AM, De Knijf J, Daelemans W, Goethals B, De Rijk P, Del-Favero J. BioGraph: unsupervised biomedical knowledge discovery via automated hypothesis generation. Genome Biol. 2011;12:R57. doi: 10.1186/gb-2011-12-6-r57. [DOI] [PMC free article] [PubMed] [Google Scholar]
- 34.Kauffman S. A proposal for using the ensemble approach to understand genetic regulatory networks. J. Theor. Biol. 2004;230:581–590. doi: 10.1016/j.jtbi.2003.12.017. [DOI] [PubMed] [Google Scholar]
- 35.Shen M, Bunaciu RP, Congleton J, Jensen HA, Sayam LG, Varner JD, Yen A. Interferon regulatory factor-1 binds c-Cbl, enhances mitogen activated protein kinase signaling and promotes retinoic acid-induced differentiation of HL-60 human myelo-monoblastic leukemia cells. Leukemia Lymphoma. 2011;52:2372–2379. doi: 10.3109/10428194.2011.603449. [DOI] [PMC free article] [PubMed] [Google Scholar]
- 36.Molloy EL, Adams A, Moore JB, Masterson JC, Madrigal-Estebas L, Mahon BP, O'Dea S. BMP4 induces an epithelial-mesenchymal transition-like response in adult airway epithelial cells. Growth Factors. 2008;26:12–22. doi: 10.1080/08977190801987166. [DOI] [PubMed] [Google Scholar]
- 37.Smit MA, Geiger TR, Song JY, Gitelman I, Peeper DS. A twist-snail axis critical for TrkB-induced epithelial-mesenchymal transition-like transformation, anoikis resistance, and metastasis. Mol. Cell. Biol. 2009;29:3722–3737. doi: 10.1128/MCB.01164-08. [DOI] [PMC free article] [PubMed] [Google Scholar]
- 38.Mizuguchi Y, Specht S, Lunz JG, 3rd, Isse K, Corbitt N, Takizawa T, Demetris AJ. Cooperation of p300 and PCAF in the control of microRNA 200c/141 transcription and epithelial characteristics. PloS One. 2012;7:e32449. doi: 10.1371/journal.pone.0032449. [DOI] [PMC free article] [PubMed] [Google Scholar]
- 39.Li Y, Backesjo CM, Haldosen LA, Lindgren U. IL-6 receptor expression and IL-6 effects change during osteoblast differentiation. Cytokine. 2008;43:165–173. doi: 10.1016/j.cyto.2008.05.007. [DOI] [PubMed] [Google Scholar]
- 40.Lengner CJ, Steinman HA, Gagnon J, Smith TW, Henderson JE, Kream BE, Stein GS, Lian JB, Jones SN. Osteoblast differentiation and skeletal development are regulated by Mdm2-p53 signaling. J. Cell Biol. 2006;172:909–921. doi: 10.1083/jcb.200508130. [DOI] [PMC free article] [PubMed] [Google Scholar]
- 41.Kassem M, Kveiborg M, Eriksen EF. Production and action of transforming growth factor-beta in human osteoblast cultures: dependence on cell differentiation and modulation by calcitriol. Eur. J. Clin. Invest. 2000;30:429–437. doi: 10.1046/j.1365-2362.2000.00645.x. [DOI] [PubMed] [Google Scholar]
- 42.Breitman TR, Selonick SE, Collins SJ. Induction of differentiation of the human promyelocytic leukemia cell line (HL-60) by retinoic acid. Proc. Natl Acad. Sci. USA. 1980;77:2936–2940. doi: 10.1073/pnas.77.5.2936. [DOI] [PMC free article] [PubMed] [Google Scholar]
- 43.Collins SJ, Ruscetti FW, Gallagher RE, Gallo RC. Terminal differentiation of human promyelocytic leukemia cells induced by dimethyl sulfoxide and other polar compounds. Proc. Natl Acad. Sci. USA. 1978;75:2458–2462. doi: 10.1073/pnas.75.5.2458. [DOI] [PMC free article] [PubMed] [Google Scholar]
- 44.McCarthy DM, San Miguel JF, Freake HC, Green PM, Zola H, Catovsky D, Goldman JM. 1,25-dihydroxyvitamin D3 inhibits proliferation of human promyelocytic leukaemia (HL60) cells and induces monocyte-macrophage differentiation in HL60 and normal human bone marrow cells. Leukemia Res. 1983;7:51–55. doi: 10.1016/0145-2126(83)90057-7. [DOI] [PubMed] [Google Scholar]
- 45.Rovera G, Santoli D, Damsky C. Human promyelocytic leukemia cells in culture differentiate into macrophage-like cells when treated with a phorbol diester. Proc. Natl Acad. Sci. USA. 1979;76:2779–2783. doi: 10.1073/pnas.76.6.2779. [DOI] [PMC free article] [PubMed] [Google Scholar]
- 46.Smoot ME, Ono K, Ruscheinski J, Wang PL, Ideker T. Cytoscape 2.8: new features for data integration and network visualization. Bioinformatics. 2011;27:431–432. doi: 10.1093/bioinformatics/btq675. [DOI] [PMC free article] [PubMed] [Google Scholar]
- 47.Somenzi CUDD. CU Decision Diagram Package Release 2.4.1. 2005. University of Colorado at Boulder 2005. [Google Scholar]
- 48.Tomonaga M, Golde DW, Gasson JC. Biosynthetic (recombinant) human granulocyte-macrophage colony-stimulating factor: effect on normal bone marrow and leukemia cell lines. Blood. 1986;67:31–36. [PubMed] [Google Scholar]
- 49.Xie AaB PA. Efficient State Classification of Finite State Markov Chains. Proc of DAC. 1998. 1998. [Google Scholar]
- 50.Zinovyev A, Viara E, Calzone L, Barillot E. BiNoM: a Cytoscape plugin for manipulating and analyzing biological networks. Bioinformatics. 2008;24:876–877. doi: 10.1093/bioinformatics/btm553. [DOI] [PubMed] [Google Scholar]
Associated Data
This section collects any data citations, data availability statements, or supplementary materials included in this article.