


Abstract
The thousand genomes project and many similar ongoing large-scale sequencing efforts require new methods to predict functional variants in both coding and non-coding regions in order to understand phenotype and genotype relationships. We report the design of a new model SInBaD (Sequence-Information-Based-Decision-model) which relies on nucleotide conservation information to evaluate any annotated human variant in all known exons, introns, splice junctions and promoter regions. SInBaD builds separate mathematical models for promoters, exons and introns, using the human disease mutations annotated in human gene mutation database as the training dataset for functional variants. The ten-fold cross validation shows high prediction accuracy. Validations on test datasets, demonstrate that variants predicted as functional have a significantly higher occurrence in cancer patients. We also applied our model to variants found in four different individual human genomes to identify a set of functional variants, which might be of interest for further studies. Scores for any possible variants for all annotated genes are available under http://tingchenlab.cmb.usc.edu/sinbad/. SInBaD supports the current standard format of genotyping, the variant call files (VCF 4.0), making it easy to integrate it into any existing next-generation sequencing pipeline. The accuracy of SNP detection poses the only limitation to the use of SInBaD.
INTRODUCTION
Understanding the principles of phenotype development caused by genomic mutations remains a challenge. Many Single Nucleotide Polymorphism (SNPs) SNPs are considered to have little functional effect (1). However, identifying the functional variants causing distinct phenotypes, can immensely contribute toward a better understanding of the causal relationship between phenotype and genotype. Though we are still far away from a universal solution, considerable progress has been made in recent years. Next-generation sequencing technologies allow for cheaper and faster sequencing of individual genomes (2) and with the advent of the 1000 genomes project (3) and many similar efforts, the accumulation of complete individual genomes will contribute greatly toward the development of better tools for the analysis of specific variants and subsequently toward many other areas of research.
Currently, the detection of disease variants can generally be divided into two approaches. Genome-wide association studies (GWASs) aim at finding statistically significant variants associated with certain phenotypes. Properly designed association studies have shown some success in the past (4), though they do require a large sample size to achieve sufficient statistical power (5). Although cost is not a major influencing factor for these type of studies anymore, limited sample sizes and thus multiple testing issues pose a challenge. The sample size problem can be addressed by focusing on particular target regions. Unfortunately this will require assumptions about the loci correlated with a given phenotype, which might not be known. Associations to non-genic regions frequently observed in GWAS pose further problems.
Another group of approaches focuses on the identification of deleterious mutations within protein coding regions using different techniques to find a prediction function between the predictor (properties or features of a variant) and response variables (deleterious or not). The design of these models require formulating a proper feature representation of a variant. Typically, such a feature representation requires annotation information from different databases, as well as amino acid sequence information (6–8). Some methods require protein structure annotations, which are only available for a small fraction of the protein coding genes (6,9). The caveat of involving protein structure in prediction has been discussed before by Ng and Henikoff (10).
Although there are many more methods predicting phenotypic function of protein coding variants (11–14), the most commonly used are SIFT (15), PolyPhen (9) and MSRV (6).
More recent studies utilize the effects of natural selection on different regions of the genome to guide the search for functional regions. Chun and Fay (8) proposed a likelihood ratio test, to check for negative selection within coding region variants.
The information required for predicting deleterious variants is specifically chosen to aid in the prediction of functional variants in coding regions, and therefore it is usually a problem to extend these models to other parts of the genome. However, it is commonly known that variants in intergenic regions, promoter regions, and intron regions can strongly influence the phenotypic outcome (16–18). GERP (19) as well as MutationTaster (20) aim at overcoming these limitations when predicting deleterious variants. MutationTaster is based on a naive Bayes classifier in order to identify deleterious variants in coding regions and splice junctions, GERP uses a ‘rejected substitution score’ based on nucleotide sequence alignments in order to find regions under evolutionary constraint. Yandell et al. (21) introduced an approach to include variants in non-coding regions. The parameter estimation is restricted to ENCODE annotated regulatory regions, which does not account for the heterogeneity in molecular mechanisms observed across the different non-coding regions.
Here, we investigated the possibilities of extending the detection of functional variants to all intron and promoter regions through use of nucleotide conservation. We have created a new model, SInBaD (Sequence-INformation-BAsed-Decision-model), in which feature representation of mutations is based on nucleotide sequence conservation across multiple vertebrate species, similar to GERP (19) and VAAST (21). Multiple species sequence alignments, available from the UCSC database throughout the whole human genome, allow us to find functional variants in regions other than just the coding regions. The idea also reveals some similarity to the evolutionary model described above [8]. However, we do not assume an explicit model of evolution, but implicitly learn the different conservation levels and the evolutionary history observed in disease and background variants. Another major difference to Chun and Fay [8] is that our feature representation is based on nucleotide information, assuming that negative selection on amino acids translates into sufficient negative selection at the nucleotide level, similar to Yandell et al. (21). Therefore, we expect to see high species conservation for positions likely to be functional, whereas non-functional variants are more likely to appear in low conserved regions. Additional features are provided in intron and promoter region to supplement the multiple sequence alignment information.
MATERIALS AND METHODS
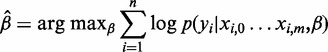
Our approach is based on a supervised learning strategy, which requires a training dataset representing functional and non-functional variants. The human gene mutation database (HGMD) (22) provides a large set of disease variants within different functional gene regions. We used this dataset to represent functional variants. Non-functional variants within this study are supposed to represent a set of background variants. The properties of different genomic regions vary with their function, so we designed a different set of background variants for each functional gene region. Our model for coding regions required a random sample of synonymous coding variants, since these are usually considered non-functional. For any other region we created the background dataset by simulating random variants within each functional gene region. Each variant is represented by its level of conservation across species and the degree of conservation is based on nucleotide sequence conservation. Essentially each variant is represented as a bit vector of observing a particular base pair at the aligned position within other species (Fig. 1). A logistic regression model has been used to create a mapping function separating the background variants from functional variants based on these features and control for possible over fitting behavior at the same time. Ten-fold cross-validation has been used to determine thresholds for 10, 5 and 1% false positive rates providing us with comparable sets of functional variants across the different regions.
Figure 1.
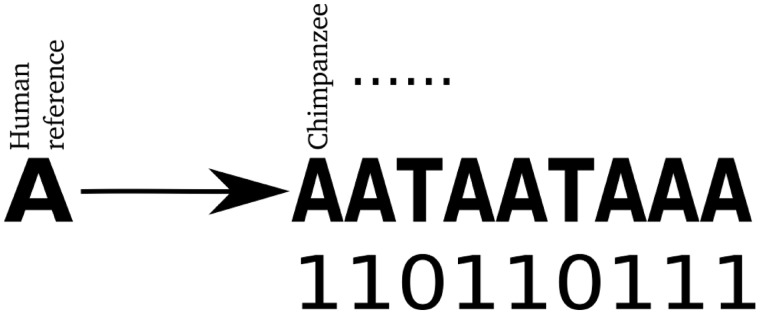
The generation of the conservation bit vector. The reference allele of the human reference genome (left) is compared with the aligned vertebrates (right). Each feature represents a species. For each species we assign the corresponding feature a ‘1’ in case of a match, and ‘0’ otherwise.
Statistical learning
The class membership probability in logistic regression is modeled in the following way. Let  being the n-dimensional vector of class labels where
  denoting the feature matrix, where
  and
and  with
with  being the vector of regression coefficients to be estimated and m is the number of features being used, then
| (1) |
The regression coefficients can then be estimated as
 |
(2) |
with n indicating the size of the training data and xi,j is feature j for variant i. The estimated coefficients can now be used to calculate the class membership probability for previously unseen data.
We created three different logistic regression models (promoter variants, coding variants and intronic variants) based on three sets of training data, consisting of variants provided by the HGMD and a set of simulated non-functional background variants.
Feature representation
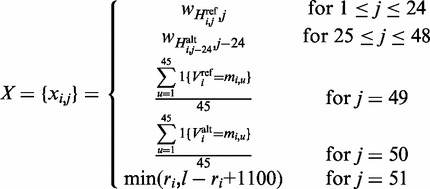
This section describes the design of the feature representation matrix X, which is different for different gene regions. We represent a variant by nucleotide conservation based on genome-wide multiple sequence alignment. Intron and promoter regions are designed to include further information to aid in an accurate classification.
Features in coding regions
Our coding region feature model represents a variant by its conservation across other vertebrates at that particular position. We used the multiple sequence alignment dataset for hg19 provided by the UCSC database (23) generated by the ‘Multiz’ algorithm, which compares 45 vertebrates genomes with the human genome. Based on our assumption that functional mutations are likely to be conserved across species, we derived a binary vector indicating whether the human reference allele, as well as the mutated allele, is observed in the different species. If 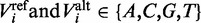 are the reference and alternate base pairs of variant i, and let
  be the base pair of species j aligned with variant i, then
 |
(3) |
In order to avoid functional predictions at positions where no multiple alignment coverage can be provided, we treated gaps in the alignment like mismatches ( ), avoiding false predictions. This binary vector (Figure 1) is a raw representation of conservation across species taking into account evolutionary constraints.
Coding region variants are purely based on the conservation model. We did not add any further region-specific features (24).
Features in intron regions
Let  with
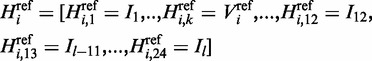
with 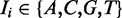 represent the sequence of the intron region and assume variant i is located in position k in the intron sequence with length l. The feature matrix in intron regions is designed to include information about splicing signals within the conserved 12 bp region of the splice junction (
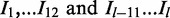 ). We are capturing that information by calculating scores from a position weight matrix (PWM) for all variants within the intron region. Without loss of generality assume that
  . Then for each variant we can determine the splice junction sequence with the reference allele as
 |
(4) |
and similarly the sequence for the alternate allele is
| (5) |
We define our PWM as
| (6) |
where 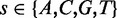 and
and  is the probability of observing base pair s at position t of the splice junction motif.
  is the probability of observing base pair s in the background.
  represents the ‘first’ 12 bp in the intron region at the donor site (
 ),
),  represents the ‘last’ 12 bp in the intron region at the acceptor site (
 ).
).  is estimated from all known human splice junctions within the UCSC database. To capture the most common intron types found, the training of the PWM has been restricted to introns exhibiting the commonly known GT-AG motif at the splice junctions.
  is estimated by using the full human genome. Adopting the notation from the previous paragraph, where
  and
and  represent the reference and alternate allele of variant i, and
  is the base pair of species j aligned with the i-th variant in the dataset (
 ), then the feature matrix takes the form
 |
(7) |
where  is the position of the i-th variant of the dataset within the intron and
  is an indicator function.
  describes the splice junction information, while j = 49 and j = 50 describe the nucleotide conservation across species and j = 51 describes the distance to the nearest splice junction. Since intron regions exhibit significant length variation we set a maximum distance of 100 bp, beyond which the distance feature is set to the maximum in order to avoid inflation of the score for very long intron regions. The distribution of the distance to the nearest splice junctions of HGMD variants are available in Supplementary Figure S1.
Features in promoter regions
Possible discriminative features for promoter regions have been extensively discussed in (25,26). Variants within promoter region are represented by the distance between the transcription start site (TSS) and position of the variant based on the TSS annotations of the UCSC database. Since our nucleotide conservation-based feature model would be prone to overfitting problems due to the small amount of training data available, we restricted our features toward a simple frequency calculation of the bit vector for the reference allele and the distance to the TSS. Let l be the genomic location of the TSS, and  be the genomic location of variant i either upstream or downstream of the TSS, then the feature matrix is designed as
 |
(8) |
Determining false positive threshold
The parameters of a logistic regression model determined through maximum-likelihood estimation on the training data are commonly used to generalize the model to previously unseen data. For such new data points the probability of class membership can now be determined. Typically a new datapoint is classified to be a member of a particular class if its class membership probability exceeds 0.5. However, choosing different thresholds will lead to different specificities and sensitivities. In order to determine what threshold needs to be chosen for 10, 5 and 1% false positive rate we systematically explore different thresholds and calculate the corresponding average false positive rates based on a 10-fold cross-validation on the training data. These thresholds are being used to determine class memberships under specific false positive rates.
The model data
The data used in this study are divided into two sets. Throughout the manuscript, the training data refers to the set of variants used to train our models. The test data refers to the variants not used in the estimation of the regression coefficients and listed below, thus providing a measure of the performance of SInBaD.
Training data and cross-validation
The training datasets are taken from two sources. The deleterious variants were obtained from the HGMD (v.2011.3) (22). This database is one of the largest collection of disease causing variants, providing annotations in promoter, intron and exon regions.
Datasets representing the non-functional variants were selected by generating uniform random mutations across each gene region. We defined a promoter region to be ranging from 2000 bp upstream to 500 bp downstream of the TSS, as annotated by the UCSC database. Within that region, we selected uniformly a random position and picked a random base pair to be the generated alternate allele. Similarly, we generated variants for intron regions, representing the background distribution. The sizes of the training datasets are limited by the number of available disease variants. Therefore, we generated the same number of background variants for each dataset. We chose a different strategy to represent non-functional variants in coding regions, since most positions within coding regions are more likely to be functional. For that reason, we decided to use a random set of synonymous variants in coding regions as the non-functional variant dataset (Table 1).
Table 1.
This table shows the size of the training datasets (equal proportion of functional and non-functional data)
| Genomic region | Data size |
|---|---|
| Coding | 126 212 |
| Promoter | 1678 |
| Intron | 18 542 |
Test data
Our analysis of the cancer variants is based on the data available from the Supplementary Material in (27). We also used the COSMIC (Catalogue of Somatic Mutations in Cancer) dataset to demonstrate the performance of our model. The mutation data were obtained from the Sanger Institute Catalogue Of Somatic Mutations In Cancer web site, (http://www.sanger.ac.uk/cosmic (28)).
The dataset for the p53 variants is available from the IARC p53 database (www-p53.iarc.fr) (29). All variants were annotated as intron or coding region variants. Variants which appear multiple times are counted only as one entry.
The HapMap dataset for the CEU population is available from the HapMap project webpage (www.hapmap.org) (Phase 3, build 36) (1). The data for the variants from the three individual genomes are available from their project webpages (http://www.jcvi.org/cms/research/projects/huref (30), http://yh.genomics.org.cn (2) and http://jimwatsonsequence.cshl.edu (31). We removed heterozygous variants and only kept SNPs which differ from the reference allele.
Database
Based on the full training datasets we pre-calculated scores for all possible variants, within all genes, as annotated by the UCSC database. Promoter region predictions are based on the frequency of the bit vector in conjunction with the distance to TSS. Coding region variants are purely based on the core features, where intron region variants are based on the combination of sequence conservation features as described earlier, together with the scores retrieved from the PWM and the truncated distance to the nearest splice junction. We also support batch downloads from next-generation sequencing pipelines (VCF-format). In order to get a set of comparable functional variants across all different regions, we allow download based on FPR cut-offs determined by 10-fold cross-validation experiments on the training data. Final predictions for any possible variant within any annotated gene are available under http://tingchenlab.cmb.usc.edu/sinbad/.
RESULTS
Basic cross-validation analysis reveals high prediction accuracy
Ten-fold cross-validation experiments are a common way to evaluate the performance of supervised learning models. We performed cross-validation experiments for each functional gene region (i.e. exon, intron, promoter), to get a robust estimate of the error rates in our models. Using this method we obtain a first measure of the performance of our new model SInBaD in terms of prediction accuracies between functional and non-functional variants. Figure 2a shows the 10-fold cross-validation results of the training dataset in different functional regions.
Figure 2.
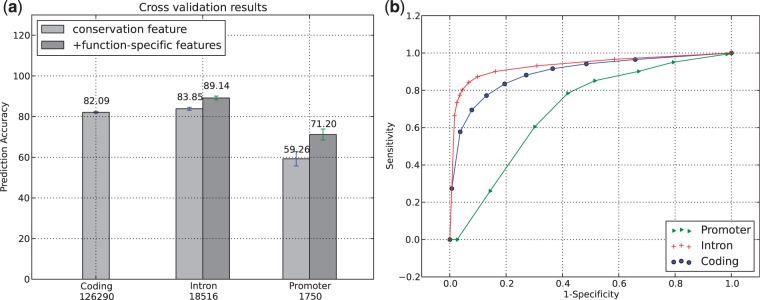
The bar plot on the left shows the 10-fold cross-validation accuracies for each model. Each set of bars refers to a specific gene region. The different shades of gray refer to a different set of features that were used for testing and training. ‘Conservation’ refers to the use of conservation features only, ‘function-specific features’ refers to the use of conservation features in conjunction with additional features (e.g. distance to TSS in promoter regions). The numbers on the x-axis indicate the size of the training dataset. The standard deviation bars demonstrate the variance of the accuracy across the different folds. The plot on the right shows the specificity/sensitivity trade-off using various class membership probability cut-offs to determine class membership on the training data.
After adding region-specific features, we observe throughout all models, prediction accuracies of at least 72%. The relationship between prediction accuracy and dataset size can be observed. Promoter regions show a larger cross-validation error than coding and intron regions, which is likely to be due to the small amount of training data available. The ROC-plots (Fig. 2b) confirm this behavior and demonstrate the trade-off between specificity and sensitivity in our models.
We expected a high performance of SInBaD using nucleotide conservation for coding regions. These regions are usually highly conserved at the amino acid level which we believe should also translate into conservation of nucleotide sequences. Our cross-validation results confirm, that nucleotide conservation is the most important feature in separating functional variants from synonymous variants in coding regions.
Distance feature in promoter regions improves prediction accuracy
Though knowledge about promoter regions is still limited, we can assume that variants within conserved elements of transcription factor binding sites (TFBSs) are likely to be functional. Therefore it would be desirable to incorporate such information in the feature representation. Figure 2a shows that we can obtain some signal for functional variant prediction by using interspecies conservation. In order to improve the prediction accuracy of functional variants within promoter regions, we included the distance to the TSS as a feature. We believe that due to our knowledge of the importance of certain distance constraints of some TFBSs like the -10 or the -35 boxes, we might be able to implicitly include TFBS constraints. This particular feature has previously been explored in (25).
A decrease of the cross-validation error rate was observed after including the distance information. Comparing the distance distribution of the known functional variants against the background dataset reveals that there is a high accumulation of disease variants close to the TSS. In fact, more than 70% of the known disease variants (HGMD) are located within a 500 bp window around the TSS (Supplementary Fig. S2). Sampling the background dataset uniformly within 2000 bp upstream or 500 bp downstream of the TSS creates a bias in the distance features between the two classes, which also influences performance (Supplementary Table S1). However, since many regulatory motifs are close to the TSS, this bias also reflects current biological data, and we retained that feature for that reason.
Additional species might not contribute toward higher accuracy
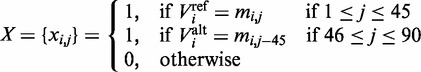
In the light of the Genome 10 K project (32) we also investigated to what degree each species contributes toward the prediction accuracy within the coding regions and whether additional species would contribute toward higher prediction accuracy. We generated multiple models for coding regions, using features from only one species at a time. For each of these species-specific models, we estimated the cross-validation accuracy. We hypothesized that within a proper model, the species which is evolutionary further away should generate more informative features since close species are too similar to provide much information. In order to confirm this hypothesis, we plotted the cross-validation accuracies estimated from each of the previous models against the evolutionary distance between each species and human.
The results can be seen in Figure 3 and it confirms our hypothesis that closely related species are not as informative as distantly related species. We also observe that the combination of features from all these different species, results in fact in a better 10-fold cross-validation accuracy than just using the features from the most distant species or the one with the best accuracy alone. This indicates that the combination of species as being used in our model, bears more functional information. It also seems as if evolutionary very distant species are approaching an upper bound, making it questionable to what extent additional species will contribute to a more accurate model.
Figure 3.

For each species, we are using the training data to perform 10-fold cross-validation to determine error rates, using only the features specific to that species. These error rates are then sorted by evolutionary distance and plotted above.
Test of functional cancer variants confirms accuracy
Ten-fold cross-validation results can be misleading in cases where the training dataset is biased. Therefore the validity of our scores has been tested in experimentally curated datasets that were not part of the training dataset. We first studied a set of mutations found within the p53 gene of cancer patients (29). One advantage of our model is the ability to predict functional variants in intron and promoter regions. This dataset provides variants in coding as well as in non-coding regions (introns) from 22 292 human individuals. Many of these cancer variants appear in multiple individuals. The number of variants in the test datasets used in the actual classification are shown in Table 2.
Table 2.
Summary of SInBaD classification results on cancer variants found in p53 dataset
| p53 dataset | p53 dataset | p53 dataset | |
|---|---|---|---|
| Missense | Intron | Synonymous | |
| Size | 1345 | 86 | 365 |
| Predicted | 778 | 27 | 30 |
| % | 57.84 | 35.53 | 8.22 |
‘Size’ is the number of non-redundant p53 variants in the dataset, ‘Predicted’ is the number of variants classified as functional with a class membership probability exceeding the 10% FPR threshold and % shows the frequency of variants classified as functional.
The major fraction of these variants are postulated to be functional. Therefore SInBaD should correctly identify the majority of these variants as functional in each gene region providing an estimate of the performance of our model in both intron and coding regions. Table 2 shows our results for the intron and coding (missense and synonymous) variants. Within coding regions about 57% of the annotated missense variants are identified as functional by our model at a 10% FPR threshold. Further investigation shows that within the set of variants classified as functional (under the default model), the average occurrence of each variant is 15.8 where non-functional variants only appear with an average occurrence of 3.9. Testing the occurrence distribution between these two datasets using a two-sided Wilcoxon rank sum test results in a P-value < 2.2 e−16 rejecting the null-hypothesis that the two distribution are the same. Figure 4 shows the distribution of the occurrence of each variant indicating the median and the inner quartile range. These results suggests that we are successfully classifying common cancer variants as functional and non-common cancer variants as non-functional.
Figure 4.

Box plot demonstrating the difference of the distributions of occurrence of p53-variants in cancer patients. The y-axis shows the number of occurrence of a particular p53-variant in cancer patients. The variants predicted as functional are occurring more frequently in cancer patients (left), than the variants considered to be non-functional (right). P-value is calculated based on the non-parametric Wilcoxon rank sum test. Range of box is defined as the inner quartile range, while the box is split into two parts by the median.
We performed a follow up analysis on the COSMIC dataset available from the Sanger institute (28). Within the 44 676 variants we classified 20 196 variants as functional (10% FPR). The average occurrence of the variants classified as functional is 5.53 compared with 1.31 within the variants classified as non-functional. Using a Wilcoxon rank sum test we do find that the two occurrence distributions are significantly different (P-value < 2.2 e−16) which is consistent with the above hypothesis.
We also analyzed a set of cancer mutations determined by Wood et al. (27). In that particular study, a combined experimental and computational approach was used to identify cancer-causing mutations. By comparing variants from normal cells to breast and colorectal cancer cells in coding regions and applying stringent filtering criteria, most of the non-somatic variants were eliminated. Examining the reported variants using our model shows that 54.1% are predicted as functional using a 10% FPR threshold (Table 3).
Table 3.
Summary of SInBaD classification results on cancer variants found in cancer variants found by Wood et al.
| Wood et al. | Wood et al. | |
|---|---|---|
| Missense | Synonymous | |
| Size | 1830 | 243 |
| Predicted | 990 | 22 |
| % | 54.10 | 9.05 |
’Size’ is the number of non-redundant cancer variants in the dataset, ‘Predicted’ is the number of variants classified as functional with a class membership probability exceeding the 10% FPR threshold and % shows the frequency of variants classified as functional.
Comparison to GERP
Though GERP and SInBaD are designed with different goals in mind, the similarity of information used, warrants a comparison between these two approaches. GERP is using multiple species alignment information to calculate a substitution rejection score in order to determine regions which are under evolutionary constraints. SInBaD is designed to score base pair substitution to assess whether that variant observed is functional. In order to test both approaches on previously unseen data, we selected randomly 2/3 of the training data in each region. We used this dataset to estimate the regression coefficients for each region. Based on these regression coefficients we calculated the class membership probability for the remaining 1/3 of the training data. Since the class labels are known for these variants, we calculated specificity and sensitivity for different class membership probability cut-offs. Finally we retrieved all GERP scores for these 1/3 of the training data and calculated the specificity and sensitivity across different GERP score cut-offs as well (Table 4 and Supplementary Fig. S3). Clearly there is still room for improvement in the classification for promoter regions, but it is encouraging to observe that specificity and sensitivity is consistently higher in SInBaD. As mentioned before, GERP is designed to find evolutionary constraint regions, which are possibly functional, and this comparison demonstrates that using that type of evolutionary information can be used to find functional variants.
Table 4.
Area under the curve across different gene regions based on ROC-plots (Supplementary Fig. S3) for GERP and SInBaD
| Region | AUC-GERP | AUC-SInBaD |
|---|---|---|
| Intron | 0.8921 | 0.9339 |
| Promoter | 0.5976 | 0.69 |
| Coding | 0.8453 | 0.8933 |
Small amount of functional variants in the HapMap dataset
The distribution of functional variants in the human genome was then studied on a large scale by using SInBaD to score population variants provided by the HapMap project (1). The HapMap dataset is a collection of variants curated from different healthy individuals from different populations. Our results show that, within coding regions, we predict about 11.57% (10% FPR) out of 24 270 HapMap variants from the CEU (Utah residents with Northern and Western European Ancestry) populations to be functional. Assuming that HapMap variants are in fact not functional, we observed that SInBaD can separate HapMap variants from a random set of intronic and coding disease variants (see Supplementary Figure S4 for Specificity/Sensitivity trade-off). There has been some controversy around the topic of whether and to what extent HapMap variants really capture phenotypic variations and therefore should be considered functional. Within the framework of our model, most HapMap variants are classified as non-functional. According to the neutral theory formulated by Kimura and Ohta (33) most observed polymorphism can be accounted for by random genetic drift of neutral mutations, which would be consistent with observing rather a small amount of actual functional variants.
Individual genome analysis shows a high amount of functional variants in intron and promoter regions
In a more recent study, (8) performed an analysis of the variants annotated within three available individual human genomes. Their approach of identifying deleterious variants using an evolutionary model and stringent quality filtering on these datasets, resulted in a set of deleterious variants for each individual. We performed a similar analysis on four of the currently available individual human genomes. Table 5 shows the number of homozygous variants differing from the reference genome, which we classified as functional within the different genomic regions under the default model.
Table 5.
Number of variants predicted to be functional (threshold set at 10% FPR) by our model
| Genome | Coding | Promoter | Intron |
|---|---|---|---|
| Watson size | 2533 | 11 426 | 121 624 |
| Watson predicted | 152 | 435 | 183 |
| Watson (%) | 6.00 | 3.81 | 0.15 |
| Venter size | 8045 | 38 032 | 457 316 |
| Venter predicted | 356 | 1265 | 557 |
| Venter (%) | 4.43 | 3.33 | 0.12 |
| Chinese size | 8383 | 36 474 | 333 016 |
| Chinese predicted | 379 | 1346 | 441 |
| Chinese (%) | 4.52 | 3.69 | 0.10 |
| Korean size | 7574 | 33 121 | 391 595 |
| Korean predicted | 359 | 1224 | 411 |
| Korean (%) | 4.74 | 3.7 | 0.10 |
The labels Watson, Venter, Chinese and Korean are referring to the different human genomes used for this table. Size refers to the number of variants within the different regions of the genome. Predicted shows the number of variants predicted by SInBaD to be functional, which are above the threshold set for 10% FPR.
Although, we are unable to perform a validation of the predicted functional variants, the numbers do demonstrate that our model selects a specific subset of functional variants. Adjusting the number of predictions by False Positive Rate determined through cross-validation of the training data results in comparable sets of variants from each genic region (Table 5). After adjusting by 10% FPR, we do predict a small subset of functional variants for further investigation.
DISCUSSION
We have developed SInBaD, a new model to identify functional variants for any set of positions within the whole length of any gene in the human genome. Similar to GERP (19) all scores are based on nucleotide sequence conservation, allowing us to extent prediction to non-coding region. The generated scores show high specificity in intron and coding regions and suggest a high correlation between the score and functionality of a variant. Test results on various other datasets confirm the specificity and overall performance of this model. Different sets of cancer variants demonstrate the performance of our model. Due to the size of the different datasets, results might not be complete, but we are confident that more training data would improve our current results. All results of the datasets we used are consistent with each other, providing confidence in our model.
Considering the amount and variety of phenotypes observed in human populations, it seems likely that many variants might have a potentially mild functional effect. Therefore, SInBaD offers a way to quantify the functionality of a variant, which can be integrated into a more complex model, representing the next step toward understanding more complex phenotypes.
SInBaD will be a useful tool for investigating functional variants. Our model allows for the selection of candidate variants within a specific gene for use in further experimental studies or within GWASs. It will complement current approaches by providing a more complete picture of variants in coding regions, as well as providing functional variant detection in non-coding regions.
We have also demonstrated the power of SInBaD by studying variants in the currently available human genomes. Based on our model we identified a set of variants we believe to be functional. We are able to analyze all variants in any coding region independent of structural or amino acid information. We are also able to include polymorphisms in intron and promoter regions as well as synonymous variants in coding regions. A more thorough investigation of these variants might clarify the phenotypic effects they might be causing. Applying our model on two different datasets of cancer variants we observed that variants predicted as functional by SInBaD are also observed more often across different individuals. Cancer mutations are commonly distinguished between driver and passenger mutations. Based on these results. We could ask why non-common cancer variants have low conservation across species. However, we do not think that we should draw any kind of conclusion about non-common cancer variants based on these results but rather take these results as an indication of the performance of SInBaD, that variants with high support are being correctly detected.
SInBaD demonstrates how evolutionary information can be combined with current knowledge in order to provide predictions for functional variants. Clearly SInBaD is heavily relying on multiple alignment information. We are using different models across different gene regions in order to account for the possibility of different levels of evolutionary constraints in functional variants. A major advantage of this approach is that we do not have to rely on experimental data or structural information which is limited to a subset of genes. Unfortunately inaccurate multiple alignments and the lack of homologous sequences in other vertebrates limit the accuracy of SInBaD. This can be seen in promoter and intron regions, where multiple alignments are more likely to be inaccurate and we used additional information to be able to make more accurate predictions. Finally we are working under the assumption that functional variants are under evolutionary constraints. That is a reasonable assumption to make, but not necessarily always true. One can imagine a situation in which a new variant might have arisen, crucial to normal human cell function, however never observed across other species.
SInBaD is designed to make reliable predictions and for that reason we do predict variants with lacking alignment information as being non-functional, sacrificing sensitivity. Clearly, our results show that functional variant prediction in non-coding regions remains a challenge. Our model is a first attempt at providing a more complete picture of functional variants and explores the extent to which species conservation can contribute toward functional variant detection.
Improvements might be achievable through a better variant feature representation. Such changes might be especially helpful in inter-genic and non-coding regions in order to overcome common issues associated with genome-wide multiple alignments. These problems are particularly prominent in non-coding regions, and therefore are likely to be affecting our predictions in non-coding regions. We have already studied a few such features here and incorporated them into our model (e.g. PWM in introns). Some features, like simple word-counts did not prove to be helpful in building the model for promoter regions. Further studies are necessary to reveal properties useful for improving and complementing current approaches. Classification of promoter region remains a particular challenge. The small dataset available, inaccurate alignments and our limited understanding of regulation pose a challenge to construct a proper feature set. Sophisticated approaches for finding regulatory signals exist and should be explored further. Studying different types of features revealed that in order to avoid over fitting, a simple two feature model consisting out of distance to TSS and reference allele conservation gave the best results. However, this approach limits the available information for a particular SNP and therefore our model cannot distinguish the effects of possible different derived alleles, which poses a limitation for our promoter model. A better understanding of promoter region and more accurate multiple alignment approaches might possibly help to overcome these problems in the future. Alternative splicing and overlapping gene causes another significant problem. Variants can be part of different non-coding regions at the same time. Furthermore it is known that splicing can be influenced by elements in the exon region of a gene. Therefore, a solution which is independent of categorizing a variant by gene region would be more desirable.
Using SInBaD to analyze variants encountered in four individual genomes (8) demonstrates the potential of such models. There is already an increased interest in using this type of method in GWASs or prioritizing variants and genes in experimental research (34–36) showing possible applications. To make it possible for anyone to evaluate any variant within any annotated gene, we generated all possible variants within annotated gene regions. Scores for all of these variants have been evaluated by our model and are available at http://tingchenlab.cmb.usc.edu/sinbad/index.html. Any score from any set of variants within annotated gene regions can be accessed this way and tested for functionality. We believe that further improvements on these methods are possible and these types of methods are likely to become an integrated part of genomic research in the future.
SUPPLEMENTARY DATA
Supplementary Data are available at NAR Online: Supplementary Table 1 and Supplementary Figures 1–4.
FUNDING
NIH Center of Excellence in Genomic Sciences (NIH/HG 2 P50 HG002790-06 and NIH/NHGRI 1U01 HG006531-01). Funding for open access charge: National Institutes of Health.
Conflict of interest statement. None declared.
Supplementary Material
ACKNOWLEDGEMENTS
We thank Y. Chen for his input on program efficiency matters, J. Kao, S. Srivastava, D. Campo and P. Marjoram for valuable comments on the manuscript.
REFERENCES
- 1.The Hapmap Consortium. The International HapMap Project. Nature. 2003;426:789–796. doi: 10.1038/nature02168. [DOI] [PubMed] [Google Scholar]
- 2.Wang J, Wang W, Li R, Li Y, Tian G, Goodman L, Fan W, Zhang J, Guo Y, Feng B, et al. The diploid genome sequence of an Asian individual. Nature. 2008;456:60–65. doi: 10.1038/nature07484. [DOI] [PMC free article] [PubMed] [Google Scholar]
- 3.1000 Genomes Project Consortium. A map of human genome variation from population-scale sequencing. Nature. 2010;467:1061–1073. doi: 10.1038/nature09534. [DOI] [PMC free article] [PubMed] [Google Scholar]
- 4.Wellcome Trust Case Control Consortium. Genome-wide association study of 14,000 cases of seven common diseases and 3,000 shared controls. Nature. 2007;447:661–678. doi: 10.1038/nature05911. [DOI] [PMC free article] [PubMed] [Google Scholar]
- 5.Mccarthy MI, Abecasis G, Cardon LR, Goldstein DB, Little J, Ioannidis J, Hirschhorn JN. Genome-wide association studies for complex traits: consensus, uncertainty and challenges. Nature Rev. Genet. 2008;9:356–369. doi: 10.1038/nrg2344. [DOI] [PubMed] [Google Scholar]
- 6.Jiang R, Yang H, Zhou L, Kuo C, Sun F, Chen T. Sequence-based prioritization of nonsynonymous single-nucleotide polymorphisms for the study of disease mutations. Am. J. Hum. Genet. 2007;81:346–360. doi: 10.1086/519747. [DOI] [PMC free article] [PubMed] [Google Scholar]
- 7.Ng P, Henikoff S. SIFT: predicting amino acid changes that affect protein function. Nucleic Acids Res. 2003;31:3812–3814. doi: 10.1093/nar/gkg509. [DOI] [PMC free article] [PubMed] [Google Scholar]
- 8.Chun S, Fay JC. Identification of deleterious mutations within three human genomes. Genome Res. 2009;19:1553–1561. doi: 10.1101/gr.092619.109. [DOI] [PMC free article] [PubMed] [Google Scholar]
- 9.Ramensky V, Bork P, Sunyaev S. Human non-synonymous SNPs: server and survey. Nucleic Acids Res. 2002;30:3894–3900. doi: 10.1093/nar/gkf493. [DOI] [PMC free article] [PubMed] [Google Scholar]
- 10.Ng P, Henikoff S. Predicting the effects of amino acid substitutions on protein function. Ann. Rev. 2006;7:61–80. doi: 10.1146/annurev.genom.7.080505.115630. [DOI] [PubMed] [Google Scholar]
- 11.Hu J, Yan C. Identification of deleterious non-synonymous single nucleotide polymorphisms using sequence-derived information. BMC Bioinformatics. 2008;9:297. doi: 10.1186/1471-2105-9-297. [DOI] [PMC free article] [PubMed] [Google Scholar]
- 12.Tian J, Wu N, Guo X, Guo J, Zhang J, Fan Y. Predicting the phenotypic effects of non-synonymous single nucleotide polymorphisms. BMC Bioinformatics. 2007;8:450. doi: 10.1186/1471-2105-8-450. [DOI] [PMC free article] [PubMed] [Google Scholar]
- 13.Bromberg Y, Rost B. SNAP: predict effect of non-synonymous polymorphisms on function. Nucleic Acids Res. 2007;35:3823–3835. doi: 10.1093/nar/gkm238. [DOI] [PMC free article] [PubMed] [Google Scholar]
- 14.Bromberg Y, Yachdav G, Rost B. SNAP predicts effect of mutations on protein function. Bioinformatics. 2008;24:2397–2398. doi: 10.1093/bioinformatics/btn435. [DOI] [PMC free article] [PubMed] [Google Scholar]
- 15.Ng P, Henikoff S. Predicting deleterious amino acid substitutions. Genome Res. 2001;11:863–874. doi: 10.1101/gr.176601. [DOI] [PMC free article] [PubMed] [Google Scholar]
- 16.Kimchi-Sarfaty C, Oh J, Kim I, Sauna Z, Calcagno AM, Ambudkar S, Gottesman MM. A silent polymorphism in the MDR1 gene changes substrate specificity. Science. 2007;315:525–528. doi: 10.1126/science.1135308. [DOI] [PubMed] [Google Scholar]
- 17.De Gobbi M, Viprakasit V, Hughes J, Fisher C, Buckle VJ, Ayyub H, Gibbons RJ, Vernimmen D, Yoshinaga Y, de Jong P, et al. A regulatory SNP causes a human genetic disease by creating a new transcriptional promoter. Science. 2006;312:1215–1217. doi: 10.1126/science.1126431. [DOI] [PubMed] [Google Scholar]
- 18.Cartegni L, Chew S, Krainer A. Listening to silence and understanding nonsense: exonic mutations that affect splicing. Nat. Rev. Genet. 2002;3:285–298. doi: 10.1038/nrg775. [DOI] [PubMed] [Google Scholar]
- 19.Cooper G, Goode D, Sarah NG, Sidow A, Bamshad M, Shendure J, Nickerson D. Single-nucleotide evolutionary constraint scores highlight disease-causing mutations. Nat. Methods. 2010;7:250–251. doi: 10.1038/nmeth0410-250. [DOI] [PMC free article] [PubMed] [Google Scholar]
- 20.Schwarz J, Roedelsperger C, Schuelke M, Seelow D. MutationTaster evaluates disease-causing potential of sequence alterations. Nat. Methods. 2010;7:575–576. doi: 10.1038/nmeth0810-575. [DOI] [PubMed] [Google Scholar]
- 21.Yandell M, Huff C, Hu H, Singleton M, Moore B, Xing J, Jorde L, Reese M. A probabilistic disease-gene finder for personal genomes. Genome Res. 2011;21:1529–1542. doi: 10.1101/gr.123158.111. [DOI] [PMC free article] [PubMed] [Google Scholar]
- 22.Cooper DN, Ball EV, Krawczak M. The human gene mutation database. Nucleic Acids Res. 1998;26:285–287. doi: 10.1093/nar/26.1.285. [DOI] [PMC free article] [PubMed] [Google Scholar]
- 23.Karolchik D, Kuhn RM, Baertsch R, Barber GP, Clawson H, Diekhans M, Giardine B, Harte RA, Hinrichs AS, Hsu F, et al. The UCSC Genome Browser Database: 2008 update. Nucleic Acids Res. 2008;36:D773–D779. doi: 10.1093/nar/gkm966. [DOI] [PMC free article] [PubMed] [Google Scholar]
- 24.Cooper GN, Goode DL, Ng SB, Sidow A, Bamshad MJ, Shendure J, Nickerson DA. Single-nucleotide evolutionary constraint scores highlight disease-causing mutations. Nat. Methods. 2010;7:250–251. doi: 10.1038/nmeth0410-250. [DOI] [PMC free article] [PubMed] [Google Scholar]
- 25.Montgomery S, Griffith OL, Schuetz JM, Brooks-Wilson A, Jones SJM. A survey of genomic properties for the detection of regulatory polymorphisms. PLoS Comput. Biol. 2007;3:e106. doi: 10.1371/journal.pcbi.0030106. [DOI] [PMC free article] [PubMed] [Google Scholar]
- 26.Zhao Y, Clark WT, Mort M, Cooper DN, Radivojac P, Mooney SD. Prediction of functional regulatory SNPs in Monogenic and Complex Disease. Hum. Mutat. 2011;32:1183–1190. doi: 10.1002/humu.21559. [DOI] [PMC free article] [PubMed] [Google Scholar]
- 27.Wood L, Parsons D, Jones S, Lin J, Sjoblom T, Leary T, Shen D, Boca S, Barber T, Ptak J. The genomic landscapes of human breast and colorectal cancers. Science. 2007;318:1108–1113. doi: 10.1126/science.1145720. [DOI] [PubMed] [Google Scholar]
- 28.Bamford S, Dawson E, Forbes D, Clements J, Pettett R, Dogan A, Flanagan A, Teague J, Futreal PA, Tratton MR, et al. The COSMIC (Catalogue of Somatic Mutations in Cancer) database and website. Brit. J. Cancer. 2004;91:355–358. doi: 10.1038/sj.bjc.6601894. [DOI] [PMC free article] [PubMed] [Google Scholar]
- 29.Olivier M, Eeles R, Hollstein M, Khan M, Harris C, Hainaut P. The IARC TP53 database: new online mutation analysis and recommendations to users. Hum. Mutat. 2002;19:607–614. doi: 10.1002/humu.10081. [DOI] [PubMed] [Google Scholar]
- 30.Levy S, Sutton G, Ng P, Feuk L, Halpern A, Walenz B, Axelrod N, Huang J, Kirkness E, Denisov G, et al. The diploid genome sequence of an individual human. PLoS Biol. 2007;5:e254. doi: 10.1371/journal.pbio.0050254. [DOI] [PMC free article] [PubMed] [Google Scholar]
- 31.Wheeler D, Srinivasan M, Egholm M, Shen Y, Chen L, McGuire A, He W, Chen Y, Makhijani V, Roth GT, et al. The complete genome of an individual by massively parallel DNA sequencing. Nature. 2008;452:872–876. doi: 10.1038/nature06884. [DOI] [PubMed] [Google Scholar]
- 32.Genome 10K Community of Scientists. Genome 10K: a proposal to obtain whole-genome sequence for 10,000 vertebrate species. J. Hered. 2009;100:659–674. doi: 10.1093/jhered/esp086. [DOI] [PMC free article] [PubMed] [Google Scholar]
- 33.Kimura M, Ohta T. Protein polymorphism as a phase of molecular evolution. Nature. 1971;229:467–469. doi: 10.1038/229467a0. [DOI] [PubMed] [Google Scholar]
- 34.Rudd M, Williams R, Webb E, Schmidt S, Sellick GS, Houlston RS. The predicted impact of coding single nucleotide polymorphisms database. Cancer Epidem. Biomar. Prev. 2005;14:2598–2604. doi: 10.1158/1055-9965.EPI-05-0469. [DOI] [PubMed] [Google Scholar]
- 35.Bhatti P, Church D, Rutter J, Struewing J, Sigurdson A. Candidate single nucleotide polymorphism selection using publicly available tools: a guide for epidemiologists. Am. J. Epidemiol. 2006;164:794–804. doi: 10.1093/aje/kwj269. [DOI] [PubMed] [Google Scholar]
- 36.Kryukov G, Pennacchio L, Sunyaev S. Most rare missense alleles are deleterious in humans: implications for complex disease and association studies. Am. J. Hum. Genet. 2007;80:727–739. doi: 10.1086/513473. [DOI] [PMC free article] [PubMed] [Google Scholar]
Associated Data
This section collects any data citations, data availability statements, or supplementary materials included in this article.