


Abstract
Long INterspersed Element one (LINE-1, or L1), is a widely distributed, autonomous retrotransposon in mammalian genomes. During retrotransposition, L1 RNA functions first as a dicistronic mRNA and then as a template for cDNA synthesis. Previously, we defined internal ribosome entry sequences (IRESs) upstream of both ORFs (ORF1 and ORF2) in the dicistronic mRNA encoded by mouse L1. Here, RNA affinity chromatography was used to isolate cellular proteins that bind these regions of L1 RNA. Four proteins, the heterogeneous nuclear ribonucleoproteins (hnRNPs) R, Q and L, and nucleolin (NCL), appeared to interact specifically with the ORF2 IRES. These were depleted from HeLa cells to examine their effects on L1 IRES-mediated translation and L1 retrotransposition. NCL knockdown specifically reduced the ORF2 IRES activity, L1 and L1-assisted Alu retrotransposition without altering L1 RNA or protein abundance. These findings are consistent with NCL acting as an IRES trans-acting factor (ITAF) for ORF2 translation and hence a positive host factor for L1 retrotransposition. In contrast, hnRNPL knockdown dramatically increased L1 retrotransposition as well as L1 RNA and ORF1 protein, indicating that this cellular protein normally interferes with retrotransposition. Thus, hnRNPL joins a small, but growing list of cellular proteins that are potent negative regulators of L1 retrotransposition.
INTRODUCTION
The mouse genome contains ∼600 000 copies of Long INterspersed Element one (LINE-1, or L1), scattered throughout all chromosomes (1). L1 achieved this high-copy number because it is an autonomous retrotransposon, however, most copies of L1 are the truncated pseudogene progeny of the ∼3000 full length, active elements (2). Each active L1 is about 6.5 kb in length and contains a 5′-untranslated region (UTR) with an internally repeated promoter, two open reading frames (ORFs) separated by 40 nt, a 3′-UTR and a polyA tail. The proteins encoded by both ORFs are required in cis for L1 retrotransposition (3), therefore L1 necessarily functions as a dicistronic mRNA. ORF1 encodes a high affinity, sequence non-specific RNA-binding protein (ORF1p, 4) with nucleic acid chaperone activity that is required for retrotransposition (4–7). ORF2 encodes a protein that provides the essential endonuclease (8) and reverse transcriptase (9) activities for insertion by target site primed reverse transcription, or TPRT (10).
Translation of the L1 dicistronic mRNA has been investigated in mouse, rat and human L1 (11–15). In the case of mouse L1 RNA, there appears to be an internal ribosome entry site (IRES) upstream of both ORF1 and ORF2. Specifically, L1 RNA sequences from both the 5′-UTR (ORF1 IRES) and the intergenic region (ORF2 IRES) stimulated translation of the second cistron in a dual luciferase assay, and did so at least as well as a known IRES from Cricket Paralysis Virus (14,16). A series of control segments taken from the 3′-end of L1 but with similar length and nucleotide composition exhibited no IRES activity by this assay. The apparent IRES activities could not be attributed to cryptic promoter or splice sites. Significantly, the ORF2 IRES was most effective if cells were transfected with DNA compared to RNA, suggesting that it may benefit from a ‘nuclear experience’, as described for the c-myc IRES (17). This finding likely reflects the need to acquire a cellular protein(s) during transcription or post-transcriptional processing for full IRES function (14). Cellular proteins that promote IRES function are known as IRES trans-acting factors, or ITAFs (18).
A number of ITAFs have been identified for both cellular and viral IRESes (19). Many of these are heterogeneous nuclear ribonucleoproteins (hnRNPs) that are involved in various aspects of RNA metabolism, including RNA processing, translational control and regulation of alternative splicing. Although the connection between their normal biochemical function and their role in IRES function is not obvious, it has been proposed that these hnRNPs function as RNA chaperones, causing IRESes to fold into conformations that promote recruitment of the ribosome (18–21). hnRNP proteins are primarily nuclear, although some shuttle between the nucleus and cytoplasm (22).
Here, we used an affinity capture method to screen for cellular proteins that specifically interact with the ORF1 or ORF2 IRES sequences. We then examined the importance of these host cell proteins for L1-mediated IRES function and L1 retrotransposition by depleting them from cells using siRNA. This approach identified for the first time two cellular RNA-binding proteins that interact with L1 RNA and modulate L1 retrotransposition.
MATERIALS AND METHODS
Plasmid constructs
For affinity capture of IRES interacting proteins, a pUC19-based vector with a T7 promoter, three MS2 hairpins and the HCV IRES (23) was generously provided by Dr Jeffrey Kieft (University of Colorado Anschutz Medical Campus). L1 IRES sequences were amplified by PCR using the following primer pairs: ORF1 IRES, 5′-GGCCGGTACCAGCCAGCCACCTTC (forward) and 5′-CTTTCGGATCCTGGTAATCTCTGGAGTTAGTAG (reverse); ORF2 IRES, 5′-CTAGAGGTACCAGCCAAACTCTCAATTATC (forward) and 5′-GTTAAAGGGGATCCTCTGTTCTTGTGGCTGTC (reverse); the 312 nt negative control region of L1, 5′-CCCAGGTACCGCATCCAAACGCTGACAC (forward) and 5′-CAAAGTGGATCCGTCCAATGGGCCTCTCTTTC (reverse). These regions were moved into the MS2 hairpin vector as KpnI/BamHI fragments, replacing the HCV IRES sequence. Constructs in pRF used for the dicistronic reporter assays were described previously (14); for simplicity here 400-1UTR is renamed ORF1 IRES, and 201-1IGR is renamed ORF2 IRES. For retrotransposition assays, the mouse L1 TFC element in pCEP puro was marked with either an antisense intron (AI) containing eGFP or neomycin phosphotransferase reporter cassette to make pDB121 or pDB122, respectively (6). pSP1 is identical to pDB121 except that it lacks the AI reporter gene. The construct pBS Ya5 neotet (24), a generous gift from Astrid Engel (Tulane University, New Orleans, LA, USA) was used to monitor L1-assisted Alu retrotransposition. Colony formation in the presence of G418 was also assessed using pcDNA3 (Invitrogen).
In vitro transcription of RNA for affinity capture of IRES interacting proteins
Plasmids containing the MS2 hairpin described above were linearized with BamHI, phenol/chloroform extracted, ethanol precipitated, and then transcribed in vitro using T7 polymerase. After RNase-free DNase treatment, the MS2-RNA was phenol/chloroform extracted, ethanol precipitated, and then purified on a 7 M urea, 1× TBE, 6% (19:1) polyacrylamide gel.
Preparation of S10 and nuclear extracts
Mouse LTK- or human HeLa cells were grown to confluency on a 150 mm dish, detached with trypsin/EDTA, and recovered by centrifugation at 300g for 5 min at 4oC. The cell pellet was resuspended and washed with cold PBS. Each 150 mm dish yielded about 100 µl of packed cell volume (PCV). All subsequent steps were performed at 4oC unless noted otherwise. The cell pellet was washed with two PCV of 35 mM Hepes, pH 7.4, 146 mM NaCl, 50 mM dextrose. The cells were then resuspended in 1.5 PCV of 20 mM Hepes-KOH, pH 7.4, 10 mM KCl, 1.5 mM Mg(OAc)2, 1.0 mM DTT and incubated for 10 min. Cells were then homogenized using a Dounce (25 strokes with pestle B) homogenizer. One-fifth volume of 5 x S10 buffer [200 mM Hepes-KOH, pH 7.4, 1.2 M K(OAc)2, 40 mM Mg(OAc)2, 52 mM DTT] was added to the homogenate and mixture was centrifuged at 3300g for 10 min to pellet the nuclei. The nuclear pellet was saved to make nuclear extract (see below). The supernatant was centrifuged at 8100g for 15 min, and the resulting supernatant was transferred to a new tube, adjusted to 1 mM CaCl2, and then treated with 1U/ml micrococcal nuclease at 22oC for 15 min. EGTA (2 mM) was added to stop the nuclease digestion, and the extract was centrifuged at 8100g for 15 min. The supernatant, (S10 extract, 25) was aliquoted, snap frozen in N2(l), and stored at −80oC.
For the nuclear extract, 0.5 nuclear volume of 20 mM Hepes, pH 7.9, 25% glycerol, 20 mM KCl, 1.5 mM MgCl2, 0.2 mM EDTA, 0.5 mM DTT, 0.2 mM PMSF was added to the nuclear pellet while stirring. Once the nuclei were resuspended, 0.5 nuclear volume of 20 mM Hepes, pH 7.9, 25% glycerol, 1.2 M KCl, 1.5 mM MgCl2, 0.2 mM EDTA, 0.5 mM DTT, 0.2 mM PMSF was added. The mixture was left stirring for 30 min, and then centrifuged at 25 000g for 30 min. The supernatant was dialyzed twice against 50 volumes of 20 mM Hepes, pH 7.9, 20% glycerol, 100 mM KCl, 0.2 mM EDTA, 0.5 mM DTT, 0.2 mM PMS and centrifuged as before. The supernatant, or nuclear extract, was aliquoted, snap frozen in N2(l), and stored at −80oC.
RNA affinity chromatography
In a total volume of 500 μl, 500 pmole of the MS2 hairpin-tagged RNA were incubated with 150 μg (protein) of S10 or nuclear extract in binding buffer (20 mM Tris-Cl, pH 7.6, 100 mM KCl, 5 mM MgCl2, 2 mM DTT, 0.25 mg/ml heparin, 0.5 U/μl SUPERase.IN, Ambion) at 37°C for 30 min. 90 μg of MS2-MBP (MS2 coat protein—maltose-binding protein fusion protein, generously provided by Dr Jeffrey Kieft) were then added to the mixture and incubation was continued at 37°C for another 30 min. At room temperature, the mixture was loaded onto a column (Fisher Scientific) packed with 150 μl bed volume of amylose resin (New England Biolabs) that had been equilibrated four times with 0.75 ml washing buffer (20 mM Tris-Cl, pH 7.6, 100 mM KCl, 5 mM MgCl2, 2 mM DTT) each. The column was washed twice with 1.5 ml washing buffer, and the RNA–protein complex was eluted from the column with 0.5 ml elution buffer (20 mM Tris-Cl, pH 7.6, 100 mM KCl, 5 mM MgCl2, 2 mM DTT, 12 mM maltose). The eluent was concentrated to 20 μl using a Microcon YM10 (Millipore). This experiment was done initially with extracts from LTK- cells and proteins identified, but subsequently repeated in HeLa cells because downstream in vivo assays, especially for studies of L1 retrotransposition, were too inefficient to study effects of cellular protein knockdown in LTK- cells. The identical four cellular proteins were isolated using this experimental protocol from both LTK- and HeLa cells.
Protein identification using LC-MS/MS
The concentrated eluant from RNA affinity isolation was fractionated by electrophoresis through a 1.5 mm thick 10% (39:1) SDS-polyacrylamide gel at 150 V for 7 h and proteins stained with Sypro Ruby (Invitrogen). The Typhoon imaging system was used to scan the gel, and the resulting image was analysed using DeCyder (GE Healthcare). Protein bands that interacted with the ORF2 IRES transcript were robotically excised, digested to peptides with trypsin, and the resulting peptides were analysed by LC/MS-MS as described (26). Mass spectrometry data were searched against the NCBI dataset for mouse proteins with Spectrum Mill MS Proteomics Workbench software (Agilent) to identify the proteins in each band.
siRNA-mediated knockdown of cellular proteins
Gene-specific pooled siRNA duplexes used were hnRNPL (L-011293-01), NCL (L-003854-00), hnRNP-Q (SYNCRIP, L-016218-00) and hnRNPR (L-010905-01) and a non-targeting siRNA control (D-001810-10), all purchased from Dharmacon (ThermoFisher Scientific). HeLa cells in 12-well plates were transfected with 5 nM each siRNA using INTERFERin (Polyplus-transfection, France) following the manufacturer’s recommendations. pRF-based luciferase plasmid constructs were transfected into the same cells 24 h later using Lipofectamine 2000 (Invitrogen), for assessment of IRES activity. Doubly transfected cells were harvested 48 h later, lysed and analysed for luciferase expression using the dual luciferase reporter assay (Promega) as described previously (14). Each assay was run in triplicate; each set of experiments was repeated at least three times. For assay of L1 retrotransposition activity, HeLa cells in 6-well dishes were transfected first with 5 nM siRNA as above. 24 h later, 2 µg pDB121 or pDB122 (L1 marked with the AI eGFP or neo reporter genes, respectively), were transfected using Lipofectamine 2000 and the doubly transfected cells were selected with 10 µg/ml puromycin beginning 24 h later. For eGFP analysis, puromycin selection was maintained until flow cytometry on d6 (7) as described. For the neo assay, transfected cells were selected in 10 µg/ml puromycin for 24 h as above; two of the three wells were fed with DMEM complete and the third was split 1:3.3, 1:10, 1:30 and 1:90 and grown 24 h in DMEM complete. The doubly transfected cells were then shifted to 400 µg/ml G418 and grown for an additional 10 d before fixation and staining with crystal violet to visualize and count colonies formed from individual retrotransposition events (6). Alu retrotransposition was likewise measured in 6-well plates following knockdown with siRNA as described for L1, however 24 h post-transfection of the siRNA cells were re-fed in 1 ml serum-free medium and transfected with 400 ng pBS Ya5 neotet mixed with 200 ng pSP1 in LipofectaminePlus (Invitrogen). After 3 h incubation, 1 ml of DMEM containing 20% (2 x) fetal bovine serum was added and the incubation continued overnight. Selection in 400 µg/ml G418 was applied after 48 h and continued for 14 days before fixation and staining.
Western blot analysis of protein abundance
Lysates (lys) were prepared from transfected cells as described (6), and protein quantified by Bradford assay (Bio-Rad). Western blots for ORF1p (27) used 20 µg of lys and hnRNPQ (Abcam, ab10687) as a loading control, whereas western blots for hnRNPL (Abcam, ab6106) and NCL (Abcam, ab50279) used 10 µg of lys and actin (Santa Cruz, sc8432) to confirm equal loading. Blot images were developed with ECL Plus (GE Healthcare) and images captured on the Typhoon 9400.
L1 RNA analysis
Total RNA was isolated from transfected cell lys using TRIzol-LS (Invitrogen) and quantified (Nanodrop, Thermo Scientific). For qRTPCR analysis of transcript abundance, RNA (2 μg) was treated with RQ1 DNase (Promega) and cDNA synthesized from 1 µg using a High-Capacity cDNA Reverse Transcription kit (Applied Biosystems). 2 µl cDNA were used for quantitative PCR using a TaqMan probe assay as described (5). For northern blots, total RNA and oligo dT-selected (poly A+, PureBiotech, MPG mRNA purification kit) RNA was fractionated through agarose formaldehyde gels, transferred to membrane and hybridized to 32P-labeled in vitro transcribed antisense L1 RNA (NorthernMax Kit, Ambion). Phosphorimages were captured on a Typhoon 9400 and analysed with ImageQuant 5.2 (GE Healthcare). For RT-PCR to detect the AI, cDNA was synthesized using random hexamer from either 500 ng polyA+ or 2µg total RNA template in a 20 µl reaction, then 1 µl of that was amplified in a 25 µl PCR reaction using GFPint1F, 5′-GACTGGGTGCTCAGGTAGTGG and GFPint1R 5′-AAGATCCGCCACAACATCGA for 40 cycles. Products were separated on 2% agarose, stained with SYBRSafe (Invitrogen), and imaged on the Typhoon9400.
RIP assay
The interaction between hnRNPL and L1 RNA in cells was evaluated using a ribonucleoprotein immunoprecipitation assay (28). Briefly, 6 × 10⁶ HeLa cells were seeded onto 150 mm dishes (BD Biosciences) and transfected with a wild-type mouse L1 plasmid, pSP1, using Lipofectamine 2000 (Invitrogen). After 24 h, transfected cells were selected with 10 µg/ml puromycin. On day 2 post-transfection, the cells were washed with PBS and incubated at room temperature with 1% formaldehyde (in PBS) for 5 min to crosslink closely juxtaposed constituents. The reaction was quenched by the addition of glycine to 0.125 M for an additional 5 min. The cells were then washed twice with cold PBS, recovered from the dishes, pelleted by centrifugation, and stored as pellets at −80°C until use. For RIP, cells were resuspended in 1 ml RIPA buffer (50 mM Tris-Cl, pH 7.5, 1% Nonidet P-40, 0.5% sodium deoxycholate, 0.05% SDS, 1 mM EDTA, 150 mM NaCl) supplemented with complete protease inhibitor (Roche) and sonicated 3 × 5 s at 25% amplitude using a microtip (Ultrasonic Processor GEX130, Cole-Parmer Instruments, Vernon Hills, IL). The lys was cleared by centrifugation at 14 000g for 15 min at 4°C and applied to either uncoated, or hnRNPL coated, magnetic beads (Dynabeads Protein-G Immunoprecipitation Kit, Invitrogen, following the manufacturer’s recommendations). Briefly, 50 µl (1.5 mg) of protein-G Dynabeads were incubated with either 5 µg of mouse monoclonal hnRNPL antibody for 10 min or rabbit polyclonal NCL antibody for 1 h at room temperature, and then washed with antibody binding and wash buffer from kit. Equal volumes of lys (∼500 µl) were added to each hnRNPL-coated protein G beads and beads lacking antibody to control for specificity. Beads and lys were incubated overnight at 4°C, and then washed twice before elution into 80 µl of 50 mM glycine, pH 2.8 by heating at 70°C for 45 min to reverse crosslinks. RNA was then extracted from 50 µl of eluate using Trizol-LS reagent (Invitrogen). RNA grade glycogen (Roche Diagnostics, USA) was added to 20 µg per sample and the RNA was DNase treated using RNase-free DNase (Promega). First strand cDNA was synthesized from 500 ng of the recovered RNA using the High-Capacity cDNA RT Kit (Invitrogen, USA). L1 RNA was detected in the starting and unbound lys and eluates by PCR using 5′-CTCAGAATGAAAGGCTGGAAAAC as the forward primer, and 5′-AGGATGGCTACTCCTGCTTGTT as the reverse primer.
RESULTS
Previous work delineated cis-acting sequences with IRES function in L1 RNA upstream of both ORF1 and ORF2 (14). These sequences, along with negative controls, were cloned into a vector for in vitro transcription downstream of MS2 hairpins. The resulting RNAs were used to affinity capture RNA-binding proteins from HeLa cells using the MS2-MBP system. This system exploits the high affinity of MS2 coat protein for the MS2 RNA hairpin and allows recovery of the RNA–protein complexes on an amylose column via the maltose-binding domain (29).
Cytoplasmic S10 extract and nuclear extracts from HeLa cells (see Materials and Methods section) were incubated with RNA transcripts containing the ORF1 and ORF2 IRESes. The HCV IRES was included as a positive control and the 312 nt region from the 3′-UTR of mouse L1 RNA that has no IRES activity was used as a negative control. No proteins were observed that interacted specifically with the ORF1 IRES-containing RNA (data not shown). However, three proteins from the nuclear extract appeared to interact specifically with the RNA containing the ORF2 IRES. A fourth protein interacted more strongly with this RNA than with either the HCV IRES or the L1 312-containing RNAs and was found in both the nuclear and cytoplasmic extracts (the second largest protein in Figure 1). These proteins were identified as heterogeneous nuclear ribonucleoprotein R (hnRNPR), NCL, synaptotagmin-binding cytoplasmic RNA-interacting protein (SYNCRIP or hnRNP-Q) and heterogeneous nuclear ribonucleoprotein L (hnRNPL) using tandem mass spectrometry (Table 1).
Figure 1.
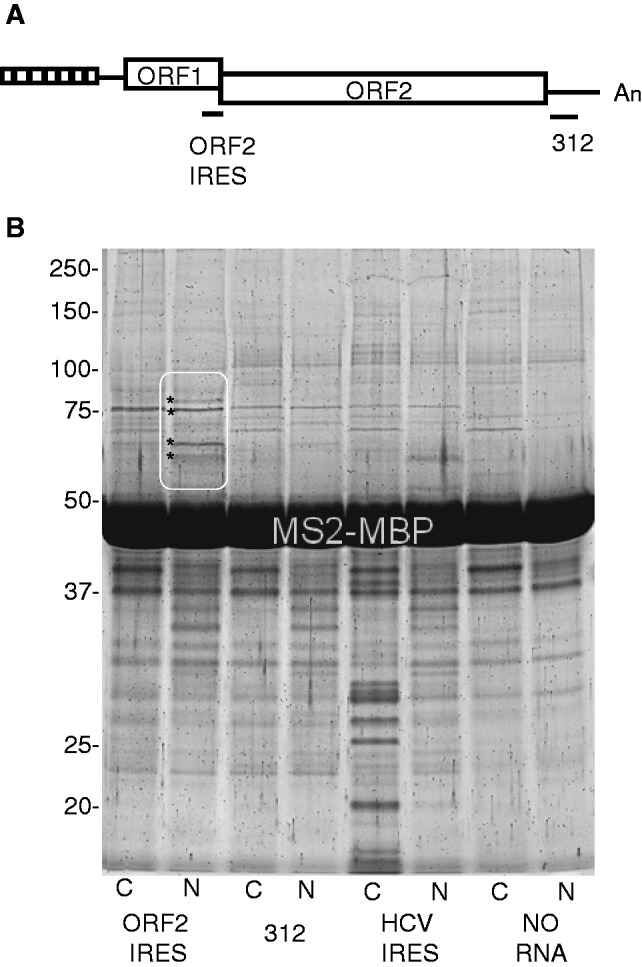
Cellular proteins that bind the L1 ORF2 IRES. (A) Schematic of L1 indicating location of the ORF2 IRES and the 312 nt region that lacks IRES activity (14). Small boxes at the 5′-end indicate a repeating motif with promoter activity which is followed by a 5′-UTR (line), ORF1, a 40 nt intergenic region (not visible), ORF2, a 3′-UTR (line) and an A-rich region (An). (B) SDS-PAGE of proteins bound to the indicated in vitro RNAs after affinity capture using the MS2-MBP fusion protein. Paired lanes resolve S10 cytoplasmic (C) or nuclear (N) proteins that were captured using the ORF2 IRES or 312 nt regions of L1 RNA, the HCV IRES, or no RNA. The region containing four proteins with enhanced or unique interaction with the ORF2 IRES are encircled in white; each of these protein bands of interest is marked by asterisks on the left. From top to bottom, these proteins were identified as hnRNPR, NCL, SYNCRIP (also known as hnRNP-Q) and hnRNPL (Table 1). Several unique protein bands are apparent in the lane containing cytoplasmic proteins that bound to the HCV IRES. These contained 22 small ribosomal proteins and 7 large ribosomal proteins, as well as RACK1 and NCL (data not shown). All are known to interact with the HCV IRES (23,29), confirming that our binding conditions, affinity purification protocol and protein identification by mass spectrometry were reliable. Numbers on the left of the gel indicate the position of molecular size markers in KDa.
Table 1.
Identification of proteins isolated by MS2-MBP pulldown with the ORF2 IRES of mouse L1
| Full protein name | GI | MW | No. of peptides | Percent coverage | Human homolog | Human gene |
|---|---|---|---|---|---|---|
| Heterogeneous nuclear ribonucleoprotein R | 33 859 724 | 70.9 | 10 | 17 | 5 031 755 | HNRNPR |
| Nucleolin | 13 529 464 | 76.8 | 16 | 23 | 55 956 788 | NCL |
| Synaptotagmin binding, cytoplasmic RNA interacting protein | 33 416 526 | 74.7 | 11 | 14 | 228 008 291 | SYNCRIP |
| Heterogeneous nuclear ribonucleoprotein L | 33 667 042 | 60.1 | 5 | 13 | 52 632 383 | HNRNPL |
Full protein name, GenBank protein sequence identifier (GI), molecular weight (MW), number (#) of peptides and percent coverage refer to the database entry identified by SpectrumMill, human homolog gives the GI number for the human homolog (NP) of the identified mouse protein, and human gene is the corresponding official gene symbol.
We first tested these L1 RNA-binding proteins for an effect on ORF2-IRES-mediated translation using the dicistronic reporter assay in cells treated with siRNA to reduce their abundance. In NCL knockdown cells, the ORF2 IRES activity was modestly but significantly reduced (Figure 2), whereas there was no effect on translation mediated by either the L1 ORF1 or the CrPV IRES sequences. Depletion of NCL reduced ORF2 IRES activity in this assay an average of 33% compared to the scrambled (scr) siRNA control, with a range of 25–47% in three independent experiments (Supplementary Figure S1); in all cases only the construct with the ORF2 IRES was significantly and reproducibly affected. These results are consistent with a role for NCL in enhancing the function of the ORF2 IRES as expected for an ITAF and suggested that further studies to examine the role of NCL in L1 retrotransposition were warranted.
Figure 2.
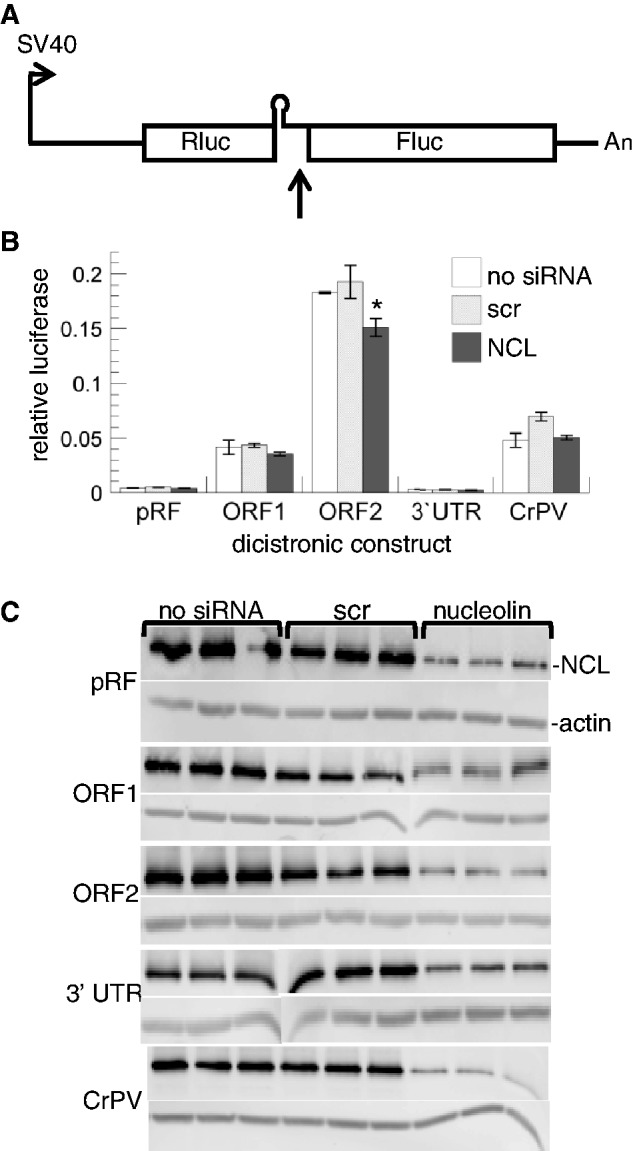
IRES functional assay with NCL knockdown. (A) Schematic of the dual luciferase construct in pRF (14), right arrow marks the transcriptional start site, up arrow denotes the cloning site for IRES test sequences, the hairpin loop represents ΔEMCV, a highly structured, defective, IRES-derived RNA element used to block read-through translation, Rluc is the Renilla luciferase (first cistron), Fluc is the firefly luciferase (second cistron) and An denotes the polyA signal. Constructs tested were pRF (empty vector), and vector with inserts of various regions of L1 as indicated: ORF1, the L1 ORF IRES; ORF2, the L1 ORF2 IRES; and 3′-UTR, the 312 nt negative control region (14). CrPV, the Cricket Paralysis Virus intergenic IRES, was used as a positive control for IRES activity (30). (B) Relative luciferase values obtained in the absence (no siRNA) or presence of siRNA, either scr or NCL, as indicated. Error bars plot SD, n = 3 separate transfections. Only the ORF2 IRES activity was significantly reduced (*) by NCL siRNA compared to untreated cells (P = 0.02) and scr siRNA (P = 0.01). (C) Western blot confirms NCL knockdown in cells treated with NCL siRNA. Gel lanes contain lys used for luciferase assays as noted on the top (triplicate lanes). The transfected dual luciferase construct is indicated on the left for each pair of blots where the top is NCL and the bottom is actin from the same gel as a loading control (indicated on the first pair only).
Reduced levels of hnRNPL also significantly decreased the relative luciferase expression from the ORF2 IRES construct compared to both scr siRNA and no siRNA controls. The apparent ORF2 IRES activity was decreased an average of 67%, with a range of 61–71% in four independent experiments when hnRNPL was depleted. However, significant reductions of activity from ORF1 and CrPV IRESes were also observed, demonstrating a lack of specificity of hnRNPL for the ORF2 IRES (Figure 3A). Because the CrPV IRES is known to recruit ribosomes directly (16), depletion of hnRNPL was not expected to affect its ability to initiate translation. Examination of the separate Rluc (Renilla luciferase, first cistron) and Fluc (Firefly luciferase, second cistron) data revealed little change in Fluc (Figure 3C) in the presence of the hnRNPL siRNA compared to scr. Instead, the decreased relative luciferase ratio was due to a large increase in the translation of the first cistron (Rluc, Figure 3D) when hnRNPL was depleted. Although this effect was unexpected and not consistent with a role for hnRNPL as an ORF2-specific ITAF, it does indicate a role for hnRNPL in RNA metabolism, which might be important for L1 retrotransposition.
Figure 3.

IRES functional assay with hnRNPL knockdown. Constructs were identical to those used in Figure 2. (A) Relative luciferase values obtained in the absence (no siRNA) or presence of siRNA, either scr or hnRNPL, as indicated. Error bars plot SD, n = 3 separate transfections. The IRES activity was significantly reduced (*) by hnRNPL siRNA for all three IRES-containing constructs compared to both untreated cells (P = 0.001, 0.004 and 0.0002 for the ORF1, ORF2 and CrPV IRESes, respectively) and scr siRNA (P = 0.0006, 0.001 and <0.0001, for ORF1, ORF2 and CrPV IRESes, respectively). (B) Western blot confirms hnRNPL knockdown in cells treated with hnRNPL siRNA. Gel lanes contain the same lys as used for luciferase assays as indicated (see Figure 2 legend for details). Plots showing separated (C) Fluc (±SD) and (D) Rluc (±SD) values from panel (A); * indicates a significant (P < 0.05, Student’s t-test) difference between scr and hnRNPL siRNA treatment.
Knockdown (by at least 75%) of the remaining two proteins isolated by RNA affinity chromatography, SYNCRIP and hnRNPR, had no measureable effect on the luciferase ratios obtained from the dicistronic constructs (data not shown). Therefore, these two proteins were not investigated further.
If either hnRNPL or NCL is involved in L1 retrotransposition, altering their levels in the cell should alter retrotransposition efficiency. Retrotransposition was measured using an autonomous retrotransposition assay where new insertions are detected by either quantification of eGFP expression using flow cytometry (31), or visualization of G418-resistant cells after fixation (9). Interestingly, L1 retrotransposition increased when cells were depleted of hnRNPL using both assay methods (Figure 4). In contrast, NCL knockdown-reduced L1 retrotransposition, also in both assays. G418-resistant cell colonies measure individual retrotransposition (insertion) events whereas the flow cytometry data do not distinguish between green cells that arise from unique insertions or after mitosis of a cell with a pre-existing insertion, therefore, quantification by the neo assay more directly reports the magnitude of the effect of the loss of these cellular proteins on L1 retrotransposition events. Depletion of hnRNPL increased transposition by at least 10-fold, indicating that hnRNPL is an important negative regulator of L1 retrotransposition. In contrast, depletion of NCL decreased retrotransposition, also by about 10-fold, consistent with NCL playing a positive role during L1 retrotransposition [Figure 4, panels (B) and (C)].
Figure 4.
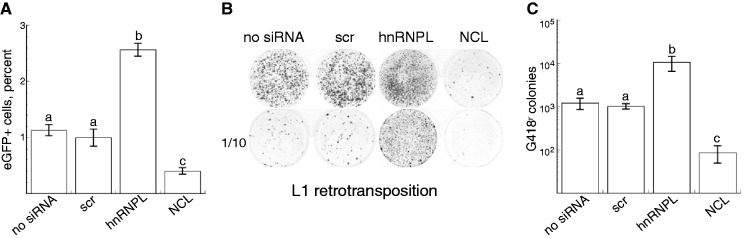
Effect of hnRNPL and NCL on L1 retrotransposition. Mouse L1 marked with an antisense reporter gene was introduced into untreated cells (no siRNA), scr, hnRNPL or NCL siRNA. (A) Retrotransposition events detected by eGFP expression: plot of the percent of eGFP-expressing cells as determined by flow cytometry (n = 3 transfections, ±SD; data are representative of three experiments). (B) Retrotransposition events detected by cell survival in G418. Wells contain transfected cells (top row) or a 1:10 dilution (bottom row) of the transfected cells surviving after 10 d on G418, fixed and stained with crystal violet. (C) Plot of the number of G418-resistant colonies/well in each transfection for n = 3 wells ±SD; data are representative of four experiments. Note the log scale. Small letters above error bars indicate significantly different groups (P < 0.05).
Because hnRNPL and NCL were originally isolated as proteins that bind specifically to a segment of L1 RNA in vitro, it was important to demonstrate that these cellular proteins also interact closely with L1 RNA in vivo, during retrotransposition. Transfected cells were crosslinked in situ and complexes isolated by RNP immunoprecipitation (RIP) using hnRNPL- or NCL-specific antibodies. L1 RNA was detected in both immunoprecipitates by RT-PCR (Figure 5), confirming that both of these cellular RNP proteins bind to L1 RNA in vivo as well as in vitro.
Figure 5.
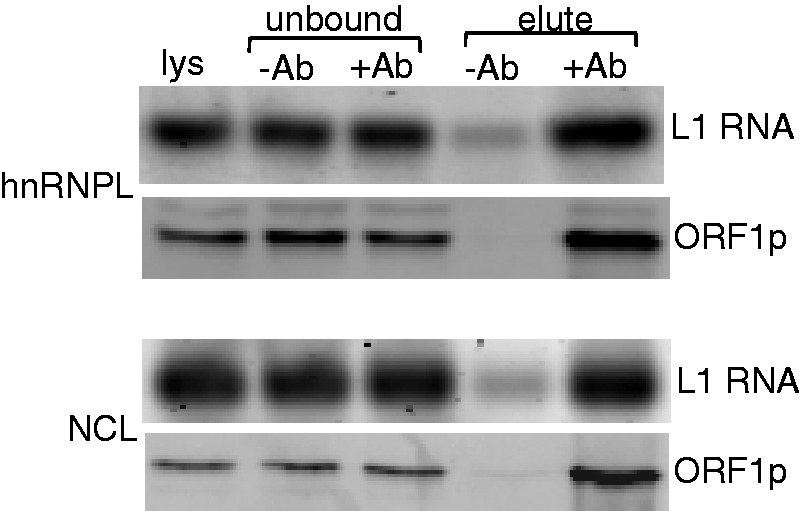
RIP of L1 RNA with hnRNPL and NCL. Each pair of panels (top, hnRNPL; bottom, NCL) shows L1 RT-PCR products amplified from 100 ng of RNA (labeled L1 RNA) and the western blot obtained using 2 µg of protein (labeled ORF1p) from the same fractions. Lanes contain the initial cell lys, proteins remaining unbound in the absence (unbound, −ab) and presence (unbound, +ab) of antibody, and proteins captured by the antibody (elute, +ab), controlled for non-specific interactions using beads lacking antibody (elute, −ab).
Both L1 RNA and ORF1 protein are essential intermediates in L1 retrotransposition. Thus, the steady-state levels of these intermediates were quantified in the presence or absence of knockdown of NCL and hnRNPL over the time course of the retrotransposition assay using eGFP. The qRTPCR revealed significantly increased levels of L1 RNA in hnRNPL knockdown cells compared to cells that were not treated with siRNA (Figure 6A). ORF1p is below the limit of detection (1 ng in 40 µg total cellular protein) by western blot in cells containing just the transfected L1 (Figure 6B), even though retrotransposition events are detected at low frequency (Figure 4A). In contrast, ORF1p is readily detected by western blot in the hnRNPL knockdown cells (Figure 6B and C) which also exhibit enhanced retrotransposition (Figure 4A). These data imply that depletion of hnRNPL elevates retrotransposition by increasing the steady-state levels of the L1 RNA and ORF1p retrotransposition intermediates. In contrast, L1 RNA either remains the same (days 1–3, or is decreased by no more than 2-fold (day 4) when NCL is depleted by siRNA (Figure 6A and C), and L1 ORF1p remains undetectable (data not shown) as with scr siRNA and no treatment.
Figure 6.
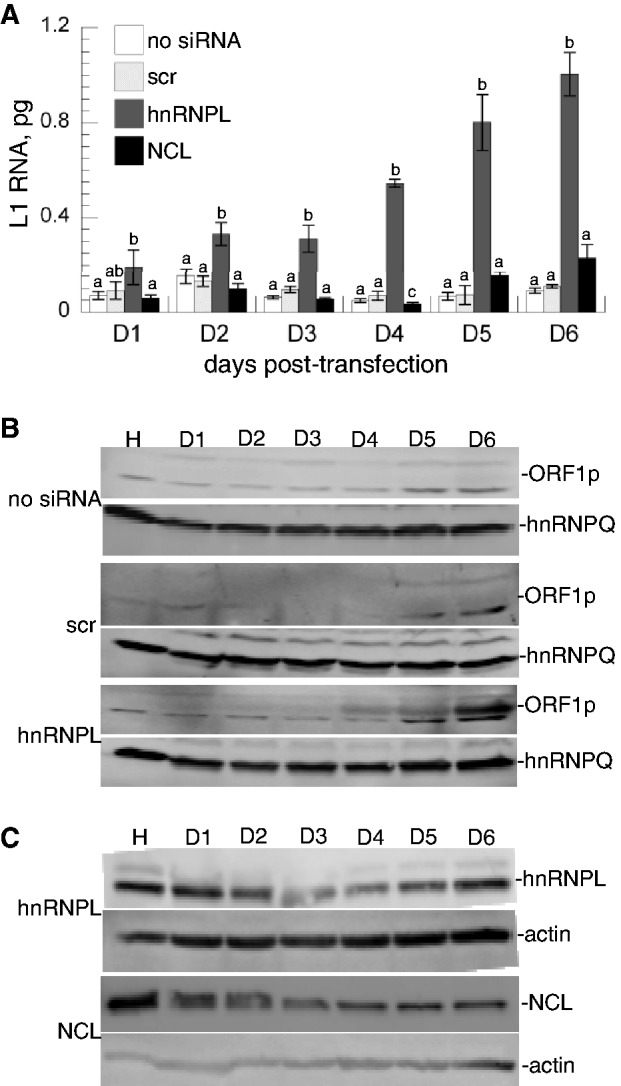
Time course of L1 RNA and ORF1 protein expression following hnRNPL or NCL depletion by RNAi. Cells were harvested 1-6 d post-transfection with the L1 retrotransposition construct as indicated. (A) L1 RNA abundance in cells that were untreated (no siRNA), or treated with scr, hnRNPL or NCL siRNA prior to introduction of mouse L1. At least one group differed each day (ANOVA P < 0.05); small letters above error bars indicate significantly different treatment groups compared to no siRNA (n = 3, P < 0.05, Tukey test). (B) L1 ORF1 protein in 40 µg of each lys. Note that ORF1p is only detected when hnRNPL is depleted. hnRNPQ protein was detected on the same blots as a loading control. (C) Western blots of lys from cells treated with hnRNPL or NCL siRNA as indicated on the left, visualized with the antibody indicated on the right.
NCL’s behaviors in all of the above assays are consistent with a role in promoting ORF2 translation—it binds the ORF2 IRES, enhances IRES function, and increases L1 retrotransposition yet does not comparably alter L1 RNA or protein levels. Although we were unable to measure the abundance of ORF2 directly, it is possible to indirectly measure L1 ORF2p by examining Alu retrotransposition. Alu retrotransposition requires L1 ORF2 (32); therefore, if NCL depletion reduces translation of L1 ORF2, Alu retrotransposition should also be decreased. As was observed with L1 retrotransposition, treatment of cells with NCL siRNA decreased ORF2-mediated Alu retrotransposition to 6% of untreated or scr siRNA controls (Figure 7A). This finding is again consistent with the predicted behavior of an ORF2 ITAF.
Figure 7.
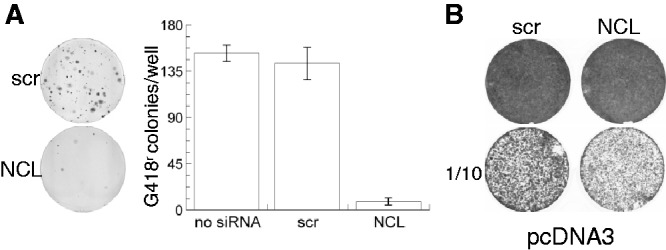
NCL knockdown reduces Alu retrotransposition, but not HeLa cell survival under G418 selection. (A) Human Alu marked with an AI-containing neomycin reporter gene was introduced 24 h after transfection with none (no siRNA), scr and NCL siRNA. Colonies were visualized after 14 d in G418, fixation and staining with crystal violet. One example well is shown for scr and NCL knockdown along with a graph plotting the average number of colonies/well from three independent experiments (each transfected in triplicate) ±sem. (B) pcDNA3 confers G418 resistance after NCL knockdown. An example well and its corresponding 1/10 dilution are shown for cells treated with scr and NCL siRNA and then transfected with pcDNA3. The number of colonies were counted; no significant differences were found (P = 0.93, Student’s t-test, n = 4).
NCL plays multiple roles in cell physiology (see Discussion section) and is essential for viability (33). This raises the possibility that the observed decreases of L1 and Alu retrotransposition under conditions of NCL depletion were due to effects on cell survival rather than retrotransposition. To test this possibility, cells were treated with either scr or NCL siRNA, transfected with pcDNA3 and then selected in G418 as for retrotransposition assays. pcDNA3 is a vector that contains the neomycin phosphotransferase gene; it confers resistance to G418 directly, without the need for retrotransposition. Although the pcDNA3 colonies were slightly smaller in cells transfected with NCL siRNA than those transfected in parallel with scr siRNA, their numbers were equivalent (Figure 7B), indicating that the cells can recover and grow in G418 after transient NCL knockdown using siRNA. Thus, it appears that the reduced retrotransposition efficiency observed with NCL depletion is not simply an effect on cell viability, but instead reflects a requirement for NCL during L1 and L1-mediated Alu retrotransposition.
hnRNPL plays multiple roles in RNA metabolism, prominently in alternative splicing (34). Native L1 lacks introns, but the autonomous retrotransposition assay depends on removal of an AI for expression of the reporter gene and thereby detection of retrotransposition events. This raises the possibility that the effect of hnRNPL knockdown is inconsequential to L1 retrotransposition because it merely alters removal of an artificial intron in the reporter. To address this potential artifact, we examined the structure of L1 RNA in cells undergoing retrotransposition after treatment with scr and hnRNPL siRNA, using both northern blotting and RT-PCR. As is typical for mouse L1 northern blots (35–37), full-length L1 RNA comprised a minority of the total hybridization intensity (Figure 8A). The majority of the signal was found in numerous smaller products that formed a smear below the longest discrete form in total RNA, but some smaller bands, too small to be retrotransposition competent, are resolved after polyA+ selection (Figure 8A, compare the left and right blots). L1 hybridization intensity was increased in both total and polyA+-enriched RNA from hnRNPL siRNA-treated cells compared to the scr controls. This result is consistent with L1 quantification by qRTPCR (Figure 6A), confirming that hnRNPL depletion allows L1 RNA to accumulate. Other than intensity, there are no clear differences in the L1 RNA hybridization pattern between scr and hnRNPL-treated cells. To more directly assess the question of whether there is a difference in the removal of the AI in cells where hnRNPL is depleted, PCR primers that capture both the intron-containing and intronless forms of the reporter gene were used to amplify cDNA made from total (data not shown) or polyA+ selected RNA (Figure 8B). We were unable to detect the intron-containing RNA in either scr or hnRNPL siRNA-treated cells. These data support the conclusion that hnRNPL is a biologically relevant host factor that limits L1 retrotransposition by limiting the abundance of L1 RNA and hence retrotransposition intermediates.
Figure 8.
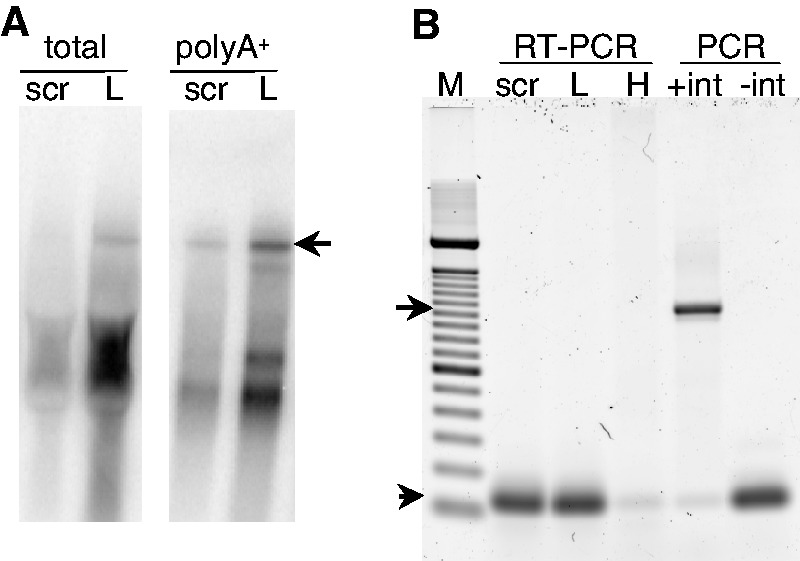
Northern blot and RT-PCR analysis of L1 RNA. (A) Phosphorimage of northern blots hybridized to the L1 probe. Lanes contain 40 µg total RNA or 6.5 µg polyA+ RNA isolated from scr or hnRNPL siRNA treated, L1-transfected HeLa cells; the arrow indicates full-length L1 RNA. (B) RT-PCR analysis of the AI in the polyA+ RNA in panel (A). Lanes contain: M, 100 bp ladder (Invitrogen); RT-PCR starting with polyA+ RNA from cells transfected with scr or hnRNPL (L) siRNA followed by the L1 eGFP reporter construct, or total RNA from HeLa cells as a negative control; PCR using 10 pg of an eGFP DNA plasmid containing the intron (+int), or lacking it (−int). The arrow marks the 1020 bp intron-containing product, and the arrowhead the 119 bp intronless product.
DISCUSSION
L1 retrotransposition begins with transcription of an active element in the genome. Like all mRNAs, the nascent L1 transcript must associate co-transcriptionally with cellular proteins, including the abundant hnRNP proteins (38). Thus, L1 RNA forms a complex with cellular proteins that accompany it to the cytoplasm as an L1mRNP for translation. It is reasonable to predict that, over the long-term evolution of LINE-1, some of these interactions facilitate and others inhibit replication. The naturally dicistronic L1 mRNA serves first as the template for translation of the two proteins that are required in cis to complete the retrotransposition cycle (3), and then as the template for reverse transcription. Translation of both ORF1 and ORF2 in mouse L1 RNA likely presents a challenge for conventional cap-dependent initiation because of the extremely long and GC-rich 5′-UTR upstream of ORF1, and the position of ORF2 as the second cistron in the dicistronic message (14). Nevertheless, translation of both of the L1 ORFs on the mRNA must and, as evidenced by successful retrotransposition, does occur. Upon sufficient accumulation of the two L1-encoded proteins, likely requiring a ratio of hundreds of initiations on ORF1 compared to two on ORF2 (14), the L1 transcript relinquishes its role as a template for translation and associates with ORF1p and ORF2p to form a distinct L1RNP complex that is capable of inserting a new copy of L1 into the genomic DNA by TPRT (39).
In this study, we demonstrate that two abundant cellular RNA-binding proteins, hnRNPL and NCL, act on L1 RNA during retrotransposition with opposing effects (Figure 4). Both were isolated by an affinity capture method using a small subset (3%) of a full length, retrotransposition competent L1 RNA (Figure 1) that was previously shown to function as an IRES for ORF2 translation (14). Both also bind L1 RNA in vivo, in cells with ongoing retrotransposition activity, based upon the ability to capture L1 RNA by RNA immunoprecipitation using either hnRNPL or NCL antibodies (Figure 5).
NCL behaved as expected for a cellular ITAF that facilitates translation of ORF2; knockdown of endogenous NCL by siRNA decreased expression of the second cistron in the dicistronic reporter assay containing the L1 ORF2 IRES, but did not affect the results obtained with the ORF1 or CrPV IRESes (Figure 2). The magnitude of this change, (approximately one-third, Supplementary Figure S1) agrees remarkably well with expectation based on the results of a previous study that suggest approximately half of the ORF2 IRES activity in this assay depends on a nuclear factor [compare RNA to DNA transfection in (14)], particularly since cellular NCL was reduced but not eliminated by the siRNA treatment. NCL depletion decreased L1 retrotransposition by at least 10-fold (Figure 4B and C), indicating that it is an important cellular factor supporting retrotransposition. The comparable decrease in L1-mediated Alu retrotransposition (Figure 7) is again consistent with reduced ORF2 translation under conditions of NCL depletion. The magnitude of the effect of NCL depletion is greater on retrotransposition than it is in the dicistronic reporter assay, which may reflect a difference in the temporal or spatial requirements of the two mRNAs for NCL; e.g. it is likely that luciferase mRNAs are translated numerous times versus far fewer for an L1 RNA in the context of L1 retrotransposition (14). Alternatively, NCL may be required for another retrotransposition function, also common to L1 and Alu, in addition to its likely role as an ITAF for the ORF2 IRES. NCL is an abundant cellular protein with multiple functions ranging from ribosome biogenesis to transcriptional control, nucleosome remodeling, nuclear-cytoplasmic shuttling, modulation of the stability and translation of specific mRNAs, internalization of growth factors, centrosome duplication and virus replication (33,40–42). Significantly and most relevant to this work, NCL has also been reported to function as an ITAF for viral IRESes (43).
Depletion of hnRNPL also decreased the relative luciferase ratio in the dicistronic reporter assay (Figure 3A). In contrast to NCL, however, this effect on translation was observed using all of the dual luciferase constructs and was therefore IRES-independent. In fact, hnRNPL depletion led to increased expression of the first cistron (Rluc) rather than decreased expression of the second (Figure 3C and D). These findings provide strong evidence against our initial hypothesis that hnRNPL functions as an ORF2 IRES-specific ITAF during L1 retrotransposition, although hnRNPL is an established ITAF, enhancing translation of hepatitis C virus (44) and Cat-1 mRNA (45). Moreover, endogenous hnRNPL limits mouse L1 retrotransposition in HeLa cells rather than supporting it as would be expected for an ITAF; this is apparent from the 10-fold increase in retrotransposition events that accompanied hnRNPL knockdown (Figure 4B and C). Consistent with the observed increase in retrotransposition events when cellular hnRNPL is depleted, the essential retrotransposition intermediates L1 RNA and ORF1p also increased (Figures 6 and 8A), with no effect on L1 RNA processing that was reflected as changes in the secondary structure of L1 RNA. We conclude that hnRNPL acts as a host defense factor to protect cells from L1 retrotransposition, apparently by decreasing the steady-state levels of L1 RNA and thereby protein intermediates that are available for the TPRT reaction.
hnRNPL has been associated with multiple effects on RNA metabolism including intron inclusion and exclusion, suppression of multiple exons and selection of alternative sites for poly-adenylation (34). It is able to both repress the use of strong splice sites and enhance the use of weak splice sites (46). hnRNPL also interacts with the mediator complex where it can impact gene expression, not only via its roles in RNA processing, but also by reducing trimethylation of histone H3 on lysine 36 (H3K36me3), a mark associated with transcriptional activation (47,48). Production of full-length, sense-strand L1 RNA is limited by poor transcriptional elongation (49,50), premature polyadenylation (50,51) and cryptic splicing (52). All of these findings can be attributed to the known activities of hnRNPL. Thus, depletion of hnRNPL may increase transcriptional elongation, and decrease use of the cryptic splice sites and premature polyadenylation signals, thereby increasing the abundance of productive retrotransposition intermediates. Because the siRNAs do not completely eliminate hnRNPL in our experiments, it is likely that the cells in the population that fully or partially escape hnRNPL RNA silencing continue to metabolize L1 RNA normally which results in detection of its quantitative (Figure 6A), but not qualitative changes (Figure 8).
Transposons shape genomes, dynamically altering both structure and function. New L1 insertions may disrupt or alter gene function, juxtapose new sequences, cause large deletions or rearrangements, and alter transcriptional regulation, splicing and polyadenylation; at the DNA level, the interspersed repeated nature of L1 provides substrates for non-allelic homologous recombination, further reorganizing the genomic landscape (53,54). To control the mobility of L1 and limit adverse effects on the genome, the host cell utilizes molecular defensive mechanisms. The first line of defense against a retrotransposon like L1 is to block transcription; there is abundant evidence in the literature for epigenetic silencing of L1 in most cell types leading to transcriptional repression. In addition a few cellular proteins are known to provide downstream blocks to the retrotransposition life cycle, including APOBEC proteins and some components of the DNA repair machinery (reviewed in 55). hnRNPL is the first cellular protein to be isolated by affinity chromatography on L1 RNA that acts to limit L1 retrotransposition.
SUPPLEMENTARY DATA
Supplementary Data are available at NAR Online: Supplementary Figure 1.
FUNDING
National Institutes of Health (NIH) [R01 GM40367 to S.L.M.]; [P30 CA046934] for the DNA Sequencing, Flow Cytometry and Proteomics Cores of the University of Colorado Cancer Center. Funding for open access charge: NIH [R01 GM40367].
Conflict of interest statement. None declared.
Supplementary Material
ACKNOWLEDGEMENTS
The authors thank J. Kieft for purified MS2-MBP fusion protein, A. Roy-Engel for pBS Ya5 neotet and J. Evans for help with assay development.
REFERENCES
- 1.Genome Sequencing Consortium Mouse. Initial sequencing and comparative analysis of the mouse genome. Nature. 2002;420:520–562. doi: 10.1038/nature01262. [DOI] [PubMed] [Google Scholar]
- 2.Goodier JL, Ostertag EM, Du K, Kazazian HHJ. A novel active L1 retrotransposon subfamily in the mouse. Genome Res. 2001;11:1677–1685. doi: 10.1101/gr.198301. [DOI] [PMC free article] [PubMed] [Google Scholar]
- 3.Wei W, Gilbert N, Ooi SL, Lawler JF, Ostertag EM, Kazazian HH, Boeke JD, Moran JV. Human L1 retrotransposition: cis preference versus trans complementation. Mol. Cell. Biol. 2001;21:1429–1439. doi: 10.1128/MCB.21.4.1429-1439.2001. [DOI] [PMC free article] [PubMed] [Google Scholar]
- 4.Kolosha VO, Martin SL. High affinity, non-sequence-specific RNA binding by the open reading frame 1 (ORF1) protein from long interspersed nuclear element 1 (LINE-1) J. Biol. Chem. 2003;278:8112–8117. doi: 10.1074/jbc.M210487200. [DOI] [PubMed] [Google Scholar]
- 5.Evans JD, Peddigari S, Chaurasiya KR, Williams MC, Martin SL. Paired mutations abolish and restore the balanced annealing and melting activities of ORF1p that are required for LINE-1 retrotransposition. Nucleic Acids Res. 2011;39:5611–5621. doi: 10.1093/nar/gkr171. [DOI] [PMC free article] [PubMed] [Google Scholar]
- 6.Martin SL, Bushman D, Wang F, Li PW-L, Walker A, Cummiskey J, Branciforte D, Williams MC. A single amino acid substitution in ORF1 dramatically decreases L1 retrotransposition and provides insight into nucleic acid chaperone activity. Nucleic Acids Res. 2008;18:5845–5854. doi: 10.1093/nar/gkn554. [DOI] [PMC free article] [PubMed] [Google Scholar]
- 7.Martin SL, Cruceanu M, Branciforte D, Wai-Lun Li P, Kwok SC, Hodges RS, Williams MC. LINE-1 retrotransposition requires the nucleic acid chaperone activity of the ORF1 protein. J. Mol. Biol. 2005;348:549–561. doi: 10.1016/j.jmb.2005.03.003. [DOI] [PubMed] [Google Scholar]
- 8.Feng Q, Moran JV, Kazazian HHJ, Boeke JD. Human L1 retrotransposon encodes a conserved endonuclease required for retrotransposition. Cell. 1996;87:905–916. doi: 10.1016/s0092-8674(00)81997-2. [DOI] [PubMed] [Google Scholar]
- 9.Moran JV, Holmes SE, Naas TP, DeBerardinis RJ, Boeke JD, Kazazian HH., Jr High frequency retrotransposition in cultured mammalian cells. Cell. 1996;87:917–927. doi: 10.1016/s0092-8674(00)81998-4. [DOI] [PubMed] [Google Scholar]
- 10.Luan DD, Korman MH, Jakubczak JL, Eickbush TH. Reverse transcription of R2Bm RNA is primed by a nick at the chomosomal target site: a mechanism for non-LTR retrotransposition. Cell. 1993;72:595–605. doi: 10.1016/0092-8674(93)90078-5. [DOI] [PubMed] [Google Scholar]
- 11.Alisch RS, Garcia-Perez JL, Muotri AR, Gage FH, Moran JV. Unconventional translation of mammalian LINE-1 retrotransposons. Genes Dev. 2006;20:210–224. doi: 10.1101/gad.1380406. [DOI] [PMC free article] [PubMed] [Google Scholar]
- 12.Dmitriev SE, Andreev DE, Terenin IM, Olovnikov IA, Prassolov VS, Merrick WC, Shatsky IN. Efficient translation initiation directed by the 900-nucleotide-long and GC-rich 5′-untranslated region of the human retrotransposon LINE-1 mRNA is strictly cap dependent rather than internal ribosome entry site mediated. Mol. Cell. Biol. 2007;27:4685–4697. doi: 10.1128/MCB.02138-06. [DOI] [PMC free article] [PubMed] [Google Scholar]
- 13.Ilves H, Kahre O, Speek M. Translation of the rat LINE bicistronic RNAs in vitro involves ribosomal reinitiation instead of frameshifting. Mol. Cell. Biol. 1992;12:4242–4248. doi: 10.1128/mcb.12.9.4242. [DOI] [PMC free article] [PubMed] [Google Scholar]
- 14.Li PW-L, Li J, Timmerman SL, Krushel LA, Martin SL. The dicistronic RNA from the mouse LINE-1 retortransposon contains an internal ribosome entry site upstream of each ORF: implications for retrotransposition. Nucleic Acids Res. 2006;34:853–864. doi: 10.1093/nar/gkj490. [DOI] [PMC free article] [PubMed] [Google Scholar]
- 15.McMillan JP, Singer MF. Translation of human LINE-1 element, L1Hs. Proc. Natl Acad. Sci. USA. 1993;90:11533–11537. doi: 10.1073/pnas.90.24.11533. [DOI] [PMC free article] [PubMed] [Google Scholar]
- 16.Jan E, Sarnow P. Factorless ribosome assumbly on the internal ribosome entry site of cricket paralysis virus. J. Mol. Biol. 2002;324:889–902. doi: 10.1016/s0022-2836(02)01099-9. [DOI] [PubMed] [Google Scholar]
- 17.Stoneley M, Subkhankulova T, Le Quesne JP, Coldwell MJ, Jopling CL, Belsham GJ, Willis AE. Analysis of the c-myc IRES; a potential role for cell-type specific trans-acting factors and the nuclear compartment. Nucleic Acids Res. 2000;28:687–694. doi: 10.1093/nar/28.3.687. [DOI] [PMC free article] [PubMed] [Google Scholar]
- 18.Stoneley M, Willis AE. Cellular internal ribosome entry segments: structures, trans-acting factors and regulation of gene expression. Oncogene. 2004;23:3200–3207. doi: 10.1038/sj.onc.1207551. [DOI] [PubMed] [Google Scholar]
- 19.King HA, Cobbold LC, Willis AE. The role of IRES trans-acting factors in regulating translation initiation. Biochem. Soc. Trans. 2010;38:1581–1586. doi: 10.1042/BST0381581. [DOI] [PubMed] [Google Scholar]
- 20.Hellen CU, Sarnow P. Internal ribosome entry sites in eukaryotic mRNA molecules. Genes Dev. 2001;15:1593–1612. doi: 10.1101/gad.891101. [DOI] [PubMed] [Google Scholar]
- 21.Spriggs KA, Bushell M, Mitchell SA, Willis AE. Internal ribosome entry segment-mediated translation during apoptosis: the role of IRES-trans-acting factors. Cell Death Differ. 2005;12:585–591. doi: 10.1038/sj.cdd.4401642. [DOI] [PubMed] [Google Scholar]
- 22.Han SP, Tang YH, Smith R. Functional diversity of the hnRNPs: past, present and perspectives. Biochem. J. 2010;430:379–392. doi: 10.1042/BJ20100396. [DOI] [PubMed] [Google Scholar]
- 23.Yu Y, Ji H, Doudna JA, Leary JA. Mass spectrometric analysis of the human 40S ribosomal subunit: native and HCV IRES-bound complexes. Protein Sci. 2005;14:1438–1446. doi: 10.1110/ps.041293005. [DOI] [PMC free article] [PubMed] [Google Scholar]
- 24.Kroutter EN, Belancio VP, Wagstaff BJ, Roy-Engel AM. The RNA polymerase dictates ORF1 requirement and timing of LINE and SINE retrotransposition. PLoS Genet. 2009;5:e1000458. doi: 10.1371/journal.pgen.1000458. [DOI] [PMC free article] [PubMed] [Google Scholar]
- 25.Barton DJ, Morasco BJ, Flanegan JB. Assays for poliovirus polymerase, 3D(Pol), and authentic RNA replication in HeLa S10 extracts. Methods Enzymol. 1996;275:35–57. doi: 10.1016/s0076-6879(96)75005-x. [DOI] [PubMed] [Google Scholar]
- 26.Epperson LE, Rose JC, Russell RL, Nikrad MP, Carey HV, Martin SL. Seasonal protein changes support rapid energy production in hibernator brainstem. J. Comp. Physiol. B. 2010;180:599–617. doi: 10.1007/s00360-009-0422-9. [DOI] [PMC free article] [PubMed] [Google Scholar]
- 27.Martin SL. Ribonucleoprotein particles with LINE-1 RNA in mouse embryonal carcinoma cells. Mol. Cell. Biol. 1991;11:4804–4807. doi: 10.1128/mcb.11.9.4804. [DOI] [PMC free article] [PubMed] [Google Scholar]
- 28.Niranjanakumari S, Lasda E, Brazas R, Garcia-Blanco MA. Reversible cross-linking combined with immunoprecipitation to study RNA-protein interactions in vivo. Methods. 2002;26:182–190. doi: 10.1016/S1046-2023(02)00021-X. [DOI] [PubMed] [Google Scholar]
- 29.Ji H, Fraser CS, Yu Y, Leary J, Doudna JA. Coordinated assembly of human translation initiation complexes by the hepatitis C virus internal ribosome entry site RNA. Proc. Natl Acad. Sci. USA. 2004;101:16990–16995. doi: 10.1073/pnas.0407402101. [DOI] [PMC free article] [PubMed] [Google Scholar]
- 30.Wilson JE, Powell MJ, Hoover SE, Sarnow P. Naturally occurring dicistronic cricket paralysis virus RNA is regulated by two internal ribosome entry sites. Mol. Cell. Biol. 2000;20:4990–4999. doi: 10.1128/mcb.20.14.4990-4999.2000. [DOI] [PMC free article] [PubMed] [Google Scholar]
- 31.Ostertag EM, Prack ETL, DeBerardinis RJ, Moran JB, Kazazian HH., Jr Determination of L1 retrotransposition kinetics in cultured cells. Nucleic Acids Res. 2000;28:1418–1423. doi: 10.1093/nar/28.6.1418. [DOI] [PMC free article] [PubMed] [Google Scholar]
- 32.Dewannieux M, Esnault C, Heidmann T. LINE-mediated retrotransposition of marked Alu sequences. Nat. Genet. 2003;35:41–48. doi: 10.1038/ng1223. [DOI] [PubMed] [Google Scholar]
- 33.Storck S, Thiry M, Bouvet P. Conditional knockout of nucleolin in DT40 cells reveals the functional redundancy of its RNA-binding domains. Biol. Cell. 2009;101:153–167. doi: 10.1042/BC20080054. [DOI] [PubMed] [Google Scholar]
- 34.Hung LH, Heiner M, Hui J, Schreiner S, Benes V, Bindereif A. Diverse roles of hnRNP L in mammalian mRNA processing: a combined microarray and RNAi analysis. RNA. 2008;14:284–296. doi: 10.1261/rna.725208. [DOI] [PMC free article] [PubMed] [Google Scholar]
- 35.Benihoud K, Bonardelle D, Soual-Hoebeke E, Durand-Gasselin I, Emilie D, Kiger N, Bobe P. Unusual expression of LINE-1 transposable element in the MRL autoimmune lymphoproliferative syndrome-prone strain. Oncogene. 2002;21:5593–5600. doi: 10.1038/sj.onc.1205730. [DOI] [PubMed] [Google Scholar]
- 36.Branciforte D, Martin SL. Developmental and cell type specificity of LINE-1 expression in mouse testis: implications for transposition. Mol. Cell. Biol. 1994;14:2584–2592. doi: 10.1128/mcb.14.4.2584. [DOI] [PMC free article] [PubMed] [Google Scholar]
- 37.Martin SL, Branciforte D. Synchronous expression of LINE-1 RNA and protein in mouse embryonal carcinoma cells. Mol. Cell. Biol. 1993;13:5383–5392. doi: 10.1128/mcb.13.9.5383. [DOI] [PMC free article] [PubMed] [Google Scholar]
- 38.Dreyfuss G, Kim VN, Kataoka N. Messenger-RNA-binding proteins and the messages they carry. Nat. Rev. Mol. Cell Biol. 2002;3:195–205. doi: 10.1038/nrm760. [DOI] [PubMed] [Google Scholar]
- 39.Martin SL, Li PW-l, Furano AV, Boissinot S. The structures of mouse and human L1 elements reflect their insertion mechanism. Cytogenet. Genome Res. 2005;110:223–228. doi: 10.1159/000084956. [DOI] [PubMed] [Google Scholar]
- 40.Calle A, Ugrinova I, Epstein AL, Bouvet P, Diaz JJ, Greco A. Nucleolin is required for an efficient herpes simplex virus type 1 infection. J. Virol. 2008;82:4762–4773. doi: 10.1128/JVI.00077-08. [DOI] [PMC free article] [PubMed] [Google Scholar]
- 41.Ginisty H, Sicard H, Roger B, Bouvet P. Structure and functions of nucleolin. J. Cell Sci. 1999;112:761–772. doi: 10.1242/jcs.112.6.761. [DOI] [PubMed] [Google Scholar]
- 42.Mongelard F, Bouvet P. Nucleolin: a multiFACeTed protein. Trends Cell Biol. 2007;17:80–86. doi: 10.1016/j.tcb.2006.11.010. [DOI] [PubMed] [Google Scholar]
- 43.Izumi RE, Valdez B, Banerjee R, Srivastava M, Dasgupta A. Nucleolin stimulates viral internal ribosome entry site-mediated translation. Virus Res. 2001;76:17–29. doi: 10.1016/s0168-1702(01)00240-4. [DOI] [PubMed] [Google Scholar]
- 44.Hahm B, Kim YK, Kim JH, Kim TY, Jang SK. Heterogeneous nuclear ribonucleoprotein L interacts with the 3′-border of the internal ribosomal entry site of hepatitis C virus. J. Virol. 1998;72:8782–8788. doi: 10.1128/jvi.72.11.8782-8788.1998. [DOI] [PMC free article] [PubMed] [Google Scholar]
- 45.Majumder M, Yaman I, Gaccioli F, Zeenko VV, Wang C, Caprara MG, Venema RC, Komar AA, Snider MD, Hatzoglou M. The hnRNA-binding proteins hnRNP L and PTB are required for efficient translation of the Cat-1 arginine/lysine transporter mRNA during amino acid starvation. Mol. Cell. Biol. 2009;29:2899–2912. doi: 10.1128/MCB.01774-08. [DOI] [PMC free article] [PubMed] [Google Scholar]
- 46.Motta-Mena LB, Heyd F, Lynch KW. Context-dependent regulatory mechanism of the splicing factor hnRNP L. Mol. Cell. 2010;37:223–234. doi: 10.1016/j.molcel.2009.12.027. [DOI] [PMC free article] [PubMed] [Google Scholar]
- 47.Huang Y, Li W, Yao X, Lin Q-J, Yin J-W, Liang Y, Heiner M, Tian B, Hui J, Wang G. Mediator complex regulates alternative mRNA processing via the MED23 subunit. Mol. Cell. 2012;45:459–469. doi: 10.1016/j.molcel.2011.12.022. [DOI] [PMC free article] [PubMed] [Google Scholar]
- 48.Yuan W, Xie J, Long C, Erdjument-Bromage H, Ding X, Zheng Y, Tempst P, Chen S, Zhu B, Reinberg D. Heterogeneous nuclear ribonucleoprotein L is a subunit of human KMT3a/Set2 complex required for H3 Lys-36 trimethylation activity in vivo. J. Biol. Chem. 2009;284:15701–15707. doi: 10.1074/jbc.M808431200. [DOI] [PMC free article] [PubMed] [Google Scholar]
- 49.Han JS, Boeke JD. A highly active synthetic mammalian retrotransposon. Nature. 2004;429:314–318. doi: 10.1038/nature02535. [DOI] [PubMed] [Google Scholar]
- 50.Han JS, Szak ST, Boeke JD. Transcriptional disruption by the L1 retrotransposon and implications for mammalian transcriptomes. Nature. 2004;429:268–274. doi: 10.1038/nature02536. [DOI] [PubMed] [Google Scholar]
- 51.Perepelitsa-Belancio V, Deininger P. RNA truncation by premature polyadenylation attenuates human mobile element activity. Nat. Genet. 2003;35:363–366. doi: 10.1038/ng1269. [DOI] [PubMed] [Google Scholar]
- 52.Belancio VP, Hedges DJ, Deininger P. LINE-1 RNA splicing and influences on mammalian gene expression. Nucleic Acids Res. 2006;34:1512–1521. doi: 10.1093/nar/gkl027. [DOI] [PMC free article] [PubMed] [Google Scholar]
- 53.Cordaux R, Batzer MA. The impact of retrotransposons on human genome evolution. Nat. Rev. Genet. 2009;10:691–703. doi: 10.1038/nrg2640. [DOI] [PMC free article] [PubMed] [Google Scholar]
- 54.Han JS, Boeke JD. LINE-1 retrotransposons: modulators of quantity and quality of mammalian gene expression? Bioessays. 2005;27:775–784. doi: 10.1002/bies.20257. [DOI] [PubMed] [Google Scholar]
- 55.Zamudio N, Bourc'his D. Transposable elements in the mammalian germline: a comfortable niche or a deadly trap? Heredity. 2010;105:92–104. doi: 10.1038/hdy.2010.53. [DOI] [PubMed] [Google Scholar]
Associated Data
This section collects any data citations, data availability statements, or supplementary materials included in this article.