Abstract
This paper describes the system design of a portable and economical mu rhythm based Brain Computer Interface which employs Cypress Semiconductors Programmable System on Chip (PSoC). By carrying out essential processing on the PSoC, the use of an extra computer is eliminated, resulting in considerable cost savings. Microsoft Visual Studio 2005 and PSoC Designer 5.01 are employed in developing the software for the system, the hardware being custom designed. In order to test the usability of the BCI, preliminary testing is carried out by training three subjects who were able to demonstrate control over their electroencephalogram by moving a cursor present at the center of the screen towards the indicated direction with an average accuracy greater than 70% and a bit communication rate of up to 7 bits/min.
Keywords: Electroencephalogram, brain computer interface, Mu rhythm, prosthetic, portable, microcontroller, PSoC
INTRODUCTION
A brain computer interface (BCI) is a device that can provide basic communication ability by regulation of brain activity alone and thus may be the only means of communication for people who are completely paralyzed, like those suffering from final-stage amyotrophic lateral sclerosis or cerebral palsy. A BCI bypasses the malfunctioning neuromuscular pathways of the brain entirely, allowing even the most severely disabled to communicate by deliberately changing their electroencephalogram (EEG).[1]
The first BCI was developed over two decades ago and since then considerable advances have been made in BCI technology, including the use of different paradigms, a variety of distinctive EEG signals and various signal-processing algorithms. In spite of these advances, BCI technology continues to remain immature. A significant factor stalling its utilization in medical settings is its prohibitive cost. This paper describes in detail the hardware and software design used to develop a portable and economical mu rhythm-based BCI using the programmable system on chip (PSoC) CY8C29466 (by Cypress Semiconductors). The performance of the BCI is encouraging and merits further investigation into the development of other portable and cost-effective BCI systems as well. The rationale of this study is to demonstrate the effectiveness of microcontrollers/PSoC in the field of BCI technology, highlighting the fact that the cost-effectiveness and miniaturization offered by employing such devices will open another direction of research for the future.
The mu rhythm, used as the input signal to the BCI described in this paper, is an idling rhythm extracted in the frequency range of 8–12 Hz over the sensorimotor cortices of people who are awake, when they are not engaged in processing sensory input or motor output.[2] Typically, movement or preparation for movement leads to a decrease in mu rhythm activity, whereas relaxation results in the opposite. It is important to note that the difference in voltage levels for relaxation and motor imagery tends to diverge with neurofeedback training, and this helps in improving system performance. The performance of a BCI, ultimately just a communication device, is quantified in terms of accuracy and communication rate (in bits/min).
The accuracy and communication rate of BCI systems (not just the ones based on mu rhythm) is reported to be vary between 70% and 95% and from 5.45 bits/min to 10 bits/min, respectively.[3] Even under the most optimal conditions, communication rates cannot cross 25 bits/min. The communication rate of a BCI depends on both the classification accuracy and the speed of the BCI.[4] It is significant to note that motor imagery-based BCIs, like the one based on mu rhythm, may have an accuracy of only 60% for some subjects.[3]
The best results for unidimensional mu rhythm based BCIs are reported to be an average accuracy and average communication rate of 90% and 20 bits/min for 80% of the subjects (total of five subjects selected from a pool of 60 on the basis of having strong mu rhythm) after 8 weeks of training.[2,5] This study uses a thresholding-based method to differentiate between high and low mu rhythm power, the threshold being set empirically by an operator for each subject. A detailed description of the system design can be found in the paper by Neat et al.[6] On the other hand, the accuracy and communication rate achieved by a mu rhythm-based BCI designed by Penny et al is reported as 61% and 1.2 bits/min, respectively.[3] Here, a pattern recognition-based approach is used to differentiate between high and low mu rhythm power. A “reject” option is present, which can be used to reject classifications that have low confidence. This results in slower cursor movement but with an increase in average accuracy and bit rate to 86% and 7.2 bits/min, respectively.[3]
Encouraging results have been obtained by researchers in classifying mu rhythm-based synchronization/desynchronization as a response to four different motor imagery tasks. This shows the potential of mu rhythm-based BCIs to provide multidimensional control.[7]
The aim of the present work is an attempt to provide mouse-like user control in one dimension. The user is presented a screen with a cursor in the middle and targets at the top and bottom of the screen. The user is supposed to move the cursor toward the highlighted target as quickly as possible. The framework of hardware and software is designed in order to facilitate this user control.
The rest of the paper is arranged as follows: Materials and Methods discusses the system design of the BCI and the mu rhythm analysis; in the next section,the results of preliminary testing are povided; finally, Discussions and Conclusions concludes the paper.
MATERIALS AND METHODS
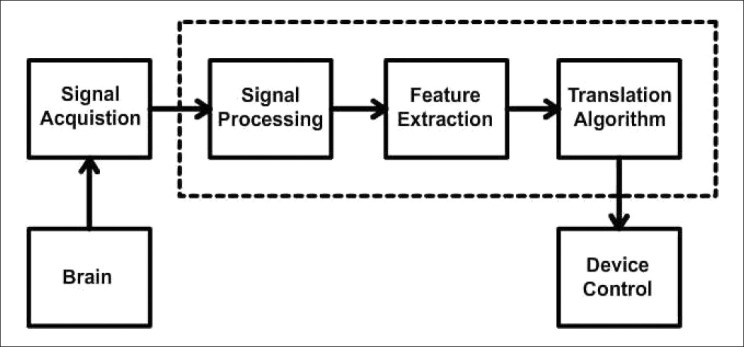
Figure 1 shows the basic design of a typical BCI. The “Signal Acquisition” system amplifies and digitizes the signal. “Signal Processing” aims at maximizing the signal to noise ratio (SNR) so as to make it easier to interpret the commands embedded in the signal. It may involve artifact rejection, spectral filtering and spatial filtering. “Feature Extraction” aims at identifying those characteristics of the brain signal that are uniquely caused by a mental process or state. These features may be temporal, spectral or a combination of both. The function of the “Translation Algorithm” is to convert the independent variable (i.e., signal features) into dependent variables (i.e., device control commands). An important requirement of the translation algorithm is that it should adapt itself to the extent of control demonstrated by the user in order to improve system performance. Automating the adaptation process continues to remain one of the most important challenges in BCI technology.
Figure 1.

Typical block diagram depicting a brain computer interface
The BCIs designed so far including the ones based on the mu rhythm have exclusively used software-based techniques for implementing the “Signal Processing,” “Feature Extraction” and “Translation Algorithm” blocks and therefore require a dedicated computer for this purpose. On a block diagram level, the novelty of this paper is that “Signal Processing,” “Feature Extraction” and part of the “Translation Algorithm” are implemented on a PSoC. The details of this design are provided in the remainder of the section.
Signal Acquisition System
Figure 2 is a block diagram depiction of the signal acquistion system employed. Disposable Ag/AgCl disc electrodes of size 10 mm are placed at C3 and Cz in accordance with the International 10-20 Electrode Placement System. The AD624, a high-precision, low-noise instrumentation amplifier with gain programmed to 1000 (pin-programmable) is used as an “Instrumentation Amplifier.” The AD624 offers an extremely high common mode rejection ratio of 130 dB when programmed to provide a gain of 1000.[8] Furthermore, being pin-programmable, the use of external components is minimized, thereby enhancing the system's simplicity.
Figure 2.

Block diagram of a signal acquisition system
A fourth-order band pass filter, designed by cascading two second-order Butterworth band pass filters, is employed as it provides a fair tradeoff between circuit simplicity and noise attenuation in the stop band. LF-353, a dual junction field effect transistor input operational amplifier, is used to design the filter as it provides a high slew rate, has an excellent common-mode rejection ratio (100 dB) and induces minimal noise.[9] The frequency response of the final filter is found to be satisfactory with a pass band from 5 Hz to 25 Hz and a gain of 2.5 in the 8–12 Hz band (maximum variation is 4% within the 8–12 Hz band). A second stage of amplification using an AD-624 with gain programmed to 100 is used, resulting in an overall gain of 250,000 for the 8–12 Hz band. Finally, a clamping stage is added as the analog to digital converter on the PSoC requires the signal to be entirely above DC.
Signal Processing and Feature Extraction on the PSoC
Figure 3 shows the postclamping stages implemented on the PSoC required to realize the BCI. To the best of our knowledge, no previous attempt has been made at designing a BCI where signal processing and feature extraction are implemented outside of a computer.
Figure 3.

Postclamping stages of brain computer interface development
Signal processing on the PSoC
The incoming analog signal is sampled at 128 samples/s (sps). Following this, 64 consecutive data samples are digitized and stored in an array resulting in an epoch length of 0.50 s (max error is 2% or less).
Post digitization, DC offset compensation is carried out for each epoch as the DC level of the signal can vary from trial to trial and, occasionally, within the same trial as well.
The Cooley-Tukey Fast Fourier Transform algorithm, written in C, is used for calculating the 64 point Discrete Fourier Transform (DFT) of the recorded data.
The average power in the 8–12 Hz range is calculated and serially transmitted to a personal computer (here Hewlett Packard 6515b laptop).
Graphical user interface for feedback and calibration
For the purpose of neurofeedback training, an application is designed in the Visual Basic script using Microsoft Visual Studio. This application receives the average power in the 8–12 Hz range from the PSoC. This application has two Graphical User Interfaces (GUI's), one each for the user and the operator. The role of the “user” GUI is to simply provide feedback to the user, whereas the “operator” GUI is used for setting the threshold for mu rhythm power and for calibrating the mu rhythm power in order to optimally exploit the degree of control demonstrated by the user.
User GUI
A cursor is present at the center of the screen with targets at the top and bottom end of the screen, respectively.
On starting the application, one of the targets is highlighted; this is the cue for the user to move the cursor in that direction.
If the user can move the cursor to the highlighted target successfully, it is registered as a “hit.” The application then refreshes itself with the cursor back at the center with a new highlighted target. If the user moves the cursor in the wrong direction and makes contact with the target that is not highlighted, it is registered as a “miss” and the application refreshes itself with the cursor back at the center of the screen. The targets are highlighted in a random order, thereby giving the user an opportunity to demonstrate control over the cursor movement.
The results of the session in terms of accuracy and information transfer rate are provided to the user in an online fashion.
Operator GUI
After a stable mu rhythm recording is obtained, the operator sets the threshold to a value between 0 and 100 (empirically) in the operator GUI in a way such that the cursor moves up and down approximately equal number of times.
A bar graph, acting as a power meter is present, which objectively displays the power in the mu rhythm frequency range (8–12 Hz). Because the ambient power in the mu rhythm range can vary over time within the same session and from session to session, depending on a multitude of factors like drying up of gel and electrode aging, a provision to perform scaling of the power is present. This can be done by adjusting a horizontal scroll bar provided below the power meter. This scaling is done in order to restrict the ambient changes in power to the range of 0–100 such that the power levels for relaxation and motor imagery fall between 0 and 100. By doing so, the value of the threshold can be kept constant for a session.
Depending on whether the mu rhythm power of the user is above or below the set threshold, the command to move the cursor correspondingly is sent to the “user” GUI.
The importance of suitable calibration cannot be emphasized enough as, only by doing so, we can ensure that the BCI is able to optimally utilize the degree of control demonstrated by the user. Because it is not possible to automate the calibration process, the operator continues to remains an integral part of the BCI.
Analysis of Mu Rhythm
Three subjects naïve to neurofeedback training are trained for 15 min thrice a day, 6 days a week for a period of 2 weeks. It is important to note that each session is treated as a singular entity for the purpose of quantifying the performance of the subjects. The sampling rate for the PSoC is set at 128 sps and epochs of 0.50 s duration are used to calculate mu rhythm power. The following formulas are used for calculating the mu rhythm power:
Frequency resolution for the DFT of the acquired data is given by (1)

Where, Fr is the frequency resolution
epl is the epoch length of the acquired data
n is the number of samples in the captured epoch
N is the length of the DFT employed
The size of the frequency bin, Fb for each sample in the DFT, is given by (2)

Thus, the amplitudes of the DFT, a[1], a[2] …a[N], correspond to the amplitudes for frequencies Fb, 2Fb…NFb.
Equation (3) is used for calculation of power in the frequency range of interest:

where, Power is the average power in the frequency band of interest
N is the number of samples for which the power is calculated
n1 and n2 are the sample numbers of the frequencies corresponding to the highest and lowest frequencies of the frequency band
a[i] is amplitude corresponding to the ith frequency component
EXPERIMENTAL RESULTS
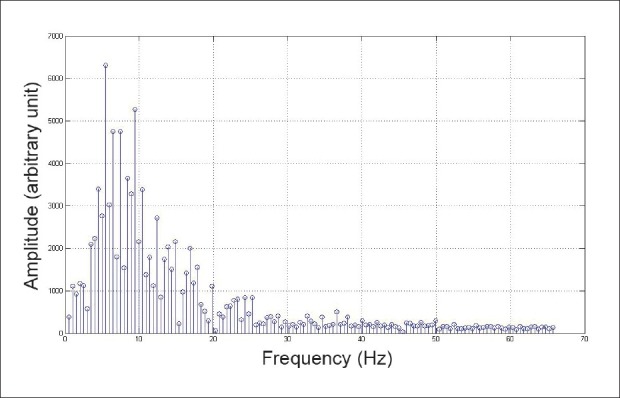
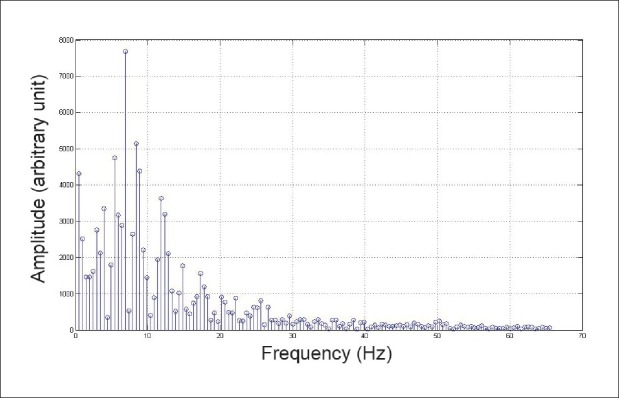
Figures 4 and 5 are the DFT plots of a subject during states of relaxation and motor imagery, respectively. While not visually ascertainable, the mu rhythm power in Figure 4 is approximately four-times larger than the mu rhythm power in Figure 5.
Figure 4.

Discrete Fourier Transform of subject relaxing (x axis is frequency in Hertz whereas y axis is amplitude in arbitrary units)
Figure 5.

Discrete Fourier Transform of subject performing motor imagery (x axis is frequency in Hertz whereas y axis is amplitude in arbitrary units)
While analysis on a longer epoch length would yield a better frequency resolution, thereby allowing more accurate measurements of power in the 8–12 Hz range, doing so reduces the speed of communication. Thus, a tradeoff between the accuracy of power measurement versus the speed of communication exists.
Equations (4) and (5) are employed to quantify the results of the BCI:
-
Measuring accuracy

-
Measuring communication speed

During the course of training, the highest accuracy and hit rate were observed to be 80% and 7 hits/min, respectively, for subject “2” (during the penultimate training session). The performance of each of the subjects on the final day of the training is tabulated in Table 1. The accuracy and communication rate described here is the average during the course of the session. This “test” session, like the earlier training sessions, is for a duration of 15 min. During this period, the user is continuously given cues to move the cursor in a certain direction. The total number of tries for which the accuracy and communication rate are calculated is variable and depends on the speed with which the user can move the cursor. The higher the speed, the higher the number of attempts the user can make to move the cursor in the 15-min window.
Table 1.
Performance of subjects on the final day of training

As can be expected, the accuracy was observed to diverge from 50% as training progressed along with a gradual increase in communication rate for all subjects. Occasionally, low accuracy and communication rate were observed, but this can be attributed to the fact that control over EEG like any other skill is highly dependent on concentration, a lapse of which can lead to reduced performance.
DISCUSSIONS AND CONCLUSIONS
A mu rhythm-based BCI has been designed and implemented in a novel manner. Its functionality is verified by training subjects for a period of 2 weeks, after which they were able to show sufficient control over cursor movement in order to validate the functional ability of the BCI. This BCI design is not only the first of its kind but is also cost-effective, a unit of which would cost $300 or less.
The significant shortcomings of this study are that the number of subjects trained and tested on this BCI is small and that the training duration is short. However, the primary objective of validating the functionality of the BCI is achieved. Another potential area of improvement is to enhance the performance of the BCI. Theoretically, this can be achieved in two ways, the first of which is to increase the duration of training for the subjects so that they can respond to the cues faster. The other would be to reduce the processing time of the translation algorithm. The authors are currently involved in doing so by using the Goertzel algorithm in place of the fast fourier transform algorithm.
Another shortcoming of the present study, also common to other “thresholding”-based mu rhythm BCI systems, is the need for an operator whose role remains central to the BCI system, as automating the requirement for calibration continues to remain an open problem.
BIOGRAPHIES

Rohan Joshi is currently pursuing a Masters degree in Biomedical Engineering in Katholieke Universiteit Leuven, Belgium. His areas of interest are bioinstrumentation and physiological signal processing. In the past, as a Bachelors student at Manipal University, he has conducted research focussed on the application of Informatics towards the analysis of clinical data.

Prateek Saraswat obtained his bachelor's degree in Biomedical Engineering from Manipal University in Manipal, India in 2011. He is currently pursuing a masters degree in engineering at the Chalmers Technical School in Gothenburg, Sweden. His area of specialization is the use of computers in healthcare to improve the efficiency and reach of healthcare systems with the aid of modern information and communication technologies; with the goal to make healthcare solutions not only more affordable but also more readily available.

Rudhram Gajendran graduated from Manipal University, India with a Bachelor's degree in Biomedical Engineering in June 2011. During his undergraduate years he was involved in research projects along with faculty towards the development of diagnostic tools. He is currently pursuing a Master's degree in Bioengineering at University of Illinois at Chicago, United States. He is a member of Engineering World Health, involved in improving healthcare technology in developing nations.
Footnotes
Source of Support: Nil
Conflict of Interest: None declared
REFERENCES
- 1.Wolpaw JR, Birbaumer N, McFarland DJ, Pfurtscheller G, Vaughan TM. Brain–computer interfaces for communication and control. Clin Neurophysiol. 2002;113:767–91. doi: 10.1016/s1388-2457(02)00057-3. [DOI] [PubMed] [Google Scholar]
- 2.Wolpaw JR, McFarland DJ, Neat GW, Forneris CA. An EEG-based brain-computer interface for cursor control. Electroencephalogr Clin Neurophysiol. 1991;78:252–9. doi: 10.1016/0013-4694(91)90040-b. [DOI] [PubMed] [Google Scholar]
- 3.Penny WD, Roberts SJ, Curran EA, Stokes MJ. EEG-based communication: A pattern recognition approach. IEEE Trans Rehabil Eng. 2000;8:214–5. doi: 10.1109/86.847820. [DOI] [PubMed] [Google Scholar]
- 4.van Gerven M, Farquhar J, Schaefer R, Vlek R, Geuze J, Nijholt A, et al. The brain–computer interface cycle. J Neural Eng. 2009;6:041001. doi: 10.1088/1741-2560/6/4/041001. [DOI] [PubMed] [Google Scholar]
- 5.Penny WD, Roberts SJ. Experiments with an EEG-Based Computer Interface, Department of Electrical Engineering Imperial College, Tech. Rep. TR-99-9. 1999 [Google Scholar]
- 6.Neat GW, McFarland DJ, Forneris CA, Wolpaw JR. EEG-based Brain-to-computer Communications: System Description. Annual International Conference on the IEEE Engineering in Medicine Biology Society. 1990;12(5) ISBN: 0-87942-559-8. [Google Scholar]
- 7.Pfurtscheller G, Brunner C, Schlögl A, Da Silva Lopes FH. Mu rhythm de(synchronization) and EEG single-trial classification of different motor imagery tasks. NeuroImage. 2006;31:153–9. doi: 10.1016/j.neuroimage.2005.12.003. [DOI] [PubMed] [Google Scholar]
- 8.Precision Instrumentation Amplifier AD624 Datasheet, Analog Devices. [Last accessed on 2011 May 20]. Available from: http://www.analog.com/static/imported-files/data_sheets/AD624.pdf .
- 9.Wide Bandwidth Dual JFET Input Operational Amplifier LF353 Datasheet, National Semiconductor. [Last accessed on 2011 May 20]. Available from: http://www.national.com/ds/LF/LF353.pdf .


