Abstract
Image classification is an issue that utilizes image processing, pattern recognition and classification methods. Automatic medical image classification is a progressive area in image classification, and it is expected to be more developed in the future. Because of this fact, automatic diagnosis can assist pathologists by providing second opinions and reducing their workload. This paper reviews the application of the adaptive neuro-fuzzy inference system (ANFIS) as a classifier in medical image classification during the past 16 years. ANFIS is a fuzzy inference system (FIS) implemented in the framework of an adaptive fuzzy neural network. It combines the explicit knowledge representation of an FIS with the learning power of artificial neural networks. The objective of ANFIS is to integrate the best features of fuzzy systems and neural networks. A brief comparison with other classifiers, main advantages and drawbacks of this classifier are investigated.
Keywords: ANFIS, automatic diagnosis, medical image classification
INTRODUCTION
Automatic diagnostic systems are an important application of analysis of database and pattern recognition, aiming at assisting physicians in marking diagnostic decisions.[1] Automated diagnosis is especially used to diagnose the variety of cancers. Because of this fact, cancer is the second leading cause for death of both men and women in the world, and is expected to become the first cause of death in the next few decades.[2] Automated diagnostic systems have been applied to and are of interest for a variety of medical data,[1] including medical signals and medical images. Among the applications of the adaptive neuro-fuzzy inference system (ANFIS) in medical diagnosis are some experiments that use medical signals as input data for diagnosing diseases such as diabetes diseases,[3–5] blood acidity,[6] valvular heart diseases,[7–9] rheumated arthritis disease,[10] epileptic seizure,[11] prostate cancer,[12] microarray cancer such as colon cancer, leukemia cancer and lymphoma cancer,[13] optic nerve diseases,[14] detecting Doppler signal,[15] analysis of internal carotid arterial Doppler signals,[16] detecting electroencephalogram (EEG) signals[17,18] and ophthalmic arterial disorder.[19]
However, this paper emphasizes the medical diagnosis from medical images. Medical image classification has three main steps: pre-processing, feature extraction and classification. The pre-processing step is done to enhance the medical image. After pre-processing, various algorithms are used for image segmentation to prepare a medical image for extracting features that are fed into a classifier as input vectors. In all applications in which ANFIS is applied as classifier, the input vector of the ANFIS model consists of features that are extracted from a segmented image. In these works, different methods are used for the segmentation and feature extraction steps. Segmentation and feature extraction algorithms section of this paper reviewed these approaches. Although this work emphasizes on ANFIS as a classifier, in addition, it can be used for other different tasks like denoising or segmentation. This paper is followed by brief examples of these two tasks.
Denoising
Most of the images are affected through noises and artifacts caused by the various acquisition techniques and, hence, an effective technique for denoising is necessary for medical images, particularly in computed tomography, which is a significant and most general modality in medical imaging. The Authors in[20–22] make use of ANFIS for removing different types of noise from images, such as Gaussian noise,[20] speckle noise[21] and impulse noise.[22] Hence, denoised and quality-enhanced images are obtained.
Segmentation
Image segmentation and its performance evaluation are vital aspects in image processing and, because of the complexity of the medical images, segmentation of medical imagery remains a challenging problem. The ANFIS model can be used as an approach for segmentation of different diseases such as breast cancer,[23–25] renal calculi[26] and, especially, brain tumor.[27–30]
The layout of this paper is as follows: ANFIS section introduces the ANFIS structure and its learning algorithm. In segmentation and feature extraction algorithms section, the methods of segmentation and feature extraction in medical image applications in which the ANFIS model is applied as classifier are reviewed. ANFIS classifier section, presents a survey on works that used the ANFIS model as classifier in medical image classification and a brief comparison with other classifiers is proposed. Also, the main advantages and drawbacks of ANFIS are discussed in this section. In order to clear the aim of this study, the framework of medical diagnosis by using the ANFIS model is presented in Figure 1. The main purpose of this paper can be followed by the solid line in the figure. Finally, the paper concludes in conclusion section.
Figure 1.
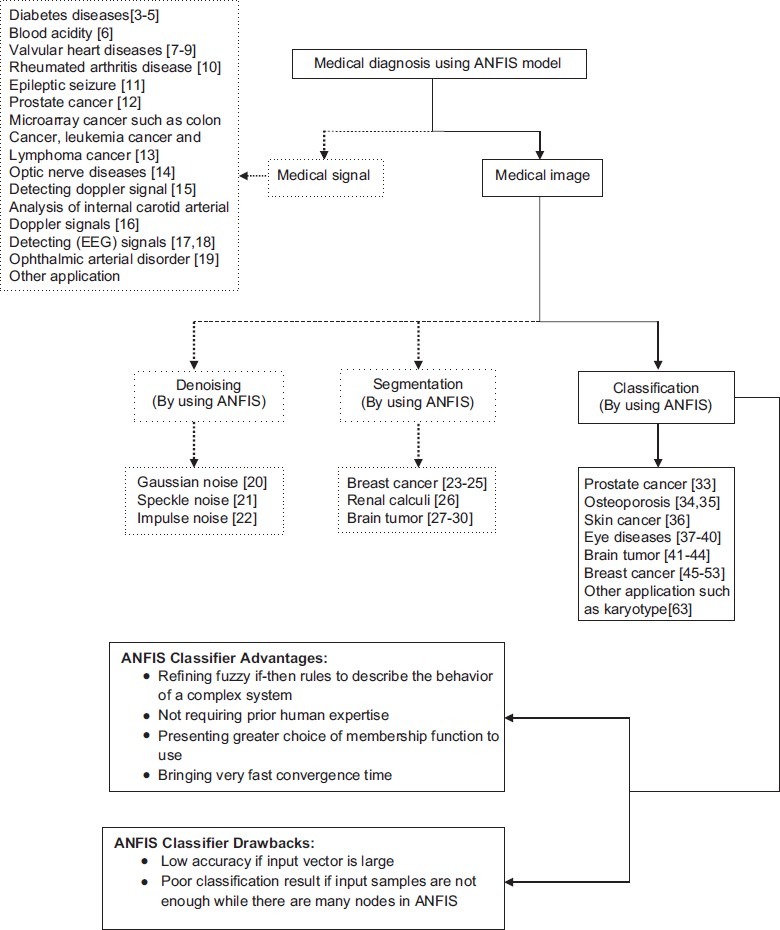
Framework of medical diagnosis using the adaptive neuro-fuzzy inference system model
ANFIS
ANFIS Structure
For simplicity, we assume a network with two inputs, x and y, and one output, f.[31] The ANFIS is a fuzzy Sugeno model. To present the ANFIS architecture, two fuzzy if–then rules based on a first-order Sugeno model are considered:
Rule 1: if x is A1 and y is B1, then f1 = p1x + q1y + r1
Rule 2: if x is A2and y is B2, then f2 = p2x + q2y + r2
where, x and y are the inputs, Ai and Bi are the fuzzy sets, fi, I = 1, 2 are the outputs of the fuzzy system and pi, qi and ri are the design parameters that are determined during the training process. The ANFIS architecture to implement these two rules is shown in Figure 2, in which a circle indicates a fixed node whereas a square indicates an adaptive node. As illustrated in the figure, the ANFIS architecture consists of five layers.
Figure 2.
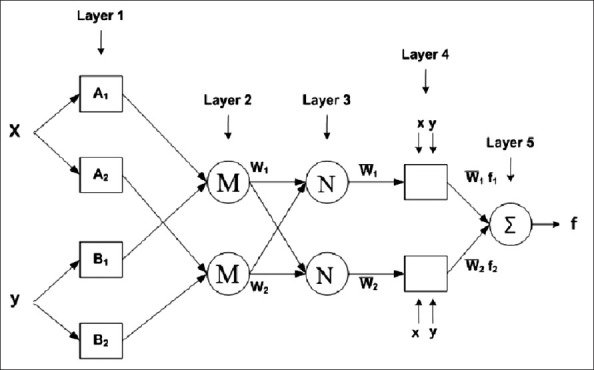
Adaptive neuro-fuzzy inference system structure
Layer 1: Every node in layer 1 is an adaptation node. The outputs of layer 1 are the fuzzy membership grades of the inputs, which are given by:

where, x and y are the inputs to node i, A is a linguistic label and  and
and  can adopt any fuzzy membership function. Usually,
  can be selected such as:

where, ai, bi and ci are the parameters of the membership bell-shape function.
Layer 2: The nodes of this layer are labeled M, indicating that they perform as a simple multiplier. The outputs of this layer can be represented as:
![]()
Layer 3: It contains fixed nodes that calculate the ratio of the firing strengths of the rules as follows:
![]()
Layer 4: In this layer, the nodes are adaptive nodes. The outputs of this layer are computed by the formula given below:
![]()
where,  is a normalized firing strength from layer 3.
Layer 5: The node performs the summation of all incoming signals. Hence, the overall output of the model is given by:

It can be seen that there are two adaptive layers in this ANFIS architecture, namely the first layer and the fourth layer. In the first layer, there are three modifiable parameters {a, bici}, which are related to the input membership functions. These parameters are generally termed as premise parameters. In the fourth layer, there are also three modifiable parameters {piqiri} pertaining to the first-order polynomial. These parameters are the so-called consequent parameters.
Learning Algorithm of the ANFIS
The task of the learning algorithm for this architecture is to tune all the modifiable parameters, namely {ai bi ci} and {pi qi ri}, to make the ANFIS output match the training data. When the premise parameters ai, bi and ci of the membership functions are fixed, the output of the ANFIS model can be written as:

By substituting equation (5) and fuzzy if–then rules into equation (8), it becomes:
![]()
where,  , are computed from equation (5). After rearrangement, the output can be represented as:

which is a linear combination of the modifiable consequent parameters p1, q1, r1, p2, q2 and r2. These parameters are updated in the forward pass of the learning algorithm by the least square method. Assume θ is an unknown vector whose elements are the six above parameters. Therefore, equation (10) can be represented as:
![]()
If A is an invertible matrix then:
![]()
Otherwise, a pseudoinverse is used to solve for θ as follows:
![]()
In the backward pass, the error signals are propagated and the premise parameters are updated by gradient descent.

where E is the mean square error and α is each of the premise parameters and η is the learning rate. The chain rule is used to calculate the partial derivative used to update the membership function parameters.

By following the above equation and calculating each partial derivative, premise parameters, {ai bi ci} are updated from equation (14).
SEGMENTATION AND FEATURE EXTRACTION ALGORITHMS
Image segmentation plays a crucial role in many medical imaging applications, especially in medical image classification. Because of this, proper features are extracted from a segmented image. In addition, in some works after feature extraction, an extra step is necessary to select appropriate features among a large feature set. According to Dogantekin et al's work in[4], feature selection is important for medical data mining to reduce processing time and to increase classification accuracy.
According to the experiments in which the ANFIS model is used in the classification part, different diseases such as prostate cancer, eye diseases, osteoporosis, skin cancer, brain tumor and, especially, breast cancer can be diagnosed. In addition, the severity of diseases can be determined by the use of the ANFIS classifier. In this section, according to the type of diseases, the methods of segmentation and feature extraction are described. (In experiments that used ANFIS as classifier.)
Prostate Cancer
Scheipers et al in[32] and Lorenz in[33] use neuro-fuzzy classification systems to diagnose prostate cancer in ultrasonic images. In[32] a new system for prostate diagnostics based on multi-feature tissue characterization was proposed. Diagnosis of the prostate carcinoma using multi-feature tissue characterization in combination with ultrasonic imaging allows the detection of tumor at an early stage. Accordingly, nine spectral texture, first order and morphological parameters are calculated as features and fed into two ANFIS working in parallel. In[33] differentiated areas of malign tissue in ultrasonic prostate images are classified with neuro-fuzzy classification models.
Osteoporosis
In[34,35] for diagnosing osteoporosis by using intelligence systems, the authors have developed various image processing and simulation techniques to investigate bone microarchitecture and its mechanical stiffness. Morphological, topological and mechanical bone features are evaluated using the hybrid skeleton graph analysis (HSGA) method. This method is illustrated in Figure 3.
Figure 3.
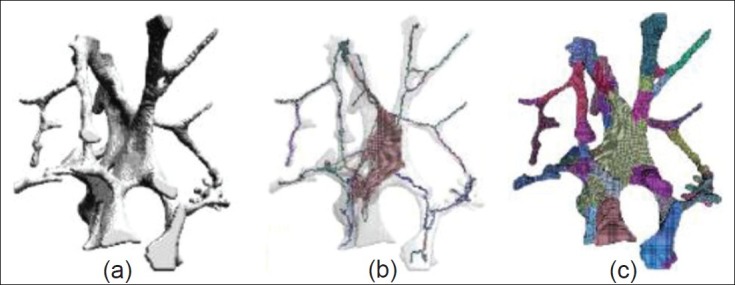
(a) Original image; (b) classied hybrid skeleton; and (c) hybrid skeleton graph analysis of the segmented model[35]
HSGA relies on a new hybrid skeletonization process that contains morphological, topological and volumetric information. Accordingly, several properties can be measured, including volume, section and thickness of each element as well as global features such as rod/plate proportion or anisotropy. The features extracted by this technique contain significant topological and morphological information. The use of the HSGA with finite element analysis allows the extraction of mechanical features, which are the input vector of classification. As will be explained in ANFIS classifier section, the ANFIS model has poor performance in comparison with support vector machines and genetic algorithm (GA) as classifier.
Skin Cancer
In[36] for skin cancer detection, before applying the ANFIS classification methodology, the feature selection step is necessary because there are a very large number of features and only few of them are relevant for predicting the label. Feature selection is the task of choosing a small set out of a given set of features that capture the relevant properties of the data. The need for feature selection arises to avoid the presence of a large number of weakly relevant and redundant features in the data set. A good choice of features is key for building compact and accurate classifiers. The feature selection part that is used in[36] is the Greedy feature flip algorithm (G-flip) for skin cancer diagnosis. G-flip is a greedy search algorithm for maximizing the evaluation function (F), where F is a set of features. The algorithm repeatedly iterates the feature set and updates the set of chosen features. After applying the G-flip algorithm, appropriate features are presented and fed into the ANFIS classifier.
Eye Diseases
In[37] for glaucoma detection using the ANFIS model, the feature extraction part consists of the following steps: at first, the measurements of the glaucoma variable (retinal nerve fiber layer thickness and optic nerve head topology) are obtained by stratus optical coherence tomography. Then, in the feature extraction part, orthogonal array is used to detect glaucoma eye from the normal one.
Another method of feature extraction that is introduced in[38] for detecting eye diseases by using intelligent systems, including ANFIS, involves four main parts: (I) Big ring area (BRA): The color at the outer surface of the cornea is not the same in all the four image classes, which are input images for classification in[38] The BRA detection consists of two circles: an inner circle Ci and an outer circle Co. The region between the Ci and Co is the BRA. (II) Small ring area (SRA): The color at the inner surface of the cornea is not the same in all the four image classes. The SRA detection consists of two circles: an inner circle Ci and an outer circle Co. The region between the Ci and Co is the SRA. (III) Homogeneity: Homogeneity measures the closeness of the distribution of elements in the gray level co-occurrence matrix (GLCM) to the GLCM diagonal values. Homogeneity between pairs of texture patches or similarity between textured images in general can be measured by a non-parametric statistical test applied to the empirical feature distribution functions of locally sampled Gabor coefficients. (IV) BW morph (BWM): After binarizing, the images become black and white. This function, BWM, is used to find the area between the edges. BWM is a function in Matlab that performs specific morphological operations on binary images. Figure 4 illustrates the BRA and SRA features and results of the BWM on normal eye image.
Figure 4.

(a) Result of the big ring area feature; (b) Result of the small ring area feature; (c) Result of the BW Morph on normal eye image[38]
In[39] the authors make use of ANFIS for automatic screening of diabetic retinopathy in fundus images. Diabetic retinopathy is one of the most significant factors contributing to blindness and, therefore, early diagnosis and timely treatment is particularly important to prevent visual loss. Diabetic retinopathy can lead to several abnormalities like microaneurysms, hemorrhages and exudates. In[39] exudate detection is investigated because it provides information about early diabetic retinopathy. Exudates manifest as hard white or yellowish localized regions with varying sizes, shapes and locations. The main cause of exudates is proteins and lipids leaking from the blood stream into the retina via damaged blood vessels. In[39] an integrated approach for extraction of blood vessels and exudate detection was proposed to screen diabetic retinopathy. An automated classifier was developed based on ANFIS to differentiate between normal and non-proliferative eyes from the quantitative assessment of monocular fundus images. Feature extraction was performed on the pre-processed fundus images. Structure of blood vessels was extracted using multiscale analysis. Hard exudates were detected using CIE color (International Commission on Illumination) channel transformation, entropy thresholding and improved connected component analysis from the fundus images. Features like wall-to-lumen ratio in blood vessels, texture, homogeneity properties and area occupied by hard exudates were given as input to ANFIS.
Another experiment that is done in the field of classification is retinal image classification.[40] According to[40] advance symptoms of systematic diseases such as diabetes may be diagnosed by the assessment of retinal and retinal blood vessels. Retinal images acquired using a fundus camera often contain low grey and low-level contrast, and are of low dynamic range. This may seriously affect the automatic segmentation stage and subsequent results; hence, it is necessary to carry out pre-processing to improve image contrast results before segmentation. They presented a new multi-scale method for retinal image contrast enhancement using contourlet transform. In[40] a combination of feature extraction approach that uses local binary pattern (LBP), morphological method and spatial image processing is proposed for segmenting the retinal blood vessels in optic fundus images.
Brain Tumor
For detecting brain tumor by ANFIS model, a similar method in feature extraction approach is used in both.[41,42] Fourier descriptors are used for precise extraction of boundary feature of the tumor region. But, these features introduce a large number of feature vectors that may cause the problem of overlearning or misclassification. Accordingly, these works are followed by GA as a feature selection step. GA develops an efficient searching algorithm to combine these features to few significant ones that are capable of representing that particular class. In[43] other kinds of features are applied for brain tumor detection. Six textural features based on GLCM have been used in[43]. GLCM {P (d, θ) (i, j)} represents the probability of occurrence of a pair of gray-levels (i, j) separated by a given distance d at an angle θ. The features such as contrast, inverse difference moment, correlation, variance, energy and entropy are used. In[44] principle component analysis (PCA) is used as a feature extraction algorithm of brain tumor classification by use of ANFIS. PCA is one of the most successful techniques that have been used in image recognition and comparison. Image in this work is brain magnetic resonance image. Figure 5 illustrates five classes of brain tumor.[44]
Figure 5.
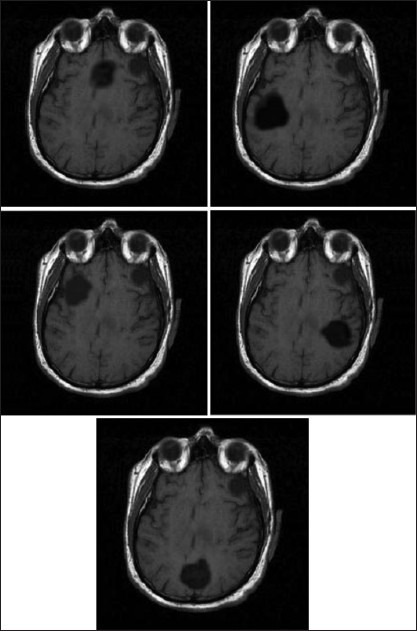
Five classes of brain tumor[44]
Breast Cancer
Breast cancer diagnosis is the most common disease that makes use of ANFIS as classifier. Different feature extraction techniques are introduced among these works. One of these methods is GA that is applied in[45,46] for searching significant input feature vectors. In[45] the authors have developed a treatment planning system implementing genetic-based neuro-fuzzy approaches for accurate analysis of shape and margin of tumor masses appearing in breast using digital mammogram. In the proposed methodology, GA has been used for searching effective input feature vectors combined with the adaptive neuro-fuzzy model for final classification of different boundaries of tumor masses. In[46] the boundary-based features of the tumor lesions appearing in the breast have been extracted for classification. The shape features represented by Fourier descriptors introduce a large number of feature vectors. Therefore, GA has been used as a feature selection step in order to select significant input feature vectors. In[47] the following steps are applied as the pre-processing part: Region of Interest (ROI) extraction, image background removal, image contrast enhancement and noise reduction. In the next step, the features that are extracted from the final image are entropy, energy and homogeneity. In[48] shape- and texture-based features have been considered.
Radius, texture, perimeter, area, smoothness, compactness, concavity, concave points, symmetry and fractal dimension of breast mass are used in[49] . BI-RADS assessment, age, shape, margin, density and severity are variables that are fed into the classifier.[50] As is explained in[50] , BI-RADS was developed by the American College of Radiologists as a comparison for rating mammograms and breast ultrasound images. In[1] , which makes use of ANFIS for automatic detection of breast cancer, the attribute descriptors are clamp thickness, uniformity of cell size, uniformity of cell shape, marginal adhesion, single epithelial cell size, bare nuclei, bland chromatin, normal nucleoli and mitoses. In[51] , three groups of features are determined. Group 1 is a 10-dimensional vector used to represent the masses, including area, average gray level intensity, contrast, coherence, compactness, elongatedness, fractal dimension, mean square deviation on the boundary, module of gradient on the boundary and entropy of gradient orientation on the boundary. Group 2 is a 10-dimension vector used to represent the MCs, including area, average gray level intensity, contrast, coherence, compactness, ratio of pits, number of holes, elongatedness, fractal dimension and clustering number. Among them, ratio of pits is the ratio of the number of pits (the concave point on the MC boundary) to the circumference and number of holes is the number of Micro Calcifications (MCs) around the current one. Group 3 is also used to represent the MCs that are regarded as a distinguished part of group 2, which involves four features: area, contrast, coherence and number of holes. In[5] , three types of methods are introduced for feature extraction. These methods are mutual correlation-based feature selection methods, gene selection criteria and the relief algorithm. Image pruning, global gray level thresholding and histogram equalization are steps of pre-processing that are used in[52] , and the feature extraction part consists of the following steps: wavelet decomposit, coefficients extraction, normalization, energy computation, coefficients reduction and, finally, feature vector. In[53] , the suspicious location of the breast masses are specified by the radiologists and then masses are accurately segmented using the fuzzy c-means clustering technique. Fourier descriptors are utilized for the extraction of shape features of mammographic masses. These shape features along with the texture features are fed to the input of the ANFIS classifier for determination of the masses as benign, lobular or malignant.
ANFIS CLASSIFIER
It seems like several considerations can affect the performance of the classification part. In general, the performance of classifier depends on several factors such as size and quality of training set, the rigor of the training imported and also parameters chosen to represent the input.[38] However, the main advantages and drawbacks of the ANFIS classifier are discussed in this section. In most experiments, the criterion that is used to show the performance of classifier is classification accuracy. Furthermore, in some works, convergence time and total error are considered.
Neuro-fuzzy systems harness the power of two methods: fuzzy logic and artificial neural network (ANN). Of course, a different type of this hybrid system exists that combines fuzzy logic and ANN. This network is known as fuzzy neural network (FNN) and, in some experiments, they are applied in the classification part. For instance, in[54] for Severe Acute Respiratory Syndrome (SARS) thermal analysis and in[55,56] for breast cancer, FNN is used as a classifier. The difference between neuro-fuzzy system and FNN is that the former is a fuzzy system that makes use of the ANN learning algorithm for updating its fuzzy parameters while the latter is basically a neural network that is benefit fuzzy rule in the network.
However, according to[44], some advantages of ANFIS are:
Refining fuzzy if–then rules to describe the behavior of a complex system
Not requiring prior human expertise that is often needed in fuzzy systems, and it may not always be available
Presenting greater choice of membership function to use
Bringing very fast convergence time
Prostate Cancer
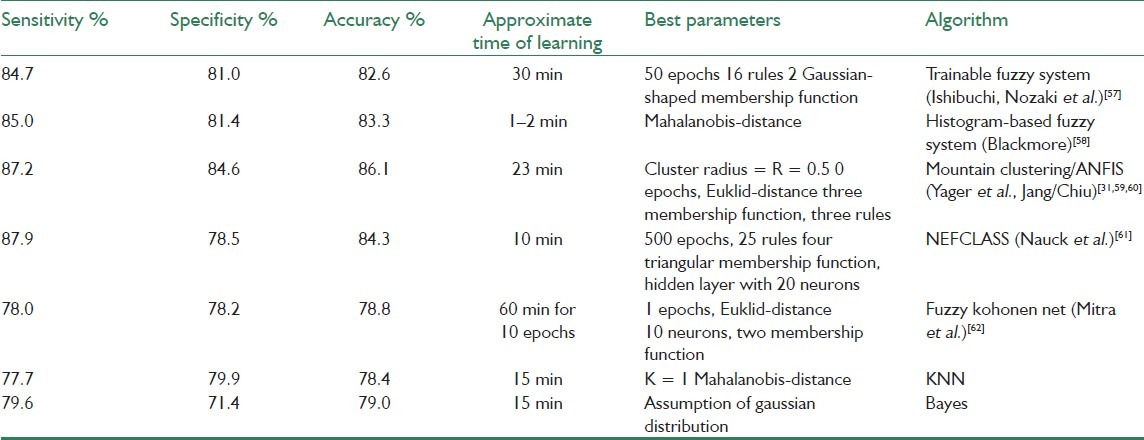
In[33] five trainable neuro-fuzzy classification algorithms are applied in order to investigate their ability to differentiate areas of malign tissue in ultrasonic prostate images. The algorithms were compared with results from two commonly used classifiers, the K-nearest neighbor (KNN) classifier and the Bayes classifier. The results obtained in[33] show that the best neuro-fuzzy classification system is based on a mountain clustering algorithm/ANFIS. The determined clusters centers, which are obtained from mountain clustering algorithm, are used to initialize an ANFIS. In this method, rates have been presented above 86% in comparison with the Bayes classifier (79%) and the KNN classifier (78%). The results suggest that neuro-fuzzy classification algorithms have the potential to significantly improve common classification methods for use in ultrasonic tissue characterization. Table 1shows the overall result of these classifiers.
Table 1.
Performance of “the implemented neuro-fuzzy classification systems on the prostate data with four parameters and two classes ‘malign’ and ‘benign’.” The learning time refers to the time per patient during the leave-one-out test with a training data set of 3000 samples and a 200 MHz Pentium PC[33]
Osteoporosis
In[34,35] ANFIS performance has been poor in identifying each of the samples due to lack of samples and many nodes, while Support Vector Machine (SVM) with linear polynomial kernel obtained a high degree of success, and the correct predictions (100% success) were obtained by the GA. In the ANFIS model, samples are not enough for accurate prediction. Therefore, satisfactory results could not be obtained, as illustrated in Figure 6.
Figure 6.
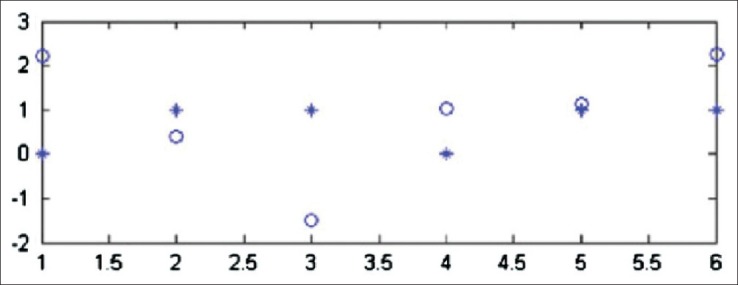
Prediction after training with adaptive neuro-fuzzy inference system; open circle is the actual value and asterisk is the predicted value[34]
Skin Cancer
In[36] before applying the methodology of the classification, the posed diagnosis problem is divided into two tasks:
Easy task: the distinction between cancerous or pre-cancerous images and psoriasis cases. This means that two classes: class 1 (cancer and pre-cancer) consists of 33 images of actinic keratosis and 34 images of basal cell carcinoma, and class 2 (psoriasis) consists of 67 images.
Difficult task: the detection of the cancer (basal cell carcinoma) within the database is composed of 50 images of actinic keratosis cases and 50 images of basal cell carcinoma. This means that there are two classes: class 1 (cancer) and class 2 (pre-cancer).
The training data set was made up of 80% of the overall data, and the other 20% of the data is considered as testing data set. Three versions of these data sets are used, where each version was randomly disordered in order to cross-validate the results. The results of classification with ANFIS are illustrated in Table 2.
Table 2.
The classification accuracy of the easy and difficult tasks with ANFIS classifier[36]

From the above table, it can be seen that using the ANFIS classification algorithms as a diagnosis system for skin cancer has a high level of efficiency performance, where it can accurately predict the testing in the easy task by approximately 100% and in the difficult task by 92%.
Eye Diseases
Figure 7 shows the Receiver Operating Characteristic (ROC) curve and Table 3 illustrates the ANFIS classification results for glaucoma detection.[37] For the training set, the area under the ROC curve from ANFIS was 0.942, with 0.889 and 0.878 sensitivities at 80% and 90% specificities. In addition, for the testing set, the area under the ROC curve from ANFIS was 0.925, with 0.867 and 0.800 sensitivities at 80% and 90% specificities [Figure 7]. The overall accuracy was 90.0% for the training set and 85.6% for the testing set [Table 3].
Figure 7.
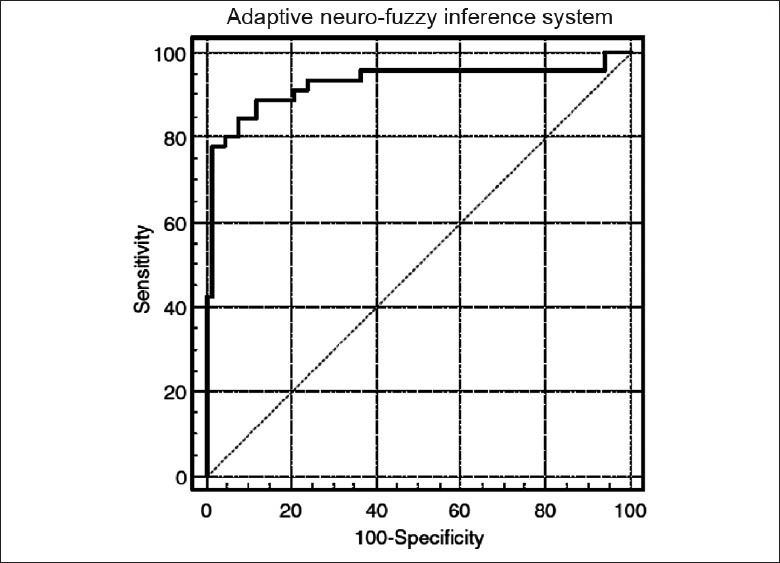
Area under the ROC curve for the adaptive neuro-fuzzy inference system was 0.925 with 0.889 and 0.882 sensitivities at 80% and 90% specificities for the testing set[37]
Table 3.
ANFIS classification results[37]

In[38] performance of three types of classifiers is discussed for diagnosing eye diseases. The result of comparison between these classifiers is presented in Table 4.
Table 4.
Results of sensitivity, specificity and positive predictive value for complete eye classes using three classifiers[38]
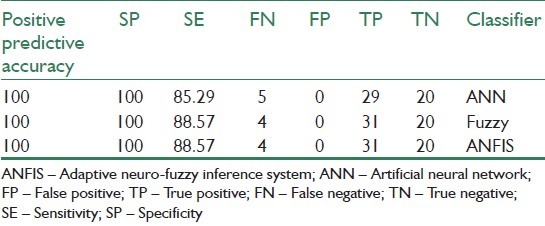
The acronyms presented in the table come from:
FP: false positive – predicts benign as malignant
TP: true positive – predicts malignant as malignant
FN: false negative – predicts malignant as benign
TN: true negative – predicts benign as begin
SE: sensitivity
SP: specificity
SE and SP are computed from the formulae given below:

where, sensitivity is the ability to correctly detect disease and specificity is the ability to avoid calling normal things as disease. Table 4 shows that the fuzzy and neuro-fuzzy classifiers are superior than the neural network classifier. They both yield correct classification of normal, cataract and iridocyclitis images for more than 90% of the cases. Their sensitivity is 88%, higher than the neural network classifier Reference[40] that discusses retinal image classification compares multilayer perceptron (MLP) classifier and ANFIS. Table 5 shows the comparison that is presented in[40] for retinal image classification, where TPR is the true positive ratio and FPR is the false positive ratio. The accuracy of the system can further be increased by increasing the size and quality of the training set. The classification results can be enhanced by extracting the proper features from the optical images. Environmental conditions like the reflection of light influences the quality of the optical images and, hence, the percentage of classification efficiency.[38]
Table 5.
Results of three criteria for comparison between two classifiers[40]

Table 5 shows that better performance is achieved with ANFIS classifier in comparison with MLP.
Brain Tumor
In[44] , which uses the PCA algorithm for the feature extraction part, a comparison between probabilistic neural network (PNN) and ANFIS is examined. Table 6 shows the result.
Table 6.
Comparison between PNN and ANFIS as classifier[44]

The result of classification in[44] belongs to one of the five classes that are illustrated in Figure 5.
Table 7 shows a comparison between three methods that are presented in[43] for detection of four types of brain tumor. Figure 8 shows these classes. Also, the mean square curve for classifiers that are used in[43] is illustrated in Figure 9. This figure shows the superior nature of ANFIS over the other classifiers in terms of training and testing error. The three classifiers are subjected to 200 iterations and the overall training and testing error curves are simulated. The error rate of fuzzy classifier and the neural classifier are high as they suffer from the drawbacks of random initial cluster center selection and requirement of large training data set, respectively.[43]
Table 7.
Overall comparison of 3 types of classifier[43]
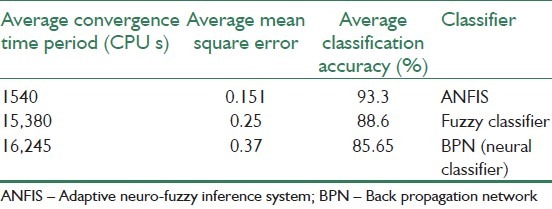
Figure 8.

(a) Metastase, (b) glioma, (c) astrocytoma and (d) menindioma[43]
Figure 9.
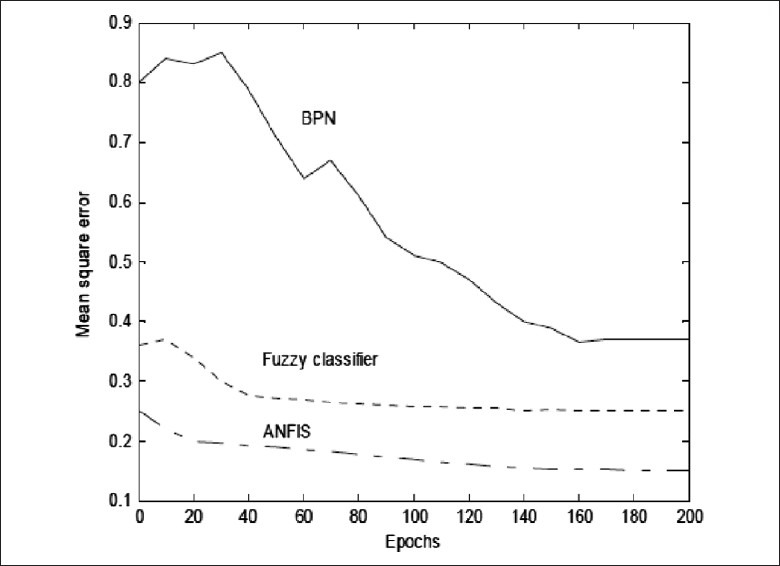
Mean square curve of the classifiers[43]
Breast Cancer
For breast cancer diagnosis, different methods are applied for the classification part. In most of the experiments, ANFIS has better performance. But, as a large data set is fed to this classifier, its performance is reduced. For instance, Table 8 shows high statistical parameters that are obtained by using the ANFIS model in breast cancer diagnosis.
Table 8.
Values of the statistical parameters[1]

However, from the experiments that are done on breast cancer, we can conclude that the ANFIS model is only successful to identify cases with low-dimension features.[51]
Other Applications
One of the most under-investigation progresses in medical image processing is chromosome analysis and classification, performed on dividing cells in their metaphase stage, which is called karyotype.[63] Table 9 shows the classification accuracy of two types of neural networks classifiers, perceptron and learning vector quantization (LVQ), and ANFIS on two versions of feature database. The Cpr is an old and raw version of the database while the CPA is a corrected one that is used in most of the recent articles.
Table 9.
The classification accuracy of different systems on two versions of feature database[63]

It can be seen that if perceptron and LVQ classifiers are applied on the old and raw version of database (Cpr) that is a unsuitable data set, the accuracy would be decreased very quickly in contast to ANFIS. It could be as a result of differences in basic definitions of membership concept in fuzzy and classic systems. Therefore, ANFIS is a significantly better choice when we are not sure about the level of correctness of the data, i.e. actually most of the real world applications.[63]
In order to clear the aim of this study, the framework of medical diagnosis by using the ANFIS model is presented in Figure 1. The main purpose of this paper can be followed by the solid line in the figure.
CONCLUSION
In this work, we have tried to review the experiments in which ANFIS is applied as classifier in the field of medical image classification. In addition, different methods are used for segmentation and feature extraction steps in which applications that ANFIS is applied as classifier are described. Although this work emphasizes on ANFIS as classifier, in addition, it can be used for other tasks like denoising or segmentation. ANFIS could be a good classifier for medical image classification and assist physicians for earlier diagnosis of different diseases. This classifier overcomes the drawbacks of fuzzy systems and neural networks by combining these two intelligent methods. However, like every method, it has some drawbacks. Large input data could reduce the accuracy of its performance. In addition, ANFIS performance decreases while input samples are not enough and, also, there are many nodes in ANFIS. In general, the performance of classifier depends on several factors such as size and quality of training set, the rigor of the training imported and also parameters chosen to feed to ANFIS as inputs can be influence the classifier performance.
BIOGRAPHIES

Monireh Sheikh Hosseini received the BS degree in Electrical Engineering (Control) from Isfahan University of Technology, Iran, in 2010. Since Fall 2010 she is graduate student studying Electrical Engineering (Control) at Isfahan University of Technology. Her research interests include soft computing (Wavelet Network, Neural Network, Fuzzy Logic), Image Processing and biomedical engineering.

Maryam Zekri (M’11) received the PhD degree in Electrical Engineering (Control) from Isfahan University of Technology, Iran, in 2008. She is currently is an assistant professor in the Department of Electrical and Computer Engineering at Isfahan University of Technology. Her PHD thesis focused on Adaptive Fuzzy Wavelet Network Control Design for Nonlinear System. Her research interests are in the area of soft computing (Wavelet Network, Neural Network, Fuzzy Logic), Intelligent Control and Automatic Diagnosis of Disease
Footnotes
Source of Support: Nil
Conflict of Interest: None declared.
REFERENCES
- 1.Übeyli ED. Adaptive neuro-fuzzy inference systems for automatic detection of breast cancer. J Med Syst. 2009;33:353–8. doi: 10.1007/s10916-008-9197-x. [DOI] [PubMed] [Google Scholar]
- 2.Abarghouei AA, Ghanizadeh A, Sinaie S, Shamsuddin SM. A Survey of Pattern Recognition Applications in Cancer Diagnosis, in International Conference of Soft Computing and Pattern Recognition. IEEE Conferences. 2009:448–53. [Google Scholar]
- 3.Übeyli ED. Automatic diagnosis of diabetes using adaptive neuro-fuzzy inference systems. J Expert Syst. 2010;27:259–66. [Google Scholar]
- 4.Dogantekin E, Dogantekin A, Avci D, Avci L. An intelligent diagnosis system for diabetes on Linear Discriminant Analysis and Adaptive Network Based Fuzzy Inference System: LDA-ANFIS. Digit Signal Process. 2010;20:1248–55. [Google Scholar]
- 5.Ghazavi SN, Liao TW. Medical data mining by fuzzy modeling with selected features. Artif Intell Med. 2008;43:195–206. doi: 10.1016/j.artmed.2008.04.004. [DOI] [PubMed] [Google Scholar]
- 6.Amer MB. An adaptive neurofuzzy technique for determination of blood acidity, Computer Methods in Biomechanics and Biomedical Engineering. United Kingdom: Taylor and Francis; 2010. pp. 685–91. [DOI] [PubMed] [Google Scholar]
- 7.Das R, Sengur A. Evaluation of ensemble methods for diagnosing of valvular heart disease. Expert Syst Appl. 2010;37:5110–5. [Google Scholar]
- 8.Avci E, Turkoglu I. An intelligent diagnosis system based on principle component analysis and ANFIS for the heart valve diseases. Expert Syst Appl. 2009;36:2873–8. [Google Scholar]
- 9.Sengur A. An expert system based on linear discriminant analysis and adaptive neuro-fuzzy inference system to diagnosis heart valve diseases. Expert Syst Appl. 2008;35:214–22. [Google Scholar]
- 10.Özkan AO, Kara S, Salli A, Sakarya ME, Günes S. Medical diagnosis of rheumatoid arthritis disease from right and left hand Ulnar artery Doppler signals using adaptive network based fuzzy inference system (ANFIS) and MUSIC method. Adv Eng Software. 2010;41:1295–301. [Google Scholar]
- 11.Subasi A. Application of adaptive neuro-fuzzy inference system for epileptic seizure detection using wavelet feature extraction. Comput Biol Med. 2007;37:227–44. doi: 10.1016/j.compbiomed.2005.12.003. [DOI] [PubMed] [Google Scholar]
- 12.Benecchi L. Neuro-Fuzzy system for prstate cancer diagnosis. Urology. 2006;68:357–61. doi: 10.1016/j.urology.2006.03.003. [DOI] [PubMed] [Google Scholar]
- 13.Wang Z. Neuro-Fuzzy Modeling for Microarray Cancer Gene Expression Data. Oxford University Computing Laboratory: Applications and Algorithms Group. 2005 [Google Scholar]
- 14.Akdemir B, Kara S, Polat K, Güven A, Günes S. Ensemble adaptive network-based fuzzy inference system with weighted arithmetical mean and application to diagnosis of optic nerve disease from visual-evoked potential signals. Artif Intell Med. 2008;43:141–9. doi: 10.1016/j.artmed.2008.03.007. [DOI] [PubMed] [Google Scholar]
- 15.Übeyli ED. New York City, USA: 2006. Adaptive Neuro-Fuzzy Inference System For Analysis of Doppler Signals, in EMBS Annual International Conference. [DOI] [PubMed] [Google Scholar]
- 16.Übeyli ED, I Güler I. Adaptive neuro-fuzzy inference systems for analysis of internal carotid arterial Doppler signals. Comput Biol Med. 2005;35:687–702. doi: 10.1016/j.compbiomed.2004.05.004. [DOI] [PubMed] [Google Scholar]
- 17.Übeyli ED. Automatic detection of electroencephalographic changes using adaptive neuro-fuzzy inference system employing Lyapunov exponents. Expert Syst Appl. 2009;36:9031–8. [Google Scholar]
- 18.Yazdani AA, Ataee P, Setarehdan SK, Araabi BN, Lucas C. Neural, Fuzzy And Neurofuzzy Approach To Classification Of Normal And Alcoholic Electroencephalograms, in Image and Signal Processing and Analysis, 2007. ISPA 2007. 5th International Symposium on. Istanbul. 2007:102–6. [Google Scholar]
- 19.Übeyli ED. Adaptive neuro-fuzzy inference system employing wavelet coefficients for detection of ophthalmic arterial disorders. J Med Syst. 2008;34:2201–9. [Google Scholar]
- 20.Choubey A, Sinha GR, Choubey S. A Hybrid Filtering Technique in Medical Image Denoising: Blending of Neural Network and Fuzzy Inference, in 3rd International Conference on Electronics Computer Technology (ICECT): Kanyakumari. 2011;1:170–7. [Google Scholar]
- 21.Alamelumangai N, DeviShree J. An Ultrasound Image Preprocessing System Using Memetic ANFIS Method, in 2010 International Conference on Biology, Environment and Chemistry. Vol. 1. Singapore: IACSIT Press; 2011. pp. 214–7. [Google Scholar]
- 22.Yüksel EM. A median/ANFIS filter for efficient restoration ofdigital images corrupted by impulse noise. Int J Electron Commun. 2006;60:628–37. [Google Scholar]
- 23.Weidong X, Lihua L, Ping X. A New ANN-based Detection Algorithm of the Masses in Digital Mammograms, in Integration Technology, 2007. ICIT ‘07. IEEE International Conference on Integration Technology. 2007:26–30. [Google Scholar]
- 24.Weidong X, Lihua L, Shaofang Z. Detection and Classification of Microcalcifications Based on DWT and ANFIS, in Bioinformatics and Biomedical Engineering, 2007. ICBBE 2007. The 1st International Conference on Bioinformatics and Biomedical. 2007:547–50. [Google Scholar]
- 25.Weidong XU, Wei LI, Lihua LI, Li MA, Shunren XI, Juan Z, et al. A New Computer-aided Detection System of CR Mammograms. J Comput Inf Syst. 2010;6:2885–900. [Google Scholar]
- 26.Tamilselvi PR, Thangaraj P. An Efficient Segmentation of Calculi from US Renal Calculi Images Using ANFIS System. Eur J Sci Res. 2011;55:323–33. [Google Scholar]
- 27.Khalid NE, Ibrahim S, Manaf M. Brain Abnormalities Segmentation Performances Contrasting: Adaptive Network-Based Fuzzy Inference System (ANFIS) vs K-Nearest Neighbors (k-NN) vs Fuzzy c-Means (FCM), Proceedings of the 15th WSEAS international conference on Computers. 2011:285–90. [Google Scholar]
- 28.Ibrahim S, Khalid NE, Manaf M. Image Mosaicing for Evaluation of MRI Brain Tissue Abnormalities Segmentation Study. Int J Biol Biomed Eng. 2011;5:181–9. [Google Scholar]
- 29.Ibrahim S, Khalid NE, Manaf M. Seed-Based Region Growing (SBRG) vs Adaptive Network-Based Inference System (ANFIS) vs Fuzzy c-Means (FCM): Brain Abnormalities Segmentation. World Acad Sci Eng Technol. 2010;68:425–35. [Google Scholar]
- 30.Noor NM, Khalid NE, Hassan R, Ibrahim S, Yassin IM. Adaptive Neuro-Fuzzy Inference System for brain abnormality segmentation, Control and System Graduate Research Colloquium (ICSGRC) IEEE. 2010:68–70. [Google Scholar]
- 31.Jang JS. ANFIS: Adaptive-Network-Based Fuzzy. IEEE Trans Neural Netw. 1992;3(889):98. [Google Scholar]
- 32.Scheipers U, Ermert H, Sommerfeld HJ, Garcia-Schürmann M, Senge T, Philippou S. Ultrasonic multifeature tissue characterization for prostate diagnostics. Ultrasound Med Biol. 2003;29:1137–49. doi: 10.1016/s0301-5629(03)00062-0. [DOI] [PubMed] [Google Scholar]
- 33.Lorenz A, Blum M, Ermert H, Senge T. Comparison of Different Neuro-Fuzzy Classification Systems for the Detection of Prostate Cancer in Ultrasonic Images. Ultrasonics Symposium, 1997. Proceedings. IEEE. 1997;2:1201–4. [Google Scholar]
- 34.Akgundogdu A, Jennane R, Aufort G, Benhamou CL, Ucan ON. 3D image analysis and artificial intelligence for bone disease classification. J Med Syst. 2010;34:815–28. doi: 10.1007/s10916-009-9296-3. [DOI] [PubMed] [Google Scholar]
- 35.Jennane R, Almhdie-Imjabber A, Hambli R, Ucan ON, Benhamou CL. Genetic Algorithm and Image Processing for Osteoporosis Diagnosis, in Engineering in Medicine and Biology Society (EMBC), Buenos Aires: Annual International Conference of the IEEE. 2010:5597–600. doi: 10.1109/IEMBS.2010.5626804. [DOI] [PubMed] [Google Scholar]
- 36.Odeh SM. Using an Adaptive Neuro-Fuzzy Inference System (ANFIS) Algorithm for Automatic Diagnosis of Skin Cancer, in European, Mediterranean and Middle Eastern Conference on Information Systems. 2010 [Google Scholar]
- 37.Huang ML, Chen HY, Huang JJ. Glaucoma detection using adaptive neuro-fuzzy inference system. Expert Syst Appl. 2007;32:458–68. [Google Scholar]
- 38.Acharya UR, Kannathal N, Ng EY, Min LC, Suri JS. Computer Based Classification of Eye Diseases, in Engineering in Medicine and Biology Society, 2006. EMBS ‘06. New York, NY: th Annual International Conference of the IEEE; 2006. pp. 6121–4. [DOI] [PubMed] [Google Scholar]
- 39.Kavitha S, Duraiswamy K. Adaptive Neuro-Fuzzy Inference System Approach for the Automatic Screening of Diabetic Retinopathy in Fundus Images. J Comput Sci. 2011;7:1020–6. [Google Scholar]
- 40.Rezatofighi SH, Roodaki A, Ahmadi Noubari H. EMBS 2008. Vancouver, BC: 30th Annual International Conference of the IEEE; 2008. An Enhanced Segmentation of Blood Vessels in Retinal Images Using Contourlet, in Engineering in Medicine and Biology Society, 2008; pp. 3530–3. [DOI] [PubMed] [Google Scholar]
- 41.Bhattacharya M, Das A. Genetic Algorithm Based Feature Selection In a Recognition Scheme Using Adaptive Neuro Fuzzy Techniques. Int J Comput Commun Control. 2010;5:458–68. [Google Scholar]
- 42.Das A, Bhattacharya M. A Study on Prognosis of Brain Tumors Using Fuzzy Logic And Genetic Algorithm Based Techniques, in 2009 International Joint Conference on Bioinformatics, Systems Biology and Intelligent Computing. 2009:348–51. [Google Scholar]
- 43.Hemanth DJ, Vijila CK, Anitha J. Application of Neuro-Fuzzy Model for MR Brain Tumor Image Classification. Int J Biomed Imaging. 2009;16:95–102. [Google Scholar]
- 44.Basri M. Medical Image Classification and Symptoms Detection Using Neuro Fuzzy, in Electrical-Mechatronics and Automatic Control. Teknologi Malaysia: 2008. [Google Scholar]
- 45.Das A, Bhattacharya M. Computerized decision support system for mass identification in breast using digital mammogram: A study on GAbased neuro-fuzzy approaches. Adv Exp Med Biol. 2011;696:523–33. doi: 10.1007/978-1-4419-7046-6_53. [DOI] [PubMed] [Google Scholar]
- 46.Das A, Bhattacharya M. GA Based Neuro Fuzzy Techniques for Breast Cancer Identification, in International Machine Vision and Image Processing Conference. 2008:136–41. [Google Scholar]
- 47.Fernandes FC, Brasil LM, Lamas JM, Guadagnin R. Breast Cancer Image Assessment Using an Adaptative Network-Based Fuzzy Inference System. Pattern Recognit. 2010;20:192–200. [Google Scholar]
- 48.Das A, Bhattacharya M. Identification of microcalcifications and grading of masses using digital mammogram. Int J Med Eng Inform. 2010;2:122–38. [Google Scholar]
- 49.Al-Daoud E. Cancer Diagnosis Using Modified Fuzzy Network. Univers J Comput Sci Eng Technol. 2010;1:73–8. [Google Scholar]
- 50.Huang ML, Hung YH, Lee WM, Li RK, Wang TH. Usage of Case-Based Reasoning, Neural Network and Adaptive Neuro-Fuzzy Inference System Classification Techniques in Breast Cancer Dataset Classification Diagnosis. J Med Syst. 2010;36:407–14. doi: 10.1007/s10916-010-9485-0. [DOI] [PubMed] [Google Scholar]
- 51.Weidong X, Wei L, Lihua L, Guoliang S, Juan Z. Identification of Masses and Microcalcifications in the Mammograms Based on Three Neural Networks: Comparison and Discussion in The 2nd International Conference on Bioinformatics and Biomedical Engineering: Shanghai. 2008:2299–302. [Google Scholar]
- 52.Mousa R, Munib Q, Moussa A. Breast cancer diagnosis system based on wavelet analysis and fuzzy-neural. Expert Syst Appl: An Int J. 2005;28:713–23. [Google Scholar]
- 53.Bhattacharya M, Das A. Soft Computing Based Decision Making Approach for Tumor Mass Identification in Mammogram. Int J Bioinform Res Appl. 2009;1:37–46. [Google Scholar]
- 54.Quek C, Irawan W, Ng EY. A novel brain-inspired neural cognitive approach to SARS thermal image analysis. Expert Syst Appl. 2010;37:3040–54. [Google Scholar]
- 55.Moayedi F, Boostani R, Azimifar Z, Katebi S. A Suppotr Vector Based Fuzzy Neural Network Approach for Mass Classification in Mammography, in Digital Signal Processing, 2007 15th International Conference on Digital Signal Processing: Cardiff. 2007:240–3. [Google Scholar]
- 56.Cheng HD, Muyi C. Mass lesion detection with a fuzzy neural network. Pattern Recognit. 2004;37:1189–200. [Google Scholar]
- 57.Ishibuchi H, Nozaki K, Tanaka H. Distributed representation of Fuzzy rules and its application to pattern classification. Fuzzy Sets Syst. 1992;52:21–32. [Google Scholar]
- 58.Blackmore S. Intelligent sensing and self-organizing Fuzzy-Logic techniques used in agricultural automation, in AsadCsae Meeting Presentation. Silsoe College, Cranfield University. 1994 [Google Scholar]
- 59.Yager RR, Filev DP. Generation of Fuzzy rules by Mountain-Clusterin. J Intell Fuzzy Syst. 1994;2:209–19. [Google Scholar]
- 60.Chiu SL. Fuzzy Model Identification based on cluster estimation. J Intell Fuzzy Syst. 1994;2:267–78. [Google Scholar]
- 61.Nauck D, Rudolf K. {NEFCLASS }- A Neuro-Fuzzy approach for the classification of data, Proceedings of the 1995 ACM Symposium on Applied Computing. Nashville, USA. 1995:461–5. [Google Scholar]
- 62.Mitra S, Pal SK. Self-organizing neural network as a Fuzzy classifier. IEEE Trans Syst Man Cybern. 1994;24:385–99. [Google Scholar]
- 63.Akbari MA, Nakajima M. A Neuro- Fuzzy Classifier for Karyotyping Unrefined Chromosome Data. IEIC Technical Report (Institute of Electronics, Information and Communication Engineers) 2005;104:107–10. [Google Scholar]


