

Abstract
Malaria has been a heavy social and health burden in the remote and poor areas in southern China. Analyses of malaria epidemic patterns can uncover important features of malaria transmission. This study identified spatial clusters, seasonal patterns, and geographic variations of malaria deaths at a county level in Yunnan, China, during 1991–2010. A discrete Poisson model was used to identify purely spatial clusters of malaria deaths. Logistic regression analysis was performed to detect changes in geographic patterns. The results show that malaria mortality had declined in Yunnan over the study period and the most likely spatial clusters (relative risk [RR] = 23.03–32.06, P < 0.001) of malaria deaths were identified in western Yunnan along the China–Myanmar border. The highest risk of malaria deaths occurred in autumn (RR = 58.91, P < 0.001) and summer (RR = 31.91, P < 0.001). The results suggested that the geographic distribution of malaria deaths was significantly changed with longitude, which indicated there was decreased mortality of malaria in eastern areas over the last two decades, although there was no significant change in latitude during the same period. Public health interventions should target populations in western Yunnan along border areas, especially focusing on floating populations crossing international borders.
Introduction
Malaria is associated with morbidity, mortality, and economic burden and is responsible for the deaths of nearly 800,000 people each year globally.1 Malaria burden is a significant public health threat in both highly endemic countries and those with moderate and low transmission.2 In China, malaria remains a major public health problem,3,4 especially in the southern part of the mainland.5 Yunnan Province is located in southern China and suffers from one of the highest malaria morbidity and mortality in China.4 Malaria outbreaks often occur in Yunnan Province,6 with more than 80% of the population in this province at risk of malaria infection.7 Malaria historical records showed that Yunnan Province had the highest number of malaria deaths across the country, and its accumulative malaria deaths account for more than two-thirds of those in the whole of China.6 A better understanding of the spatial pattern of malaria deaths would help to identify high risk locations and may better support malaria control interventions and resource allocation in this endemic region, in particular by providing a baseline spatial distribution of malaria deaths for the national malaria elimination program (NMEP) in China between 2010 and 2020.
The spatial pattern of malaria is complex because the spatial distribution of the disease is determined by a variety of social, biological, environmental, and cultural factors.8–11 Understanding the spatial distribution of malaria risk can uncover important information about disease transmission.12 Geographic information systems (GIS) are a supportive tool to display the spatial variation of disease,13 to define the distribution,14,15 seasonality,16,17 and mortality,18 and to identify high risk locations of malaria transmission.19–21 Recently, the spatial scan statistic method has been increasingly used to test whether any clusters can be detected or if the point process is purely randomly distributed.22 This scan statistic approach has been widely applied in identifying clustering regions and periods in vector-borne diseases like West Nile virus,23 schistosomiasis,24 dengue fever,25 Barmah Forest virus,26 and malaria.5,14,27,28 However, little is known about the spatial pattern of malaria deaths. This study investigated the spatial distribution of reported malaria deaths in Yunnan, China, using GIS integrated with spatial analysis approaches. The purposes of this study are three-fold: 1) to determine if malaria deaths were clustered at a county level, 2) to visualize the geographic distribution and seasonal patterns of malaria risk and identify the most likely clusters, and 3) to examine whether the spatial pattern of malaria deaths had changed in Yunnan Province over the last two decades (1991–2010).
Methods
Study area.
Yunnan Province borders Myanmar in the west and Laos and Vietnam in the south with a 4,060 km border (Figure 1). It covers an area of 394,000 km2 and has a population of 45.9 million as measured in the 2010 census. The province includes 16 prefectures, 128 counties, and over 1,500 townships. Yunnan receives ∼1,100 mm of annual rainfall, which occurs mostly between May and October. The seasonal mean temperatures vary from 10 to 15°C, and day temperatures range from 12 to 20°C. The elevation is highly variable, from < 100 m (Hekou county) to over 6,000 m (Deqin county). The complex geographic, ecological, and climatic conditions provide multiple favorable mosquito habitats. Five confirmed anopheles species (Anopheles minimus, Anopheles sinensis, Anopheles anthropophagus, Anopheles kunmingensis, and Anopheles jeyporiensis) exist and are widely distributed throughout Yunnan Province.29,30
Figure 1.

Location of Yunnan Province in China.
Data collection.
Malaria is a notifiable infectious disease in China, and cases are identified according to the unified diagnostic criteria issued by the Chinese Ministry of Health. The case of malaria is confirmed by microscope and/or rapid diagnostic test. Patients who are diagnosed with malaria and subsequently died of this disease are recorded as a malaria death.31 Data on malaria deaths were obtained from the Yunnan Center for Disease Control and Prevention (Yunnan CDC), where routine surveillance is undertaken for all notifiable infectious diseases assessed by the National Notifiable Diseases Surveillance System (NNDSS). The malaria deaths were classified according to the International Classification of Diseases, ninth version (ICD-9) (ICD-9: 084). In NNDSS, malaria information includes cases and deaths, and has been accessible on the NNDSS website since 2005. This surveillance system covers health facilities at a township level. Surveillance data are regularly reported to China CDC classified by county, prefectural, provincial, and national level. This study included 128 counties. Demographic data at the county level were obtained from the annual book of the Yunnan Bureau of Statistics. Although malaria deaths observed in Yunnan including Plasmodium vivax and Plasmodium falciparum, the dataset we obtained did not separate different parasites. In the current study, malaria deaths were assembled by season (spring, summer, autumn, and winter), between January 2001 and December 2010, and by the year between 1991 and 2010. Malaria mortality is expressed as the number of deaths caused by malaria per 100,000 population per year for each county between 1991 and 2010.
Data management and geocoding.
Data on malaria deaths in each county were coded using the county's name and code, and linked to the corresponding polygon on a digital boundary map of Yunnan Province in ArcGIS 9.3 (ESRI Inc., Redlands, CA). The dataset included 528 deaths over a 20-year period. Among these, 506 (96%) deaths were successfully geocoded. The remaining 22 (4%) deaths could not be geocoded, mainly because of the changes in the counties' administrative boundaries. For example, Wanding county was combined with Ruili county in 1999; and Lijiang county was divided into Gucheng county and Yulong county in 2004. We kept the old administrative boundaries of the county map for the dataset by splitting the combined county and/or combining the divided counties. The data on disease and population were geocoded and matched with the boundary map over a 20-year period (1991–2010). The latitude and longitude of the capital location of each county were considered using a geographic coordinates file. All records were assigned to county capital coordinates. Case files, population files, and coordinate files were generated in text format as source files for spatial analysis. The results of the SaTScan software (version 9.1, Martin Kulldorff, Boston, MA) were linked to the boundary map using county codes for mapping purposes in the ArcGIS software.
Data analysis.
We divided the dataset into four groups, each consisting of a 5-year period for ease of analysis. Period 1: 1991–1995; Period 2: 1996–2000; Period 3: 2001–2005; and Period 4: 2006–2010. For the purpose of seasonal analysis, we grouped the dataset into spring (March–May), summer (June–August), autumn (September–November), and winter (December–February) for the period 2001–2010.
Spatial cluster analysis.
Spatial cluster analysis was performed to detect spatial clusters or high risk locations for malaria for four periods (1991–2010) and four seasons (2001–2010) using SaTScan software. The “purely spatial analysis” was applied to test whether malaria mortality was distributed randomly over space, and if not, to evaluate the statistical significance of malaria clusters. A likelihood ratio test was calculated to determine clusters by testing whether there was an equal risk within and outside a particular area. The statistical significance of clusters was explored by means of 9,999 Monte Carlo replications with P values < 0.01. In the data analysis, a discrete Poisson model was used, as it was assumed that the number of malaria deaths in each county was Poisson distributed. Cluster analysis was performed with the maximum spatial cluster size of 50% and 25% of the population at risk in the spatial window, respectively. The maximum spatial cluster size of 50% of the population at risk was applied to avoid pre-selection bias as described in the SaTScan User Guide (version 9.0). The outcomes of cluster relative risk (RR) for purely spatial cluster analysis were input and linked in the ArcGIS software for visualization.
Dynamic dispersion of malaria mortality.
To identify whether the pattern of malaria mortality had changed and whether these changes varied with latitude and longitude of county in the four periods (1991–2010), logistic regression models were applied with the dichotomous variable defined as whether an increase of malaria deaths occurred in each county between these four periods. A county with an increase of malaria deaths was assigned to “1” and a decrease (or no change) of deaths assigned to “0” between any two time periods. The latitude and longitude of the counties' capitals were included as predictor variables. Odds ratios (ORs) were calculated, representing the change in odds of malaria mortality between two periods caused by a 1 unit increase in x (longitude or latitude). That is32
 |
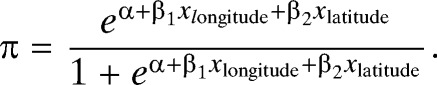 |
1) If OR = 1, the odds and probability are the same at all latitudes and longitudes, which means no changes in malaria mortality between two periods by increasing longitude or latitude. 2) If OR > 1, the odds and probability increase as longitude or latitude increases, which means increasing of malaria mortality between two periods by increasing longitude or latitude. 3) If OR < 1, the odds and probability decrease as longitude or latitude increases, which means decreasing of malaria mortality between two periods by increasing longitude or latitude. All these analyses were conducted using SPSS (PASW Statistics, version 18, Chicago, IL).
Results
Descriptive analysis.
Five hundred and six (506) malaria deaths were used in the analysis over the 20-year period (1991–2010) in Yunnan Province. Table 1 shows the summary statistics for malaria deaths at the county level for the four periods. Malaria deaths decreased from 157 in the period of 1991–1995 to 49 in 2006–2010. The highest number of deaths was reported from the same location—Yingjiang County (in western Yunnan) in all four periods. Figure 2 shows the temporal pattern of annual malaria mortality and incidence rates. There was a clear downward trend for both malaria mortality and incidence rates in Yunnan between 1991 and 2010. The highest malaria mortality was 0.12/100,000 people in 1999, and the lowest was 0.01/100,000 people in 2009.
Table 1.
Descriptive statistics of malaria deaths at a county level in Yunnan Province (N = 506)*
| Period | Total deaths | Mean | SD | Minimum | Maximum |
|---|---|---|---|---|---|
| 1991–1995 | 157 | 0.25 | 0.974 | 0 | 12 |
| 1996–2000 | 146 | 0.23 | 1.049 | 0 | 18 |
| 2001–2005 | 154 | 0.25 | 0.818 | 0 | 5 |
| 2006–2010 | 49 | 0.08 | 0.407 | 0 | 6 |
Mean, SD; Minimum and Maximum are for per year and per county.
Figure 2.

The epidemic patterns of annual malaria mortality and incidences in Yunnan, 1991–2010.
Figure 3 indicates the seasonal distribution of malaria deaths in two periods (2001–2005 and 2006–2010) with a peak in summer (March to May). There was a clear declining trend over the period of 2001–2010.
Figure 3.

Boxplots of the seasonal distribution of malaria deaths during 2001–2010, Yunnan, China The boxplot displays the values of the 25th, 50th, and 75th percentiles.
Figure 4 shows temporal changes of geographic distribution of malaria mortality in Yunnan Province in the four periods. The temporal pattern indicates the highest malaria mortality (above 1/100,000) occurred in four counties and did not change in the western (3 counties) and north-western (1 county) parts of Yunnan for period 1, period 2, and period 3, respectively; however, in period 4 mortality was < 1/100,000 in all counties. Malaria mortality ranged from 0.1 to 1.0/100,000 in 25 counties in period 1 and continued to decrease to 20, 18, and then 13 counties in the subsequent three periods. Malaria mortality under 0.1/100,000 varied between 8 and 15 counties within the 20-year period. There were no malaria deaths in the majority of the counties over the last two decades.
Figure 4.

Choropleth maps showing changes of malaria mortality in Yunnan Province in four periods. (The number in the parentheses denotes how many counties in each category. Red color: malaria mortality above 1/100,000; Light red: malaria mortality ranged from 0.1 to 1/100,000; Pink: malaria mortality under 0.1/100,000; White: counties without malaria deaths.).
Purely spatial analysis.
SaTScan statistics identified purely spatial clusters of malaria deaths. Figure 5 shows the statistically significant spatial clusters and geographic distribution of the raw dot density of malaria deaths in the four periods. These four maps reveal that overlay regions of both spatial clusters and dot density are consistent. A most likely cluster was identified in the western part of Yunnan in the four periods. A secondary cluster was identified only significantly in period 1 (1991–1995).
Figure 5.

Purely spatial clusters and raw dot density map of malaria deaths in Yunnan, 1991–2010 (1 dot = 1 malaria death). (Red color: primary cluster of malaria deaths; Pink: secondary cluster; Light yellow: counties without malaria deaths cluster.).
Table 2 shows the results of purely spatial analysis detected in Yunnan in the four periods (1991–2010). The results for the total population, radius of cluster, number of counties, and malaria deaths in cluster, log likelihood ratio, and relative risk were very similar using either 50% or 25% of the population at risk as the maximum cluster size. The results for the maximum spatial cluster size of 50% of the population were applied and reported in Table 2. In period 1, a most likely cluster encompassed 8 counties (RR = 24.41, P < 0.001) and a secondary cluster included 22 counties (RR = 2.33, P < 0.01), which were observed in the western and southern parts of Yunnan, respectively. In a total of 157 deaths, 127 were detected in cluster regions. For the other three periods, a most likely cluster was observed (RR = 30.83, P < 0.001 for period 2; RR = 32.06, P < 0.001 for period 3; RR = 23.03, P < 0.001 for period 4) with death numbers of 93, 126, and 32 in the cluster region for period 2, 3, and 4, respectively.
Table 2.
Spatial clusters of malaria deaths in Yunnan Province, China, 2001–2010
| Year | SaTScan statistics | Population | Radius of cluster (Km) | No. of counties in cluster | No. of cluster malaria deaths | Relative risk | P value |
|---|---|---|---|---|---|---|---|
| 1991–1995 | Most likely cluster | 1,932,528 | 76.2 | 8 | 87 | 24.41 | < 0.001 |
| Secondary cluster | 5,099,408 | 265.5 | 22 | 40 | 2.33 | < 0.01 | |
| 1996–2000 | Most likely cluster | 2,173,340 | 107.5 | 9 | 93 | 30.83 | < 0.001 |
| 2001–2005 | Most likely cluster | 5,487,146 | 223.4 | 18 | 126 | 32.06 | < 0.001 |
| 2006–2010 | Most likely cluster | 3,641,948 | 127.1 | 11 | 32 | 23.03 | < 0.001 |
Table 3 displays the spatial clusters of malaria deaths by season between 2001 and 2010. This table indicates that autumn (June to August) had the highest relative risk (RR = 58.91, P < 0.001), followed by summer (RR = 31.91, P < 0.001). Spring (March to May) and winter (December to February), had similar relative risks to each other (RR = 24.07, P < 0.001). Seasonal clustering counties ranged from 8 to 10 and the radius of the cluster is < 100 km. For all seasons, the geographic location of the most likely cluster is identified in the western part of Yunnan along the China–Myanmar border (Figure 6).
Table 3.
Most likely spatial clusters of malaria deaths by season in Yunnan Province, China, 2001–2010
| Seasons | Population | Radius of cluster (Km) | No. of counties in cluster | No. of cluster malaria deaths | Relative risk | P value |
|---|---|---|---|---|---|---|
| Spring | 3,419,395 | 98.87 | 10 | 23 | 24.07 | < 0.001 |
| Summer | 2,223,180 | 76.24 | 8 | 45 | 31.91 | < 0.001 |
| Autumn | 1,766,337 | 94.88 | 8 | 42 | 58.91 | < 0.001 |
| Winter | 3,419,395 | 98.87 | 10 | 23 | 24.07 | < 0.001 |
Figure 6.

Seasonal clusters of malaria mortality in Yunnan, 2001–2010.
Changes in the spatial-temporal pattern of malaria deaths.
Table 4 indicates that changes of malaria mortality for each county were significantly associated with longitude between the periods 1991–1995 and 1996–2000 (OR = 0.743; 95% confidence interval [CI] = 0.585–0.943), the periods 1991–1995 and 2001–2005 (OR = 0.617; 95% CI = 0.464–0.820), and the periods 1996–2000 and 2001–2005 (OR = 0.639; 95% CI = 0.489–0.833). These results suggested that the geographic distribution of malaria deaths was significantly reduced by longitude, which indicated a decreasing trend in mortality in an easterly direction across the province for the last two decades. However, no significant spatial changes by latitude were observed in the study, which indicates that the geographic range of malaria transmission may have not changed significantly with latitude.
Table 4.
Changes of malaria mortality for a 1° increase in longitude and latitude, Yunnan Province, China, 1991–2010
| Time intervals | Longitude | Latitude | ||||
|---|---|---|---|---|---|---|
| OR | 95% CI | P value | OR | 95% CI | P value | |
| Period 1–Period 2 | 0.743 | 0.585–0.943 | 0.015* | 0.879 | 0.649–1.192 | 0.407 |
| Period 1–Period 3 | 0.617 | 0.464–0.820 | 0.001** | 0.861 | 0.613–1.207 | 0.385 |
| Period 1–Period 4 | 0.869 | 0.603–1.251 | 0.449 | 1.061 | 0.667–1.689 | 0.803 |
| Period 2–Period 3 | 0.639 | 0.489–0.833 | 0.001** | 0.799 | 0.576–1.108 | 0.178 |
| Period 2–Period 4 | 1.023 | 0.736–1.424 | 0.891 | 1.017 | 0.674–1.536 | 0.935 |
| Period 3–Period 4 | 1.309 | 0.788–2.175 | 0.299 | 1.229 | 0.719–2.100 | 0.451 |
OR = odds ratio; CI = confidence interval; *P < 0.05; **P < 0.01; Separate odds ratios reported for different intervals defined by the four periods. Period 1 = 1991–1995; Period 2 = 1996–2000; Period 3 = 2001–2005; Period 4 = 2006–2010.
Seasonal clusters of malaria mortality were identified in 11 counties in western Yunnan (Figure 6). The temporal malaria mortality of these 11 high risk counties and Yunnan province ranged from 0.06–1.23/100,000 to 0.01–0.12/100,000 during 1991–2010, respectively (Figure 7). Malaria mortality of 11 cluster counties was 5–12 times higher than that of Yunnan province over a 20-year period.
Figure 7.

Mortality of Yunnan province and 11 cluster counties of western Yunnan.
Discussion
Malaria mortality has continued to decline over the past two decades in Yunnan, China, with the majority of malaria deaths concentrated in western Yunnan. Of importance, high risk locations were identified in the western part of Yunnan, which shares an international border of 1,997 km with Myanmar. The findings imply that malaria remains a serious health threat in this “hotspot” region. We also found that the highest risk occurred in autumn and summer. This temporal pattern could be related to the rainy season between May and October in Yunnan Province.33,34 Focused interventions in these months should be more effective in the prevention and control of malaria in Yunnan.
The GIS-based spatial statistical techniques have not been previously applied to analyze high risk clustering in malaria deaths in China. As an epidemic area, Yunnan has a greater number of malaria deaths than any other province in China. In 1995 and 1998, all malaria deaths in China were reported from Yunnan. The results of this study may have several important implications for malaria control policy in China.
First, the primary spatial cluster identified in this study is concentrated in the China–Myanmar border area, which has the longest border (1997 km), the highest annual parasite incidence rate (API, > 2.3%), and the highest proportion of P. falciparum reported in positive blood smears (33%)29 compared with the China–Vietnam and China–Laos border areas. Furthermore, all primary spatial clusters examined in the four periods had no significant geographic changes, which suggest that the primary cluster existed in this border area for two decades. Targeted public health interventions should therefore be focused on this area. It is estimated that there is a floating population of more than 10 million in the border area of Yunnan, and over 6.5 million of them (4 million entries by foreigners and 2.5 million re-entries by Chinese nationals) crossed the international border between China–Myanmar, China–Vietnam, and China–Laos each year and this number keeps growing.7,34 The migration of people (e.g., refugees and returning workers) from Myanmar has led to a significant number of imported malaria cases and deaths, and resulted in frequent malaria outbreaks in Yunnan.7,29 It also has an implication that the identified cluster area could be the dominating source of P. falciparum imported into other provinces in mainland China. For example, in 2005 the reported number of P. falciparum in Yunnan accounted for 84% of the total P. falciparum cases in China (3,497 of 4,146) and 69% (2,413 of 3,497) of these were imported from neighboring countries along the Yunnan border.35 In 2009, among 23 provinces reporting malaria cases in mainland China, 21 of them reported that all malaria deaths were identified as imported cases.36 The number of imported P. falciparum cases in 2010 increased by over 100% in some inland provinces, such as Jiangsu, Anhui, and Sichuan.37
Both P. falciparum and P. vivax are prevalent in Yunnan. There was an average decrease in malaria incidence of 4.3% for P. falciparum and 5.2% for P. vivax per year during 1991–2006 in this province.3,4 Plasmodium vivax is the dominant species in Yunnan.35 The incidences of P. vivax cases were 3–5 times higher than those of P. falciparum between 1995 and 2005.3,4 A further examination of the cluster pattern of malaria deaths caused by different parasites might provide more detailed information to support policy development for malaria intervention in Yunnan province.
Second, the results reveal that the total number of malaria deaths has been gradually decreasing, but there have been no large changes in the locations of the primary cluster over the four periods (RR: 23.02–32.06, P < 0.001) (Table 2). This is despite the fact that increased activity through the national program for malaria control has taken place in this region for decades. The high antimalarial drug resistance in western Yunnan could be one of the key reasons for this persistent cluster. The majority of the population with chloroquine resistance of P. falciparum lives in western Yunnan bordering Myanmar. According to 20 years' (1982–2003) of monitoring data, the most chloroquine-resistant P. falciparum is observed in Ruili, western Yunnan, which had the highest parasite resistance rate to chloroquine of 100%, 96%, and 83% in the 1982, 1993, and 2003 surveys, respectively. Interestingly, the overall rate of resistant clinical cases decreased from 97% between 1981 and 1983 to 40% between 2005 and 2006.38 This decline is consistent with the decrease of malaria deaths in Yunnan. In contrast, an association between the emergence of chloroquine resistance and increases in malaria mortality has been observed in Senegal.39 The use of poorly effective drugs is a major factor likely to result in an increase of malaria deaths.40 The use of effective antimalarial drugs will be important to decrease clinical cases and to prevent more deaths in Yunnan. Socio-economic factors like economic status, living conditions, and agriculture practices could be related to the persistent cluster in western Yunnan over the past two decades.4,41 The cross-border migrations from Myanmar and effects of seasonal rains on malaria incidence could also contribute to the spatial patterns observed in this region.7,29
Third, Yunnan province is a high malaria-endemic region located south of the 25th parallel north. Malaria endemicity in this region is historically stable and remains at a high level.42 Our results suggest that the magnitude of malaria risk and intensity is concentrated in western Yunnan, where 25 distinct ethnic minorities live. People living in this remote, forested, and hilly area generally have a low income and education level, poor knowledge of malaria transmission, and personal protection, and poor access to health facilities. Additionally, plantation agriculture, forest work, and other outdoor activities are common in the border area.41 Intensive interventions of malaria prevention and control should therefore be implemented in this vulnerable region.
In this study, we identified spatial clusters, seasonal patterns, and geographic variations of malaria deaths in Yunnan Province. The epidemics of P. vivax and P. falciparum malaria could be different. We did not separate analyses of deaths on parasites caused by a lack of detailed death information on P. vivax and P. falciparum in this study. Further research should explore the difference in deaths caused by P. vivax and P. falciparum, and assess the major determinants of malaria risk in this endemic region. In addition, there is a need to evaluate the effectiveness of current malaria elimination program strategies in Yunnan, which launched in 2010.37
ACKNOWLEDGMENTS
We thank Lin Lu, Director of the Yunnan Center for Disease Control and Prevention, Jun Yang and Yangheng Luo, Vice-directors of the Yunnan Center for Disease Control and Prevention, for their assistance with field data collection in China. We also thank Martin Reese, Trish Gould, and Lyer Turner from the Queensland University of Technology, Australia for help in proofreading the early and final versions of this manuscript, respectively.
Footnotes
Financial support: S.T. is supported by a NHMRC Research Fellowship (no. 553043). Y.B. is supported by a Queensland University of Technology Postgraduate Research Award. X.N.Z. is partially supported by National Nature Science Foundation of China (no. 81273192).
Authors' addresses: Yan Bi, School of Public Health and Social Work, and IHBI, Queensland University of Technology (QUT), Brisbane, Australia, and Yunnan Center for Disease Control and Prevention, Kunming, China, E-mail: y1.bi@qut.edu.au. Wenbiao Hu, School of Population Health, University of Queensland, Brisbane, Australia, E-mail: w.hu@sph.uq.edu.au. Henglin Yang, Yunnan Institute of Parasitic Diseases, Puer, China, E-mail: yang_henglin@sohu.com. Xiao-Nong Zhou, National Institute of Parasitic Diseases, Chinese Center for Disease Control and Prevention, Shanghai, China, E-mail: ipdzhouxn@sh163.net. Weiwei Yu and Shilu Tong, School of Public Health and Social Work, and IHBI, QUT, Brisbane, Australia, E-mails: weiwei.yu@qut.edu.au and s.tong@qut.edu.au. Yuming Guo, School of Population Health, University of Queensland, Brisbane, Australia, E-mail: guoyuming@yahoo.cn.
References
- 1.World Health Organization . Global Malaria Programme: World Malaria Report. Geneva: World Health Organization; 2010. [Google Scholar]
- 2.Rodriguez-Morales AJ, Benítez JA, Arria M. Malaria mortality in Venezuela: focus on deaths due to Plasmodium vivax in children. J Trop Pediatr. 2008;54:94–101. doi: 10.1093/tropej/fmm074. [DOI] [PubMed] [Google Scholar]
- 3.Hui FM, Xu B, Chen ZW, Cheng X, Liang L, Huang HB, Fang LQ, Yang H, Zhou HN, Yang HL. Spatio-temporal distribution of malaria in Yunnan Province, China. Am J Trop Med Hyg. 2009;81:503–509. [PubMed] [Google Scholar]
- 4.Clements A, Barnett AG, Cheng ZW, Snow RW, Zhou HN. Space-time variation of malaria incidence in Yunnan province, China. Malar J. 2009;8:180. doi: 10.1186/1475-2875-8-180. [DOI] [PMC free article] [PubMed] [Google Scholar]
- 5.Zhang WY, Wang LP, Fang LQ, Ma JQ, Xu YF, Jiang YF, Hui FM, Wang JJ, Liang S, Yang H, Cao WC. Spatial analysis of malaria in Anhui province, China. Malar J. 2008;7:206. doi: 10.1186/1475-2875-7-206. [DOI] [PMC free article] [PubMed] [Google Scholar]
- 6.Zhou SS, Wang Y, Fang W, Tang LH. Malaria situation in the People's Republic of China in 2007. Chin J Parasitol Parasit Dis. 2008;25:401–403. [PubMed] [Google Scholar]
- 7.Xu JW, Liu H. Border malaria in Yunnan, China. Southeast Asian J Trop Med Public Health. 1997;28:456–459. [PubMed] [Google Scholar]
- 8.Craig M, Kleinschmidt I, Le Sueur D, Sharp B. Exploring 30 years of malaria case data in KwaZulu-Natal, South Africa: Part II. The impact of non-climatic factors. Trop Med Int Health. 2004;9:1258–1266. doi: 10.1111/j.1365-3156.2004.01341.x. [DOI] [PubMed] [Google Scholar]
- 9.Craig M, Kleinschmidt I, Nawn J, Le Sueur D, Sharp B. Exploring 30 years of malaria case data in KwaZulu-Natal, South Africa: Part I. The impact of climatic factors. Trop Med Int Health. 2004;9:1247–1257. doi: 10.1111/j.1365-3156.2004.01340.x. [DOI] [PubMed] [Google Scholar]
- 10.Githeko AK, Lindsay SW, Confalonieri UE, Patz JA. Climate change and vector-borne diseases: a regional analysis. Bull World Health Organ. 2000;78:1136–1147. [PMC free article] [PubMed] [Google Scholar]
- 11.Lindsay S, Martens W. Malaria in the African highlands: past, present and future. Bull World Health Organ. 1998;76:33. [PMC free article] [PubMed] [Google Scholar]
- 12.Zhou XN, Lv S, Yang GJ, Kristensen TK, Bergquist NR, Utzinger J, Malone JB. Spatial epidemiology in zoonotic parasitic diseases: insights gained at the 1st International Symposium on Geospatial Health in Lijiang, China, 2007. Parasit Vectors. 2009;2:10. doi: 10.1186/1756-3305-2-10. [DOI] [PMC free article] [PubMed] [Google Scholar]
- 13.Clarke KC, McLafferty SL, Tempalski BJ. On epidemiology and geographic information systems: a review and discussion of future directions. Emerg Infect Dis. 1996;2:85. doi: 10.3201/eid0202.960202. [DOI] [PMC free article] [PubMed] [Google Scholar]
- 14.Brooker S, Clarke S, Njagi JK, Polack S, Mugo B, Estambale B, Muchiri E, Magnussen P, Cox J. Spatial clustering of malaria and associated risk factors during an epidemic in a highland area of western Kenya. Trop Med Int Health. 2004;9:757–766. doi: 10.1111/j.1365-3156.2004.01272.x. [DOI] [PubMed] [Google Scholar]
- 15.Craig M, Snow R, Le Sueur D. A climate-based distribution model of malaria transmission in sub-Saharan Africa. Parasitol Today. 1999;15:105–110. doi: 10.1016/s0169-4758(99)01396-4. [DOI] [PubMed] [Google Scholar]
- 16.Hay SI, Snow RW, Rogers DJ. Predicting malaria seasons in Kenya using multitemporal meteorological satellite sensor data. Trans R Soc Trop Med Hyg. 1998;92:12–20. doi: 10.1016/s0035-9203(98)90936-1. [DOI] [PubMed] [Google Scholar]
- 17.Tanser FC, Sharp B, le Sueur D. Potential effect of climate change on malaria transmission in Africa. Lancet. 2003;362:1792–1798. doi: 10.1016/S0140-6736(03)14898-2. [DOI] [PubMed] [Google Scholar]
- 18.Snow RW, Craig M, Deichmann U, Marsh K. Estimating mortality, morbidity and disability due to malaria among Africa's non-pregnant population. Bull World Health Organ. 1999;77:624–640. [PMC free article] [PubMed] [Google Scholar]
- 19.Beck LR, Rodriguez MH, Dister SW, Rodriguez AD, Rejmankova E, Ulloa A, Meza RA, Roberts DR, Paris JF, Spanner MA. Remote sensing as a landscape epidemiologic tool to identify villages at high risk for malaria transmission. Am J Trop Med Hyg. 1994;51:271. doi: 10.4269/ajtmh.1994.51.271. [DOI] [PubMed] [Google Scholar]
- 20.Ernst KC, Adoka SO, Kowuor DO, Wilson ML, John CC. Malaria hotspot areas in a highland Kenya site are consistent in epidemic and non-epidemic years and are associated with ecological factors. Malar J. 2006;5:78. doi: 10.1186/1475-2875-5-78. [DOI] [PMC free article] [PubMed] [Google Scholar]
- 21.Srivastava A, Nagpal B, Joshi P, Paliwal J, Dash A. Identification of malaria hot spots for focused intervention in tribal state of India: a GIS based approach. Int J Health Geogr. 2009;8:30. doi: 10.1186/1476-072X-8-30. [DOI] [PMC free article] [PubMed] [Google Scholar]
- 22.Kulldorff M. A spatial scan statistic. Comm Statist Theory Methods. 1997;26:1481–1496. [Google Scholar]
- 23.Mostashari F, Kulldorff M, Hartman JJ, Miller JR, Kulasekera V. Dead bird clusters as an early warning system for West Nile virus activity. Emerg Infect Dis. 2003;9:641. doi: 10.3201/eid0906.020794. [DOI] [PMC free article] [PubMed] [Google Scholar]
- 24.Zhang Z, Carpenter TE, Chen Y, Clark AB, Lynn HS, Peng W, Zhou Y, Zhao G, Jiang Q. Identifying high-risk regions for schistosomiasis in Guichi, China: a spatial analysis. Acta Trop. 2008;107:217–223. doi: 10.1016/j.actatropica.2008.04.027. [DOI] [PubMed] [Google Scholar]
- 25.Morrison AC, Getis A, Santiago M, Rigau-Perez JG, Reiter P. Exploratory space-time analysis of reported dengue cases during an outbreak in Florida, Puerto Rico, 1991–1992. Am J Trop Med Hyg. 1998;58:287–298. doi: 10.4269/ajtmh.1998.58.287. [DOI] [PubMed] [Google Scholar]
- 26.Naish S, Hu W, Mengersen K, Tong S. Spatial and temporal clusters of Barmah Forest virus disease in Queensland, Australia. Trop Med Int Health. 2011;16:884–893. doi: 10.1111/j.1365-3156.2011.02775.x. [DOI] [PubMed] [Google Scholar]
- 27.Coleman M, Mabuza A, Kok G, Coetzee M, Durrheim D. Using the SaTScan method to detect local malaria clusters for guiding malaria control programmes. Malar J. 2009;8:68. doi: 10.1186/1475-2875-8-68. [DOI] [PMC free article] [PubMed] [Google Scholar]
- 28.Asnakew Y, Sucharita G, Afework H, Dereje D, Hrishikesh P. Spatial analysis of malaria incidence at the village level in areas with unstable transmission in Ethiopia. Int J Health Geogr. 2009;8:5. doi: 10.1186/1476-072X-8-5. [DOI] [PMC free article] [PubMed] [Google Scholar]
- 29.Zhu DF, Che LG, Su FC. The malaria situation on the frontiers of Yunnan Province, China. Southeast Asian J Trop Med Public Health. 1994;25:19–24. [PubMed] [Google Scholar]
- 30.Bureau of Endemic Diseases Control of People's Republic of China . Manual of Malaria Control. Beijing: People's Health Publishing Company; 1998. [Google Scholar]
- 31.Ministry of Health of the People's Republic of China Diagnostic Criteria for Malaria. 2006. http://www.moh.gov.cn/open/web_edit_file/20070604094905.pdf (WS 259-2006) Available at. Accessed October 16, 2012.
- 32.Tabachnick BG, Fidell LS. Using Multivariate Statistics. Boston: Pearson/Allyn & Bacon; 2007. [Google Scholar]
- 33.Tian LW, Bi Y, Ho SC, Liu WJ, Liang S, Goggins WB, Chan EY, Zhou SS, Sung J. One-year delayed effect of fog on malaria transmission: a time-series analysis in the rain forest area of Mengla County, south-west China. Malar J. 2008;7:110. doi: 10.1186/1475-2875-7-110. [DOI] [PMC free article] [PubMed] [Google Scholar]
- 34.Hu H, Singhasivanon P, Salazar NP, Thimasarn K, Li XZ, Wu YX, Yang H, Zhu DF, Supavej S, Looarecsuwan S. Factors influencing malaria endemicity in Yunnan Province, PR China (analysis of spatial pattern by GIS). Geographical Information System. Southeast Asian J Trop Med Public Health. 1998;29:191–200. [PubMed] [Google Scholar]
- 35.Zhou SS, Wang Y, Tang LH. Malaria Situation in the People's Republic of China in 2005. Chin J Parasitol Parasit Dis. 2006;24:401–403. [PubMed] [Google Scholar]
- 36.Zhou SS, Wang Y, Xia Z. Malaria situation in the People's Republic of China in 2009. Chin J Parasitol Parasit Dis. 2011;29:1–3. [PubMed] [Google Scholar]
- 37.Zhou SS, Wang Y, Li Y. Malaria situation in the People's Republic of China in 2010. Chin J Parasitol Parasit Dis. 2011;29:401–403. [PubMed] [Google Scholar]
- 38.Yang HL, Yang YM, Yang PF, Li XL, Gao BH, Zhang ZY, Yang ZQ, Cui LW. Monitoring Plasmodium falciparum chloroquine resistance in Yunnan Province, China, 1981–2006. Acta Trop. 2008;108:44–49. doi: 10.1016/j.actatropica.2008.08.010. [DOI] [PMC free article] [PubMed] [Google Scholar]
- 39.Trape JF, Pison G, Preziosi MP, Enel C, Lou AD, Delaunay V, Samb B, Lagarde E, Molez JF, Simondon F. Impact of chloroquine resistance on malaria mortality. C R Acad Sci III. 1998;321:689–697. doi: 10.1016/s0764-4469(98)80009-7. [DOI] [PubMed] [Google Scholar]
- 40.Trape JF. The public health impact of chloroquine resistance in Africa. Am J Trop Med Hyg. 2001;64:12–17. doi: 10.4269/ajtmh.2001.64.12. [DOI] [PubMed] [Google Scholar]
- 41.Sarah M, Xia M, Caroline J, Zhang ZX, Mary MC. Border malaria in China: knowledge and use of personal protection by minority populations and implications for malaria control: a questionnaire-based survey. BMC Public Health. 2008;8:344. doi: 10.1186/1471-2458-8-344. [DOI] [PMC free article] [PubMed] [Google Scholar]
- 42.Committee of Malaria Control and Prevention of China . Malaria Control and Prevention of China. Beijing: People's Health Publishing Company; 1991. [Google Scholar]