

Abstract
We present an active wavelength control system for grating-based external cavity lasers that increases the accuracy of predicting the lasing wavelength based on the grating equation and significantly improves scan-to-scan wavelength/frequency repeatability. The ultimate 3σ precision of a frequency scan is determined by the scan-to-scan repeatability of 0.042 cm−1. Since this control method can be applied to any external cavity laser with little to no modification, such a precision provides an excellent opportunity for spectroscopic applications that target molecular absorption lines at standard atmospheric conditions.
1 Introduction
Semiconductor lasers are increasingly popular as components of high sensitivity spectroscopic trace-gas sensing systems because of their ease of use, high power, and small footprint [1]. Quantum Cascade Lasers (QCLs) are particularly attractive semiconductor lasers, since their operating wavelengths in the mid-infrared region (3–12 μm) overlap with the spectral region of the strongest fundamental molecular rovibrational bands [2]. For applications in high resolution spectroscopy, single mode operation is required, but a cleaved semiconductor laser chip forms a Fabry Perot (FP) cavity that supports multiple modes. There are several methods used to restrict the semiconductor laser operation to a single longitudinal laser mode, and the two most popular methods are a distributed feedback (DFB) structure (grating) fabricated onto the laser waveguide or an external cavity laser (ECL) arrangement that uses an external diffraction grating to select a single longitudinal mode.
The wavelength coverage provided by a DFB QCL is limited by thermal changes of the laser waveguide effective refractive index. The temperature of DFB lasers can be changed through a slow process of substrate temperature variation over ~100 K that can tune the laser frequency 10 – 20 cm−1 or through a faster process of laser bias current variation that can only tune 1 – 3 cm−1 [3–6]. Since the substrate thermal tuning is not practical for portable sensor applications, an array of DFB lasers designed for different frequencies has been used to cover a broader wavelength range. An example DFB QCL array device covering 220 cm−1 has been used to perform spectroscopy of liquid samples [7,8]. Since this approach avoids mechanical parts and electrically selects the output wavelength, such devices have great potential of becoming very practical spectroscopic sources in the future. Currently, the main obstacles are an inefficient combining of multiple DFB laser beams and fabrication errors that lead to differences in wavelengths, thresholds, slope efficiencies, output powers, etc. of the individual DFB lasers in the array. The latter also results in a lower yield of array devices compared to single DFB lasers, increasing manufacturing costs. Therefore at the present time, it is easier and more economically feasible to produce FP chips with broadband gain structures and to use ECL configuration for wavelength tuning and control.
The ECLs give access to the entire gain spectrum of the laser and usually offer the largest tuning range achievable for a single semiconductor laser chip. For that reason, widely tunable ECLs are useful tools in trace-gas spectroscopy, because its broadband wavelength coverage provides access to multiple molecular absorption lines using only a single laser system [1–3]. Moreover, the QCL gain region consists of multiple quantum wells that can be precisely engineered to achieve exceptionally broadband gain profiles [9,10]. Designs such as the “continuum-to-bound” and “bound-to-continuum” quantum structures or a heterogeneous cascade of multiple “bound-to-continuum” structures have demonstrated ultra-broadband gain spectra that are >430 cm−1 wide [11–13]. With an appropriate anti-reflection (AR) coating on the laser facet to suppress the laser FP cavity modes and to improve coupling efficiency with the external cavity, Hugi et al. have been able to achieve EC-QCL tuning of up to 39% (7.6 – 11.4 μm) of the center laser wavelength [13].
As first demonstrated in 2001 by Luo et al, an external cavity arranged in a Littrow configuration allows for convenient tuning of the QCL operating frequency [14]. The ECL is tuned by varying the diffraction grating as described by the grating equation for Littrow configuration: λ = 2dsin(α), where the wavelength (λ) favored by the grating is determined by the angle of incidence of the beam onto the grating (α), the grating groove spacing (d), and diffraction order, m (m=1 was used in this work). However, the grating equation does not accurately describe the ECL frequency due to other wavelength-selective elements in the external cavity arrangement that also influence the actual lasing wavelength. In addition to the diffraction grating filter, there are two other intracavity wavelength-selective structures: the FP cavity formed by the front and back facets of the cleaved laser chip, and the external FP cavity (EC) formed by the laser back facet and the diffraction grating [15,16]. Although the laser chip resonances can be strongly suppressed with an AR coating on the front facet, the residual reflectivity is usually significant enough to influence the lasing wavelength and/or cause mode hops [17]. If the ECL exhibits mode hops, the grating equation cannot be used to predict the lasing wavelength accurately, and the resulting error of the laser wavelength selection can be on the same order as the laser chip FSR (free spectral range, typically 0.5 cm−1 for a 3 mm long QCL chip). Therefore, in applications that require precise and accurate knowledge of the operating lasing wavelength (i.e. high resolution spectral measurement of molecular lineshapes), additional equipment, such as a wavemeter, is needed for accurate wavelength determination, which increases the experimental complexity and cost.
The active wavelength control method described in this paper automatically controls the three wavelength-selective resonances to provide an improved accuracy with respect to the grating equation and a significantly better scan-to-scan repeatability. Since most external cavities already have the capability to individually adjust the three resonance structures, this method is also applicable to most of the available semiconductor ECLs and require little or no modification of the system [18,19].
2 Active wavelength control method
The EC-QCL setup used to demonstrate the active wavelength control method was described in Ref [20] and schematically shown in Fig. 1. This is a folded cavity arrangement in which the folding mirror was mounted onto a fast piezoelectric tilt stage (4 mrad tilt range at 1 kHz speeds from Piezosystem Jena: PSH 4/1) to perform fast modulation of the effective grating angle. The position of the folding mirror could also be translated using a linear piezo-actuator (ThorLabs: DRV 181) to perform EC length adjustments. The diffraction grating was mounted on a separate motorized rotation stage for coarse angle adjustment over a wide range of angles (total available range: 360°). The QCL chip bias current was varied to provide thermal index tuning of the laser chip, which altered the spectral positions of the laser chip FP resonances.
Figure 1.

A schematic diagram of a folded Littrow-based EC-QCL. BS: beamsplitter, OPM: off-axis parabolic mirror, and PD: photodetector. The laser temperature is controlled using a thermoelectric cooling device (TEC).
The EC-QCL output beam (on the right side in Fig. 1) was split with a 30/70 ratio beamsplitter. 30% of the light was directed to a room temperature HgCdZnTe detector, which was used for wavelength control. Synchronous demodulations of photo-detected signals with two lock-in amplifiers generated error signals that were used to spectrally align the three resonances (Fig. 2). The second beam from the beamsplitter was the actual output beam of the wavelength-controlled laser system. In this experiment, the output beam was directed to a wavemeter to characterize the actively controlled EC-QCL output wavelength. The active wavelength control process consists of two active wavelength locking mechanisms: one actively locks the laser chip resonance onto the EC resonance (blue loop in Fig. 2), and the second locks the EC resonance to the center of the grating filter spectral envelope (red loop in Fig. 2).
Figure 2.
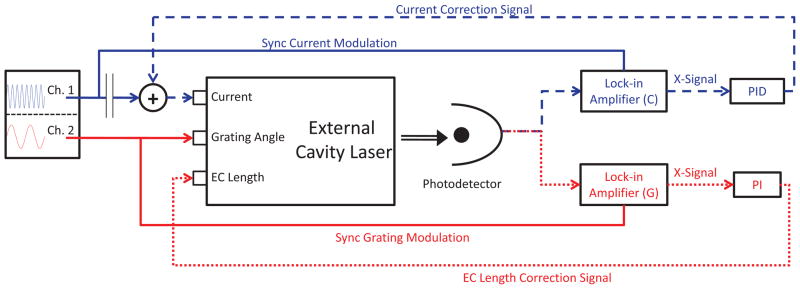
Block diagram of the active wavelength control system. Blue lines correspond to current control loop; red lines to EC length control loop; and dashed/dotted lines are the respective feedback signals.
The first loop is a fast current control loop that adjusts the laser current such that the laser chip resonance coincides with the EC resonance. Typically, mode hops are observed when the laser current is scanned without simultaneous adjustment of the EC length and the grating angle. As shown in Fig. 3, the mode hops are ~0.07 cm−1 apart, which is consistent with the EC FSR given that the EC effective length is 6.6 cm. The laser intensity changes between mode hops, and a local maximum can be clearly observed at currents that correspond to a spectral alignment of the laser chip resonance with the EC resonance (blue in Fig. 3). To generate an error signal that could be used for active locking, the laser current was modulated at 100 kHz with a small (4 mA) sinusoidal waveform, and Lock-in Amplifier (C) (refer to Fig. 2) with a time constant of 1 ms was used to perform phase-sensitive detection of the photo-detected signal. Demodulation of the detector signal at the first harmonic (1f) of the laser current modulation frequency yielded a derivative-like shape (red in Fig. 3) that could serve as the error signal for the active control loop.
Figure 3.

The demodulated in-phase signal (red) from the Lock-in Amplifier (C) (refer to Fig. 2) and an averaged EC-QCL intensity (blue) as a function of QCL bias current. The in-phase signal corresponding to the local intensity maximums is shown as the solid black line. Top graph shows the corresponding EC-QCL output frequency.
The lock-in amplifier in-phase signal recorded over a 70 mA scan of the laser bias current was used to determine the point of maximum intensity for each mode. Due to residual amplitude modulation of the laser output, the in-phase 1f signal did not cross zero at the peak intensity. The actual 1f signal offset was found by fitting the intensity data for each mode with a quadratic function, and mapping the peak intensity position onto the corresponding in-phase signal (shown as black horizontal line in Fig. 3). It is important to verify if the phase shift due to the spectral misalignment of the lasing wavelength relative to the grating resonance contributes to this 1f signal offset. The grating filter has a full width at half maximum (FWHM) of 1.6 cm−1 (calculated for 4 mm beam size and 150 grooves/mm diffraction grating used in this experiment), and the frequency span of ~0.2 cm−1 in the 70 mA scan corresponds to ~12.5% of the grating FWHM. Within such a span, an additional phase shift from the grating spectral envelope, if substantially large, should occur as variation of the offset for each mode. However, as shown in Fig. 3, the 1f signal offset remains the same for all three modes observed within the 70 mA scan. This means that the offset is primarily due to a contribution of the residual amplitude modulation of the laser output, which occurs as a constant shift of the 1f signal.
To perform active control of the laser current, the in-phase signal was used as an error signal for a PID (proportional-integral-derivative) controller (Stanford Research Systems SIM960), and the value of the offset was used as a setpoint. The PID actively adjusted the laser bias current to lock the laser resonance onto the EC resonance. To adopt PID output specifications to the laser driver modulation input, a 1/10 voltage divider was used to achieve appropriate matching. The PID parameters were tuned to minimize errors given perturbations to the EC length, and the parameters were the following: P = −0.01 V/V, I = 15×102 s−1, and D = 1×10⁻² s.
The performance of this feedback loop was tested by running an experiment in which the EC length was tuned over 20 μm (which corresponds to a cavity scan over ~4 FSRs at the center laser wavelength of 10.5 μm) without and with the current control loop. The results of this experiment are shown in Fig. 4. Fig. 4a demonstrates the effects of varying the EC length without active current control, and several mode hops are clearly visible. At the beginning of the scan the system lases at 956.18 cm−1. As the EC length increases, another EC resonance is supported by the system, and the laser mode hops to 956.65 cm−1. The EC-QCL emission wavelength is clearly not stable and several times during the scan, it switches between 956.18 cm−1, 955.93 cm−1, and 956.65 cm−1. The average mode hop roughly corresponds to the QCL FSR of ~0.5 cm−1, which suggests that the EC-QCL supports several EC longitudinal modes which spectrally coincide with two different QCL FP modes. Since the spectral position of the grating resonance seems to favor the 956.65 cm−1 mode, the EC-QCL is able to self-lock to this mode for over ~2 μm variation of EC length between mode hops. While the EC-QCL wavelength is self-locked, it tunes with an average rate of −0.015 cm−1/μm, which is close to the calculated EC tuning rate of −0.014 cm−1/μm based on the EC length of 6.6 cm. Fig. 4b shows that by applying active feedback loop to control the laser current (and thus the optical length of the laser chip cavity), the laser chip resonance is spectrally aligned with the EC resonance, and the two resonance structures both simultaneously and synchronously tune the EC-QCL output wavelength over the entire 20 μm range. The tuning rate of −0.014 cm−1/μm observed with active current control agrees well with the calculated EC tuning rate.
Figure 4.

EC-QCL output frequency (a) without and (b) with the active laser current control.
The second feedback loop (shown as red dotted lines in Fig. 2) is used to spectrally align the EC resonance with the center of the spectral envelope of the grating filter. This is accomplished by modulating the folding mirror with a sinusoidal waveform of 0.0643 mrads peak-to-peak at 1.33 kHz. Alternatively an EC length modulation could be used to accomplish the same task (this is noted because many ECL systems are equipped with EC length modulation hardware). A second lock-in amplifier (Lock-in Amplifier (G)) is used to detect the intensity modulation at the first harmonic of the modulation frequency. Similar to the current feedback loop, this EC length control loop also uses the derivative-like in-phase signal shape as an error signal for the EC length adjustment. The EC length correction is performed with the linear piezo-actuator while the current control loop is active. The observed in-phase signal at 1.33 kHz exhibits a zero crossing at the EC length for which all three resonance structures are spectrally aligned and a local maximum in the intensity is observed. The EC length is adjusted so that the in-phase signal from Lock-in Amplifier (G) is kept at zero.
Since this EC length control loop error signal becomes zero only if all three resonance structures are spectrally aligned, the response of the current control loop must be fast enough to follow any EC length changes introduced by the EC length control loop. In the studied system, the speed of the current control loop is primarily limited by the laser driver current modulation bandwidth of 100 kHz. To ensure a good signal-to-noise ratio, Lock-in Amplifier (C) was set to a time constant of 1 ms (equivalent to 100 periods of the modulation signal). This corresponds to a lock-in bandwidth of 158 Hz, which determines the effective bandwidth of the current control loop. The speed of the EC length control loop is primarily limited by a ~30 Hz bandwidth of the piezo-controlled EC length actuation hardware. The noise equivalent bandwidth of Lock-in Amplifier (G) was set to 37.5 Hz (time constant 5 ms, 12dB/octave filter slope). A proportional-integral (PI) controller was sufficient to control the system, and a LabView software based PI controller was developed to adjust the EC length based on the error signal generated by Lock-in Amplifier (G). After optimization of the proportional and integral terms, the ten-to-ninety percent response time of the system under wavelength control was approximately t10-90=75 ms (measured as a response to a step change of the grating angle). It is clear that the EC length control loop is slow and can be easily followed by the current control loop with 158 Hz bandwidth. The response of the optimized wavelength control was tested experimentally, and it required ~130 ms (approximately 2·t10-90) for the active feedback to spectrally align all three wavelength-selective EC-QCL elements within the 3σ noise of the error signal observed at the Lock-in Amplifier (G) output. For the current prototype, this is the ultimate minimum settling time required for every spectral point within the laser wavelength scan.
3 Active wavelength control results
In order to test the entire system with full active wavelength control, the grating angle was coarsely varied over 0.2° (3 cm−1) with 0.01o (0.15 cm−1) steps, and the EC-QCL output wavelength was recorded without (Fig. 5a) and with active wavelength control (Fig. 5b). The grating equation (solid red line) was fit to the collected data points (black dots) with the residuals plotted below. An angle offset parameter was incorporated into the grating equation fit to account for an offset between the angle measured by the encoder built into the rotation stage and the actual beam incident angle on the grating. In the final version of the instrument, this offset can be easily calibrated and accounted for in a feed-forward manner. The step-like tuning in Fig. 5a is a result of mode hops due to spectral misalignment of the laser chip resonance structures. The 3σ error of 0.47 cm−1 observed in the residuals from the grating equation fit roughly corresponds to the FSR of the QCL chip. Subsequently, a second scan was performed over the same frequency range, and at each step, the active control was activated to align the three resonances (Fig. 5b). The fit residuals show that this active wavelength control process is capable of automatically aligning all three resonances so that the grating equation is accurate to within a 3σ error of 0.06 cm−1. It is clear that for a narrow 3 cm−1 scan, the active wavelength control improves the precision of prediction of the EC-QCL output wavelength using the grating equation by approximately an order of magnitude with respect to a free-running EC-QCL system.
Figure 5.


EC-QCL output frequency as a function of grating angle fitted with the grating equation (a) without active wavelength control and (b) with active wavelength control. The fit residuals are plotted in the bottom panels using the same vertical scale for direct comparison.
For a broadband scan over the entire available laser tuning range (41 cm−1), the 3σ precision of the active wavelength control deteriorates to 0.25 cm−1 as shown in Fig. 6. Although this performance is still better than for the system without wavelength control, this deterioration has been studied in more detail to determine its origin.
Figure 6.

EC-QCL output frequency as a function of grating angle with active wavelength control over 3.1° angle range fitted with the grating equation.
A strong fringe pattern was observed in the emitted laser power as the laser frequency was scanned without active wavelength control over the entire laser tuning range (Fig. 7a). After the total laser power baseline has been factored out, the resulting relative intensity variations as a function of the wavelength are shown in Fig. 7b. A fit by a standard FP cavity transmission equation was performed with the optical length and the reflectivity of the mirrors as fitting parameters. The fit (red dashed line Fig. 7b) yields an etalon FSR of 4.73 cm−1, which corresponds to an optical length of 1.05 mm with end-facet reflectivity of 15%. Based on these parameters, the distance between the laser facet and the anti-reflection coated collimating lens had been identified as the most probable source of the etalon fringe. Because such strong fringing was not observed when the system was first tested in 2009 (Ref [20]), we assumed that the quality of the AR coatings on the components of the integrated EC-QCL used in this study had significantly deteriorated after three years of operation in open air. Based on this data, we suspected that this fringe pattern was the most likely cause of the wavelength setting precision deterioration shown in Fig. 6.
Figure 7.


(a) Fringes of a parasitic FP cavity visible in a laser output power spectral scan with Lorentzian fit to laser power (dashed red line). (b) Same as (a) but with the laser power factored out (solid black line). The red dashed line is a fit to a standard FP etalon transmission equation.
Such parasitic fringes in combination with a frequency varying laser gain introduce a phase shift via frequency pulling effects [21]. The phase shift due to the laser gain was estimated from a Lorentzian lineshape fitted to the laser power baseline shown as the red dashed line in Fig. 7a. The phase contribution from the parasitic etalon was calculated from the argument of the electric field in the FP transmission model plotted in Fig. 7b. The sum of the two phase relations as a function of the grating angle is shown in Fig. 8 (blue circles). For comparison, the residuals from the grating equation fit are plotted in the same figure (black squares). To a high extent, both plots show a similar trend with small discrepancies at higher grating angles, which may be evidence of another parasitic FP resonance in the system. Weak evidence of a secondary parasitic FP cavity is also visible in the scans of Fig. 7. Since both laser facets and their respective collimating lenses are coated, both coatings could be deteriorating. Nonetheless, this qualitative test shows that in applications that require high precision of wavelength calibration, the frequency pulling effects are of importance for grating equation referenced wavelength control.
Figure 8.

Residuals shown in Fig. 6 plotted together with the phase shift calculated for the additional parasitic Fabry Perot cavity and Lorentzian laser gain profile.
Although the grating equation itself could not be used as an accurate wavelength standard in the present system, the active wavelength controlled EC-QCL, once calibrated, should still provide high wavelength precision if the wavelength tuning process is reproducible. Therefore, a scan-to-scan repeatability of the grating angle scan was evaluated to test the ultimate precision of the active wavelength control process. This test was performed by acquiring 10 identical grating angle scans both without and with active wavelength control. Each scan contained 11 grating steps distributed over the entire tuning range of the EC-QCL under study. A standard deviation of the 10 scans at each grating position was calculated and plotted in the bottom panels of Fig. 9. For general performance comparison of the two methods, an average value of all 11 standard deviation values was used. An average standard deviation of 0.38 cm−1 was observed for the EC-QCL without active wavelength control (Fig. 9a). This relatively large value is expected for the scans dominated by uncontrolled mode hops. However, with active wavelength locking, the average standard deviation decreases by a factor of almost 30 to 0.014 cm−1 (Fig. 9b). This confirms that systematic errors, such as the one caused by parasitic cavities, can be easily corrected with a simple calibration or look-up table that guarantees a precision on the order of 10−2 cm−1.
Figure 9.


Ten grating angle scans over the entire available laser tuning range (represented by different symbols) plotted together with the standard deviation of the frequency at each grating angle: (a) without active wavelength control and (b) with active wavelength control. Please note that the vertical axis range for the standard deviation in (b) has been reduced by one order of magnitude.
4 Conclusions
Without active wavelength control, the diffraction grating equation is inaccurate in predicting the ECL operating wavelength because of mode hopping and other effects due to optical resonance structures present in the system. We have developed an active wavelength control method, which automatically synchronizes the three major wavelength-selective resonance structures in a grating-based external cavity laser system and increases precision of the laser wavelength tuning.
Even in a low quality EC-QCL system used in this work with a very strong parasitic etalon (fringe visibility factor of 0.66), the developed active wavelength control allows using the grating equation to predict the EC-QCL operating wavelength within 3σ error of 0.06 cm−1 for narrow scans and 0.25 cm−1 for broadband scans (over ~40 cm−1). Additionally, those parasitic fringes have not prevented the actively controlled system from achieving scan-to-scan 3σ repeatability of 0.042 cm−1 over the entire laser tuning range. This precision is smaller than the pressure-broadened absorption linewidths at standard atmospheric pressure, which shows potential for applications in atmospheric trace-gas detection without the need for additional wavemeters or other relative frequency calibration standards (e.g. etalons). Moreover, the demonstrated active wavelength control method can be applied to most ECL systems with little to no modifications as long as the EC length, grating angle, and laser current controls are available.
Acknowledgments
This project was supported by grants from the National Science Foundation Engineering Research Center MIRTHE, NSF GRFP Grant (DGE-0646086), as well as from the National Center for Research Resources (5R21RR026231-03) and the National Institute of General Medical Sciences (8 R21 GM103460-03) from the National Institutes of Health. The authors would like to thank Dr. Tim Day from Daylight Solutions Inc. for providing a QCL assembly used in this work, and Dr. Brian Brumfield for reading the manuscript and providing very valuable comments.
References
- 1.Curl RF, Tittel FK. Annu Rep Prog Chem Sect C: Phys Chem. 2002;98:217. [Google Scholar]
- 2.Tittel FK, Bakhirkin YA, Curl RF, Kosterev AA, McCurdy MR, So SG, Wysocki G. Laser Based Chemical Sensor Technology: Recent Advances and Applications. In: Kim YJ, Platt U, editors. Advanced Environmental Monitoring. Springer; Netherlands: 2008. p. 50. [Google Scholar]
- 3.Faist J, Gmachl C, Capasso F, Sirtori C, Sivco DL, Baillargeon JN, Cho AY. Appl Phys Lett. 1997;70:2670. [Google Scholar]
- 4.Wittmann A, Bonetti Y, Fischer M, Faist J, Blaser S, Gini E. IEEE Photonics Technol Lett. 2009;21:814. [Google Scholar]
- 5.Sharpe SW, Kelly JF, Hartman JS, Gmachl C, Capasso F, Sivco DL, Baillargeon JN, Cho AY. Opt Lett. 1998;23:1396. doi: 10.1364/ol.23.001396. [DOI] [PubMed] [Google Scholar]
- 6.Beyer T, Braun M, Lambrecht A. J Appl Phys. 2003;93:3158. [Google Scholar]
- 7.Lee BG, Belkin MA, Audet R, MacArthur J, Diehl L, Pflugl C, Capasso F, Oakley DC, Chapman D, Napoleone A, Bour D, Corzine S, Hofler G, Faist J. Appl Phys Lett. 2007;91:231101. [Google Scholar]
- 8.Lee BG, Zhang HA, Pflugl C, Diehl L, Belkin MA, Fischer M, Wittmann A, Faist J, Capasso F. IEEE Photonics Technol Lett. 2009;21:914. [Google Scholar]
- 9.Gmachl C, Sivco DL, Colombelli R, Capasso F, Cho AY. Nature. 2002;415:883. doi: 10.1038/415883a. [DOI] [PubMed] [Google Scholar]
- 10.Gmachl C, Capasso F, Sivco DL, Cho AY. Rep Prog Phys. 2001;64:1533. [Google Scholar]
- 11.Maulini R, Beck M, Faist J, Gini E. Appl Phys Lett. 2004;84:1659. [Google Scholar]
- 12.Yao Y, Charles WO, Tsai T, Chen J, Wysocki G, Gmachl CF. Appl Phys Lett. 2010;96:211106. [Google Scholar]
- 13.Hugi A, Terazzi R, Bonetti Y, Wittmann A, Fischer M, Beck M, Faist J, Gini E. Appl Phys Lett. 2009;95:061103. [Google Scholar]
- 14.Luo GP, Peng C, Le HQ, Pei SS, Hwang WY, Ishaug B, Um J, Baillargeon JN, Lin CH. Appl Phys Lett. 2001;78:2834. [Google Scholar]
- 15.Wysocki G, Curl RF, Tittel FK, Maulini R, Bulliard JM, Faist J. Appl Phys B. 2005;81:769. [Google Scholar]
- 16.Maulini R. Dissertation. University of Neushatel; 2006. Broadly tunable mid-infrared quantum cascade lasers for spectroscopic applications. [Google Scholar]
- 17.Peng C, Luo G, Le HQ. Appl Opt. 2003;42:4877. doi: 10.1364/ao.42.004877. [DOI] [PubMed] [Google Scholar]
- 18.Harvey KC, Myatt CJ. Opt Lett. 1991;16:910. doi: 10.1364/ol.16.000910. [DOI] [PubMed] [Google Scholar]
- 19.Hawthorn CJ, Weber KP, Scholten RE. Rev Sci Instrum. 2001;72:4477. [Google Scholar]
- 20.Tsai T, Wysocki G. Appl Phys B. 2010;100:243. doi: 10.1007/s00340-012-5075-9. [DOI] [PMC free article] [PubMed] [Google Scholar]
- 21.Saleh BEA, Teich MC. Fundamentals of Photonics. John Wiley and Sons; Hoboken: 2007. [Google Scholar]