Abstract
High-throughput microscopic screening instruments can generate huge collections of images of live cells incubated with combinatorial libraries of fluorescent molecules. Organizing and visualizing these images to discern biologically important patterns that link back to chemical structure is a challenge. We present an analysis and visualization methodology - Cheminformatic Assisted Image Array (CAIA) - that greatly facilitates data mining efforts. For illustration, we considered a collection of microscopic images acquired from cells incubated with each member of a combinatorial library of styryl molecules being screened for candidate bioimaging probes. By sorting CAIAs based on quantitative image features, the relative contribution of each combinatorial building block on probe intracellular distribution could be visually discerned. The results revealed trends hidden in the dataset: most interestingly, the building blocks of the styryl molecules appeared to behave as chemical address tags, additively and independently encoding spatial patterns of intracellular fluorescence. Translated into practice, CAIA facilitated discovery of several outstanding styryl molecules for live cell nuclear imaging applications.
Keywords: Cheminformatics, high content screening, combinatorial library, styryl, fluorescence, bioimaging, chemical address tags, QSAR, CAIA
Introduction
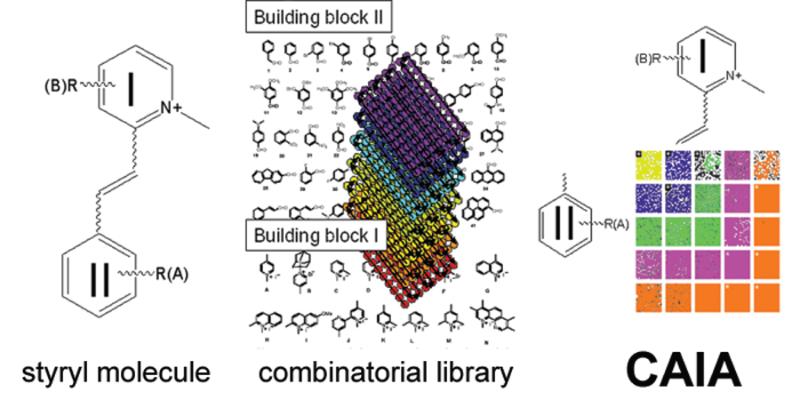
Styryl molecules are cell-permeant and fluorescent, and are a good prospective source of live cell imaging probes1. Small variations in their chemical structures often lead to large differences in subcellular localization1-4. Each styryl molecule is made of two basic building blocks conjugated to each other (Figure 1A). Because of this simple structure, building blocks at one side of the central carbon-carbon double bond can exert a constant, additive effect on properties conferred by the building block at the opposite side, and vice versa. Accordingly, the subcellular localization of styryl probes depends on their chemical structure in a manner that can be quantitatively linked back to the building blocks of the molecules4, providing useful information to elucidate structure-localization relationship5-14. With image-based, “high content” screening instruments15-18, it has become possible to use automated microscopes to acquire large amounts of microscopic image data from large collections of styryl molecules. Because of the large number of images that can be acquired, image analysis and cheminformatic tools to help manage, visualize and analyze quantitative structure-localization relationships are greatly needed, to enable prospecting for outstanding, live cell imaging probes.
Figure 1.
A 2-dimensional CAIA for visualizing hypothetical structure-localization relationships encoded in the chemical structure of styryl molecules. A) Each styryl molecule contains a pyridinium group (I) conjugated to a styryl group (II). B) A combinatorial library of styryl molecules comprises different combinations of pyridinium and styryl building blocks; each molecule is screened in individually. C) CAIAs constructed based on quantitative image features, sorted according to calculated regression score of each building block. Building blocks hypothetically behave as chemical address tags determining intracellular fluorescence intensity and distribution. This is reflected in a diagonal visual trend across the CAIA, when building blocks I and II are sorted based on their scores.
For this purpose, we present an image visualization tool that arranges images into arrays reflecting both the combinatorial nature of probe chemical structure as well as a quantitative image feature of interest. To demonstrate this, a combinatorial library of 1500 styryl molecules was synthesized and screened with a microscopic, high content screening instrument. Using a DNA-specific nuclear dye as a reference marker, machine vision techniques were used to extract three basic features associated with the cellular fluorescence signal captured by the images: total intracellular intensity; nuclear to cytoplasmic ratio; and, coefficient of variation of the pixel intensities within the nuclear region of each cell. Statistical regression analysis was used to calculate the partial contributions of both building blocks of each molecule to these quantitative visual features. Based on the calculated scores for each building block, the images were sorted and assembled into CAIAs, which organizes the image sets in a way that maps out directly to the combinatorial structure of the probes and their relative contributions to subcellular localization (Figure 1C). In this manner, relationships between combinatorial structure and intracellular visual features spanning over 1000 images became readily apparent to the human eye. This way, a highly valuable class of bioimaging probes for studying spatiotemporal RNA dynamics in the nucleoli of living cells was discovered3.
Results
A. Overview of Experimental System
The styryl library was synthesized by a condensation reaction of eight different pyridinium derivative groups (building block I) with 167 different aromatic aldehydes (building block II)1, 3. A variety of functional groups were included in the collection of building block II such as higher conjugation, electron withdrawing and donating groups, acidic and basic groups, multiple functional groups, heterocyclic structure, even polyaromatic structures. The condensation reactions were accelerated by microwave irradiation for three minutes catalyzed by pyrrolidine.
Many styryl molecules possess excitation and emission spectra orthogonal to common nuclear counterstains, allowing two images to be acquired: a Hoechst image to capture the position of each nucleus, and a styryl image1, 4. Prior to image acquisition, live Hela cells growing in 96 well plates were incubated with the fluorescent probes during which time they reach steady state distribution. For image acquisition, the plate was transferred into the environmental control chamber of a Cellomics KineticScan high content screening instrument (Cellomics, Inc.; Pittsburgh, PA), and images were acquired in the presence of extracellular dye. Afterwards, the dye was removed from the extracellular medium and the plate was scanned once more so as to be able to compare the intracellular probe distribution in steady state and efflux conditions, based on the presence and absence of extracellular dye.
B. CAIA assembly based on total intracellular signal
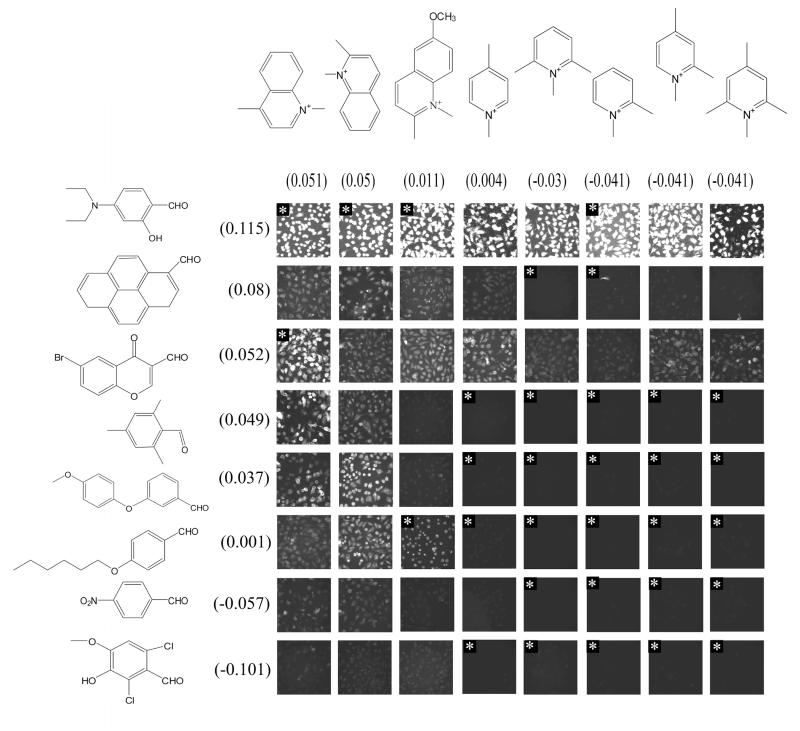
Because each building block I is combined to every building block II, a quantitative image feature obtained from the microscopic images can be related to the individual building blocks, using a statistical regression approach4. The goal is to identify a simple additive contribution from each building block to a given image feature. We found that, to a significant extent, building blocks I and II additively encode the total cell-associated pixel intensity of the styryl probes within each cell. The correlation coefficient between the empirically determined structure scores (the sum of scores for the two building blocks in a particular molecule) and log transformed total cellular intensity (LTCI) was 0.64 for steady state and 0.60 for efflux. In 300 random permutations of LTCI, the average correlation between structure scores and randomized LTCI was 0.5 (steady state) and 0.49 (efflux), and none of the 300 randomizations yielded correlations as high as the observed values of 0.64 and 0.60. A CAIA was constructed with a set of representative building blocks, sorting individual images according to the quantitative contribution of each building block. The expected trend in LTCI can be observed, from the brightest cells at one corner to darkest cells at the opposite (Figure 2). In this CAIA, images at the top-left correspond to styryl molecules whose building blocks are much more strongly associated with intracellular probe fluorescence compared to the others. We note that images excluded from the regression, based on complete lack of measurable fluorescence or signal saturation, are accurately predicted by the regression scores (Figure 2).
Figure 2.
Intracellular fluorescence CAIA sorted by the contribution of each building block to the total integrated intensity of pixels within each cell. Note that many flagged images excluded from the regression score calculation are classified correctly.
C. CAIA assembly based on nuclear/cytoplasmic signal
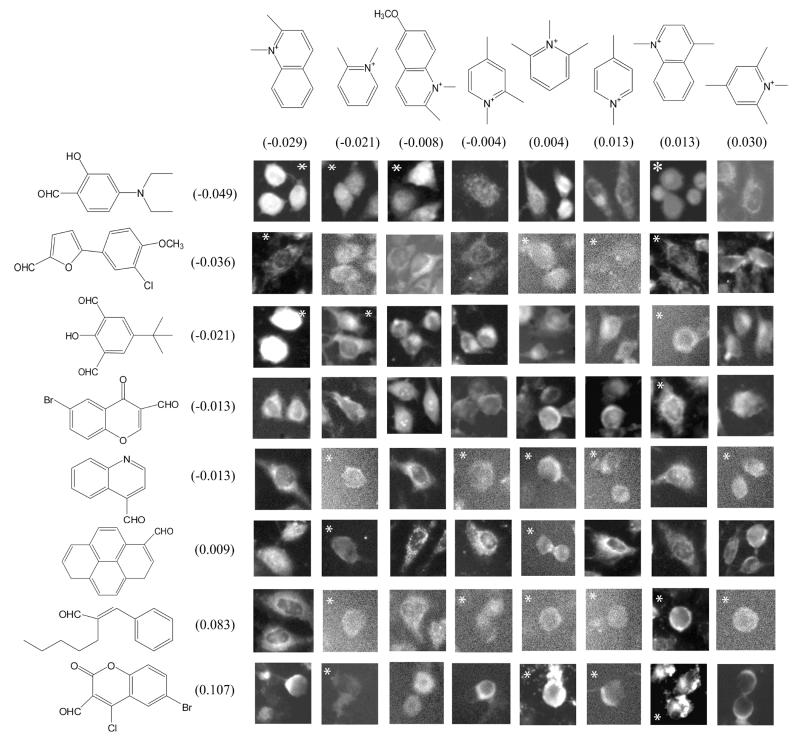
Next, spatial analysis of subcellular fluorescence localization focused on discriminating signal localization in the cell nucleus vs. cytoplasm19. In the CAIA framework, this analysis succeeds to the extent that relative pixel intensity in the cell nucleus compared to the cytoplasm is additively encoded by building blocks I or II. Using the CAIA approach, the contribution of each building block I and II to the log transformed nuclear/cytoplasmic fluorescence ratio (LNCR) was calculated across the entire library. The correlation coefficient between the optimal structure scores and LNCR was 0.68 for steady state and 0.65 for efflux. In 300 random permutations of LNCR, the average correlation between structure scores and randomized LNCR was 0.5 (steady state) and 0.49 (efflux), and none of the 300 randomizations yielded correlations as high as the observed values of 0.68 and 0.65. Assembling the CAIA based on the LNCR feature reveals the expected trend, with the cells harboring the brightest nuclei (high N/C ratio) at the upper left hand corner, and cells harboring the darkest nuclei (low N/C ratio) at the bottom right (Figure 3). Upon close examination, at least four images of the top row of the LNCR CAIA show cells bright in the center (nucleus) relative to the periphery, while at least four images on the two bottom rows of the CAIA show cells with a dark center (nucleus) and a bright cytoplasmic ring at the periphery.
Figure 3.
Nuclear vs. cytoplasmic localization CAIA sorted by the contribution of each building block to the ratio of integrated pixel intensities over nuclear and cytoplasmic compartments. Note that many flagged images excluded from the regression score calculation are classified correctly –including the top three images with the brightest nuclei.
By visual inspection, cells that have high nuclear fluorescence in the presence of extracellular dye appeared to lack nuclear fluorescence when extracellular dye was removed. Thus, there are two components to styryl localization in nucleus vs. cytoplasm: a steady state component that favors localization to the cell nucleus in the presence of extracellular dye, and a non-steady state component that favors retention in the cytosol but efflux from the cell nucleus in the absence of extracellular dye. Thus, the additivity in the N/C ratio mostly reflects the nuclear localization component observed in the presence of extracellular dye.
D. CAIA assembly based on the heterogeneity of the nuclear signal
To determine signal localization to specific intranuclear features such as nucleoli, we used the coefficient of variation19 of pixels in the nucleus as a measure of the degree of spatial variability associated with the nuclear signal. Presumably, images showing bright and dark spots of fluorescence within the nucleus are indicative of localization of probe at discrete sites, yielding a high coefficient of variation measurement over the nuclear region of the images. Conversely, images showing diffuse fluorescence signal throughout the nucleus reflect probes that are homogeneously distributed throughout the nucleus.
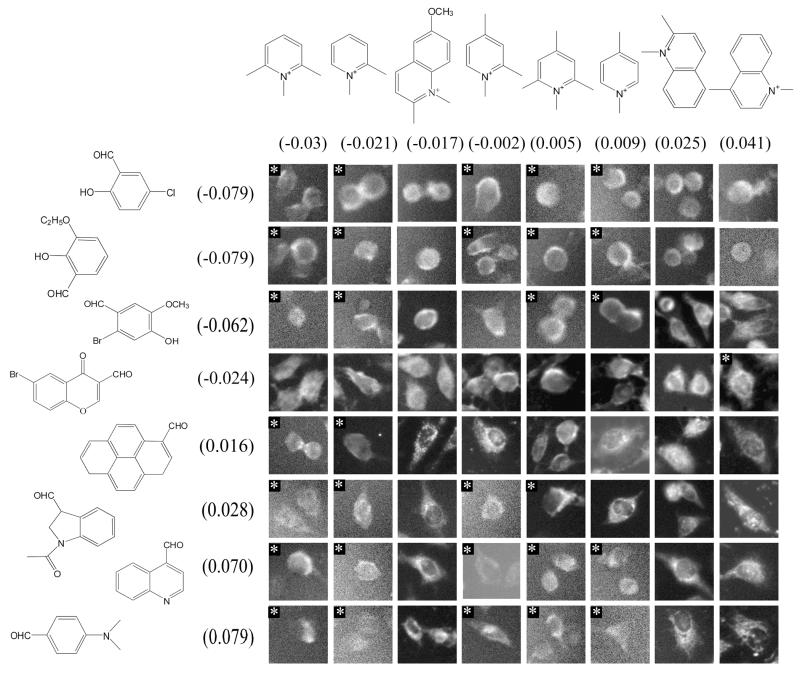
Using the CAIA framework, the correlation between the fitted structure score and log transformed nuclear CV (LNCV) was 0.66 under steady state conditions and 0.53 under efflux conditions. In 300 random permutations of LNCV, the average correlation between structure scores and randomized LNCV was 0.5 (steady state) and 0.49 (efflux). None of the 300 randomizations yielded correlations as high as the actual steady state correlation, but 23 of the 300 randomizations of efflux data yielded correlations exceeding 0.53 Evidently, CV additivity is lost if cells are placed in efflux conditions, consistent with the decrease in nuclear staining described above. The trend in CV is readily apparent when the sorted CAIA was visually inspected (Figure 4). For example, the top three rows and three left-most columns of the CAIA have at least six images in which the center of the cell (the nucleus) is flat and grey. On the other hand, the rows and columns at the bottom right quartile of the CAIA reveal localized fluorescence hotspots over the central, nuclear region of each cell.
Figure 4.
Subnuclear localization CAIA sorted by the contribution of each building block to the coefficient of variation of integrated pixel intensities within the nuclear region of each cell. Note that many flagged images excluded from the regression score calculation are classified correctly.
E. Discovery of RNA-binding nucleolar staining dyes
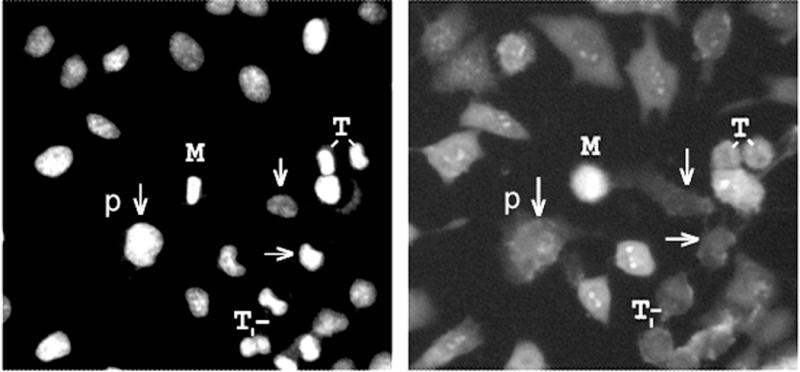
Inside the nucleus there are three major macromolecular components: DNA, RNA and protein. Unlike the cytoplasm, nuclei are devoid of internal membranes. Furthermore, because nuclei are labeled with the DNA-specific Hoechst dye, it is possible to distinguish a DNA-binding from an RNA- or protein-binding dye. Zooming into the images, it appeared as if the high signal intensity, high N/C ratio and high nuclear CV reflected localization to nucleoli. This was supported by the expected cell-cycle dependent pattern of nucleolar organization, apparent in some of the images (Figure 5). Following up on this discovery, several styryl molecules were independently validated as RNA-binding, live cell nucleolar imaging probes3.
Figure 5.
Zooming into cell cycle-dependent DNA-styryl probe localization patterns indicative of nucleolar staining. The left panel is the Hoechst channel image reflecting DNA distribution, and the right panel is the styryl image. Cells in different stages of the cell cycle are indicated (p: prophase; M: metaphase; t: telophase). Unlabeled cells are in interface, and exhibit clear nucleolar staining and diffuse cytoplasmic staining suggestive of a selective RNA-binding probe. Interestingly, some interphase cells do not exhibit nucleolar staining (arrows), suggesting cell to cell variations in nucleolar structure
Discussion
CAIA is a data visualization and analysis method that enables rapid perception of relationships between chemical structures of styryl molecules and spatial patterns of subcellular fluorescence distribution. These patterns could not realistically be appreciated by serially viewing the thousands of microscopic images in an unorganized sequence. In the present example, CAIAs sort the images along two axes based on the differential contribution of each member of the two families of building blocks to the intracellular staining patterns. CAIAs allow images to be organized in an intuitive manner that directly maps out the chemical structure of the fluorescent molecules, so relationships between chemical structure and subcellular distribution can be readily visualized. The observed relationships are suggestive of specific interactions between probe structure and subcellular organelles, which can be validated in subsequent, biochemical and higher resolution imaging studies. CAIAs can be integrated with fully automated platforms for acquiring and analyzing image data.
Previously, quantitative-structure localization relationships were discovered in the styryl library by applying statistical regression approach to elucidate predictive relationships between chemical structure of small molecules and visual calls made by a human observer4. Yet, quantitative spatial analysis algorithms for detecting subcellular localization patterns from microscopic image data are scalable, adaptable and generally more accurate, objective, reproducible and less cumbersome than visual calls20-27. To assist manual screening by expert human observers, CAIAs display the images in an intuitive manner, and reveal trends occurring across large data sets that may not be so obvious to the naked eye. CAIAs interface cutting-edge robotic, machine vision, cheminformatic analysis with human intelligence – a formidable data mining tool. Also, we note that the CAIA framework could easily be used to organize a set of microscopic images along any pair of axes derived from the chemical structures. For example, two different physicochemical properties derived from the styryl molecules could be used. This would be especially useful to reduce the dimensionality of the combinatorial library, as well as to elucidate quantitative relationships between physicochemical properties and the patterns of intracellular fluorescence.
In conclusion, CAIAs facilitate cheminformatic analysis of large datasets of images obtained from fluorescent small molecules localizing to different subcellular compartments. CAIAs have proved useful for discovering highly valuable live cell nucleolar imaging probes, and should be readily adaptable for discovering other different types of bioimaging molecules.
Methods
Chemical Library Synthesis and Screening
Styryl library synthesis was already reported1, 3 A total of 167 aldehydes were used for building block II and 8 pyridinium derivatives were used for building block I. Live cell imaging experiments19 were performed on HeLa cells growing on plastic bottom 96 well plates (Falcon). Cells were plated overnight at a density of 5,000 to 10,000 cells per well, in Phenol Red-free RPMI 1640 plus 10% fetal bovine serum (cell culture medium). Cells were incubated with 1 μl of 10 mg/ml DMSO-dye stock diluted in 100 μl culture medium. Hoechst 33342 (2 μM) was used as a nuclear counterstain for all the experiments. Images were acquired with the 20X objective of the KineticScan instrument. Plates were scanned using the hardware autofocus device to minimize exposing the cells to damaging light100, 101. To keep cells alive and healthy, the instrument’s environmental chamber was kept at 37C, 5%CO2. Microscopic images were acquired with the DAPI (<50 millisec exposure), FITC (100 and 1000 millisec exposure), TRITC (100 and 1000 millisec exposure), and Cy5 (1000 millisec exposure).
Image Data Handling
CellomicStore database handled data during the acquisition phase of the experiment and Cellomics Dataviewer was used to visually inspect the images for artifacts during acquisition. For machine vision and cheminformatic analysis, all images were transferred from CellomicsStore to a local hard drive. Analysis was performed offline, using image analysis and visualizing scripts written in Python. Low level image analysis routines from the Python Numaray and image library were used for object identification.
Selection of images for regression analysis
Images acquired from probes lacking a detectable fluorescence signal were excluded from analysis. Probes with fluorescent signal were detected by comparing the relative change in the background pixel intensities in the 1 sec and 200 millisec exposures in the presence and absence of fluorescent probes. For each well, a nuclear mask was constructed by applying a threshold to the Hoechst channel so as to define each nucleus. Next, a cell mask was constructed by dilating the nuclear mask five pixels, and a background mask was constructed by taking the complement of the nuclear mask dilated by 10 pixels. Least squares regression was then used to compare background pixel intensities in the 1sec and 200 millisec exposures, using only pixels below 4000 units in intensity. If the slope of 1 sec vs. 200 millisec pixel intensities for the regression was less than or equal to the slope of negative control, unlabeled cells in a specific channel, the probe was deemed non-fluorescent on that channel.
Next, images with cellular labeling at or below the extracellular background fluorescence, or showing extensive saturation of pixel intensities, were also excluded from regression analysis. Specifically, images with fewer than 100 pixels in both the cell and nuclear masks, or with a ratio below 1.2 between the 75th percentile of pixels in the cell mask and the median of pixels in the background mask were not analyzed. Last, Images with more than 5000 pixels with intensity greater than 4000 (extensive saturation) were not analyzed.
Out of 13824 FITC and TRITC images obtained at 1s and 200 millisec exposure times, and under steady state and efflux conditions, 2231 passed all the above filtering. The remaining images were screened manually to identify various types of artifacts, such as dye precipitates and out-of-focus errors. Lastly, we removed compounds whose building block II in the combinatorial structure occurred in the image set in combination with less than 3 different building block I for the same experimental condition (either in the presence or absence of extracellular dye). This left 488 1s exposure images acquired in the presence of extracellular dye, and 540 efflux 1s exposure images acquired in the absence of extracellular dye (including both FITC and TRITC channel images) for analysis.
Construction of basic image features
A cytoring region19 (comprising the perinuclear region around each cell) was constructed by taking the intersection of the cell mask with the complement of the nuclear mask. Distinct objects were identified, and the number of topological holes covering more than 5 pixels within each cytoring was calculated. Cytorings that did not have a single such hole and cytorings touching the edge of the image were disregarded. A cytoring was also disregarded if the nuclear region contained more than 500 or fewer than 100 pixels, if the cytoring area contained fewer than 100 pixels, or if any pixel in the cytoring had intensity 4095 (the maximum possible value for a 12-bit image).
Next the coefficient of variation and integrated intensity were calculated for each cytoring and nuclear mask object. Integrated intensities were background adjusted by subtracting the background median for the whole image times the number of pixels in the object, truncating at zero. The ratio of the background corrected integrated nuclear and cytoring intensities was then calculated, henceforth called “nuclear-to-cytoplasmic ratio” or N/C ratio (if the background corrected cytoplasmic intensity was non-positive, the cell was disregarded). Integrated cellular intensities were calculated by summing the background corrected total intensities for the cytoring and nuclear regions of each cell. The median values for total cellular intensity, nuclear CV, and N/C ratio were calculated across all objects in the image, and used as the primary image-level features for analysis.
Identification of additive image features
To evaluate the additive effect of styryl building blocks I and II on each image feature, we used linear regression. For a given image feature Y (one of total cellular intensity, N/C ratio, nuclear CV), the linear model log(Y) = α(i) + β(j) was fit, where i is the index of building block I and j is the index building block II. The regression design matrix was reduced to an orthogonal matrix consisting of the left singular vectors of the original design matrix having singular value greater than 0.1. This had the effect of reducing the number of regressors from 189 (the total number of A and B groups) to 173 for images acquired in the presence of extracellular dye and to 167 for images acquired in the absence of extracellular dye.
Next, fitted values for log(Y) were calculated and the Pearson correlation coefficient between the fitted and observed log-scale image feature was used to measure the quality of the additive fit. Randomization was used to assess the whether the fit quality was better than expected by chance. The image feature data was randomly permuted and the whole fitting process was repeated 300 times for data acquired in the presence and absence of extracellular dye, for each image feature. The proportion of the 300 randomized fits giving greater correlation between observed and fitted values than the actual data was used as an empirical p-value. The average of the fitted versus observed correlation coefficients for randomized data were also recorded.
CAIA assembly
Regression coefficients from the reduced fit were mapped back to the full design space to produce estimates of the α(i) and β(j) parameters for each image feature. Arranging the images into a two-dimensional array based on sorted α(i) and β(j) values allowed for visual assessment of how the additive relationship between combinatorial structure and quantitative image data was capturing the subcellular distribution of the probes.
Representative images (Figure 2) or zoom in pictures of individual cells within each image (Figure 3 and 4) where copied and pasted from the original raw image file into an 8 × 8 image CAIA, using Adobe Photoshop, after converting the 12-bit raw .dib KHCS output files into standard 8-bit .tifs. For figure 2, raw, unscaled images were used, from TRITC channel, 1 sec exposure acquistion. For figure 3 and 4, each representative cell image was scaled one-at-a time, so that the minimium pixel intensity value is 0 (black) and the maximum pixel intensity value is at pixel saturation (white). Images that were excluded from regression analysis to calculate group scores (because of saturation, lack of signal, dye precipitates or other artifacts) were included in the final CAIAs and flagged with an asterisk, allowing visual assessment of the predictive power of the regression scores.
Acknowledgements
This work has been supported by NIH grants P20HG003890, RO1GM078200 and NSF grant CHE-0449139 to KS, GRR and YTC, respectively. We would like to thank P. Matsudaira and J. Evans for access to the KineticScan Instrument at the Whitehead Institute Bioimaging Facility.
References
- 1.Rosania GR, Lee JW, Ding L, Yoon HS, Chang YT. Combinatorial approach to organelle-targeted fluorescent library based on the styryl scaffold. J Am Chem Soc. 2003;125:1130–1131. doi: 10.1021/ja027587x. [DOI] [PubMed] [Google Scholar]
- 2.Lee JW, Jung M, Rosania GR, Chang YT. Development of novel cell-permeable DNA sensitive dyes using combinatorial synthesis and cell-based screening. Chem Commun (Camb) 2003:1852–1853. doi: 10.1039/b303960a. [DOI] [PubMed] [Google Scholar]
- 3.Li Q, et al. RNA-selective, live cell imaging probes for studying nuclear structure and function. Chem. Biol. 2006 doi: 10.1016/j.chembiol.2006.04.007. in press. [DOI] [PubMed] [Google Scholar]
- 4.Shedden K, Brumer J, Chang YT, Rosania GR. Chemoinformatic analysis of a supertargeted combinatorial library of styryl molecules. J Chem Inf Comput Sci. 2003;43:2068–2080. doi: 10.1021/ci0341215. [DOI] [PubMed] [Google Scholar]
- 5.Bennion PJ, Horobin RW. Some effects of salts on staining: use of the Donnan equilibrium to describe staining of tissue sections with acid and basic dyes. Histochemistry. 1974;39:71–82. doi: 10.1007/BF02428553. [DOI] [PubMed] [Google Scholar]
- 6.Colston J, Horobin RW, Rashid-Doubell F, Pediani J, Johal KK. Why fluorescent probes for endoplasmic reticulum are selective: an experimental and QSAR-modelling study. Biotech Histochem. 2003;78:323–332. doi: 10.1080/10520290310001646659. [DOI] [PubMed] [Google Scholar]
- 7.Horobin RW. Biological staining: mechanisms and theory. Biotech Histochem. 2002;77:3–13. [PubMed] [Google Scholar]
- 8.Horobin RW. Structure-staining relationships in histochemistry and biological staining. I. Theoretical background and a general account of correlation of histochemical staining with the chemical structure of the reagents used. J Microsc. 1980;119:345–355. doi: 10.1111/j.1365-2818.1980.tb04106.x. [DOI] [PubMed] [Google Scholar]
- 9.Horobin RW, Flemming L. Structure-staining relationships in histochemistry and biological staining. II. Mechanistic and practical aspects of the staining of elastic fibres. J Microsc. 1980;119:357–372. doi: 10.1111/j.1365-2818.1980.tb04107.x. [DOI] [PubMed] [Google Scholar]
- 10.Horobin RW, Rashid F. Interactions of molecular probes with living cells and tissues. Part 1. Some general mechanistic proposals, making use of a simplistic Chinese box model. Histochemistry. 1990;94:205–209. doi: 10.1007/BF02440189. [DOI] [PubMed] [Google Scholar]
- 11.Rashid F, Horobin RW. Accumulation of fluorescent non-cationic probes in mitochondria of cultured cells: observations, a proposed mechanism, and some implications. J Microsc. 1991;163(Pt 2):233–241. doi: 10.1111/j.1365-2818.1991.tb03175.x. [DOI] [PubMed] [Google Scholar]
- 12.Rashid F, Horobin RW. Interaction of molecular probes with living cells and tissues. Part 2. A structure-activity analysis of mitochondrial staining by cationic probes, and a discussion of the synergistic nature of image-based and biochemical approaches. Histochemistry. 1990;94:303–308. doi: 10.1007/BF00266632. [DOI] [PubMed] [Google Scholar]
- 13.Rashid F, Horobin RW, Williams MA. Predicting the behaviour and selectivity of fluorescent probes for lysosomes and related structures by means of structure-activity models. Histochem J. 1991;23:450–459. doi: 10.1007/BF01041375. [DOI] [PubMed] [Google Scholar]
- 14.Trapp S, Horobin RW. A predictive model for the selective accumulation of chemicals in tumor cells. Eur Biophys J. 2005 doi: 10.1007/s00249-005-0472-1. [DOI] [PubMed] [Google Scholar]
- 15.Abraham VC, Taylor DL, Haskins JR. High content screening applied to large-scale cell biology. Trends Biotechnol. 2004;22:15–22. doi: 10.1016/j.tibtech.2003.10.012. [DOI] [PubMed] [Google Scholar]
- 16.Galbraith W, et al. Imaging cytometry by multiparameter fluorescence. Cytometry. 1991;12:579–596. doi: 10.1002/cyto.990120702. [DOI] [PubMed] [Google Scholar]
- 17.Giuliano KA, Chen YT, Taylor DL. High-content screening with siRNA optimizes a cell biological approach to drug discovery: defining the role of P53 activation in the cellular response to anticancer drugs. J Biomol Screen. 2004;9:557–568. doi: 10.1177/1087057104265387. [DOI] [PubMed] [Google Scholar]
- 18.Giuliano KA, Haskins JR, Taylor DL. Advances in high content screening for drug discovery. Assay Drug Dev Technol. 2003;1:565–577. doi: 10.1089/154065803322302826. [DOI] [PubMed] [Google Scholar]
- 19.Chen VY, Khersonsky SM, Shedden K, Chang YT, Rosania GR. System dynamics of subcellular transport. Mol Pharm. 2004;1:414–425. doi: 10.1021/mp049916t. [DOI] [PubMed] [Google Scholar]
- 20.Hu Y, Murphy RF. Automated interpretation of subcellular patterns from immunofluorescence microscopy. J Immunol Methods. 2004;290:93–105. doi: 10.1016/j.jim.2004.04.011. [DOI] [PubMed] [Google Scholar]
- 21.Huang K, Murphy RF. From quantitative microscopy to automated image understanding. J Biomed Opt. 2004;9:893–912. doi: 10.1117/1.1779233. [DOI] [PMC free article] [PubMed] [Google Scholar]
- 22.Murphy RF. Location proteomics: a systems approach to subcellular location. Biochem Soc Trans. 2005;33:535–538. doi: 10.1042/BST0330535. [DOI] [PubMed] [Google Scholar]
- 23.Murphy RF, Boland MV, Velliste M. Towards a systematics for protein subcelluar location: quantitative description of protein localization patterns and automated analysis of fluorescence microscope images. Proc Int Conf Intell Syst Mol Biol. 2000;8:251–259. [PubMed] [Google Scholar]
- 24.Swedlow JR, Goldberg I, Brauner E, Sorger PK. Informatics and quantitative analysis in biological imaging. Science. 2003;300:100–102. doi: 10.1126/science.1082602. [DOI] [PMC free article] [PubMed] [Google Scholar]
- 25.Boland MV, Murphy RF. A neural network classifier capable of recognizing the patterns of all major subcellular structures in fluorescence microscope images of HeLa cells. Bioinformatics. 2001;17:1213–1223. doi: 10.1093/bioinformatics/17.12.1213. [DOI] [PubMed] [Google Scholar]
- 26.Murphy RF. Automated interpretation of protein subcellular location patterns: implications for early cancer detection and assessment. Ann N Y Acad Sci. 2004;1020:124–131. doi: 10.1196/annals.1310.013. [DOI] [PubMed] [Google Scholar]
- 27.Roques EJ, Murphy RF. Objective evaluation of differences in protein subcellular distribution. Traffic. 2002;3:61–65. doi: 10.1034/j.1600-0854.2002.30108.x. [DOI] [PubMed] [Google Scholar]


