

Over the last decade, the genome-wide study of both heritable and somatic human variability has gone from a theoretical concept to a broadly implemented, practical reality, covering the entire spectrum of human disease. Although several findings have emerged from these studies1, the results of genome-wide association studies (GWAS) have been mostly sobering. For instance, although several genes showing medium-to-high penetrance within heritable traits were identified by these approaches, the majority of heritable genetic risk factors for most common diseases remain elusive2–7. Additionally, due to impractical requirements for cohort size8 and lack of methodologies to maximize power for such detections, few epistatic interactions and low-penetrance variants have been identified9. At the opposite end of the germline versus somatic event spectrum, considering that tumor cells abide by the same evolutionary fitness principles but on accelerated timescales due to mutator phenotypes, extensive somatic genomic rearrangements in solid tumors10 yield so many alterations that distinguishing ‘drivers’ from ‘passengers’ has been challenging.
This raises the question of whether GWAS data sets could yield additional insight when combined with other data modalities. Indeed, a number of previous studies have integrated significant genotype-phenotype associations with databases of gene annotations, such as the Gene Ontology (GO)11, MSigDB12 or the Kyoto Encyclopedia of Genes and Genomes (KEGG)13. The goal of these studies is to recognize higher-order structure within the data through the aggregation of loci in genes with similar functions or that are in the same pathway.
The context-specific networks of molecular interactions that determine cell behavior provide a particularly relevant framework for the integration of data from multiple ‘omics’. The rationale is straightforward: within the space of all possible genetic and epigenetic variants, those contributing to a specific trait or disease likely have some coalescent properties, allowing their effect to be functionally canalized via the cell communication and cell regulatory machinery that allows distinct cells to interact and regulates their behavior. Notably, contrary to random networks, whose output is essentially unconstrained, regulatory networks produced by adaptation to specific fitness landscapes are optimized to produce only a finite number of well-defined outcomes as a function of a very large number of exogenous and endogenous signals. Thus, if a comprehensive and accurate map of all intra- and intercellular molecular interactions were available, then genetic and epigenetic events implicated in a specific trait or disease should cluster in subnetworks of closely interacting genes.
Thus, if regulatory networks controlling cell pathophysiology were known a priori, one could systematically reduce the number of statistical association tests between genomic variants and the trait or disease of interest by considering only events that cluster within regulatory networks, as topologically related events would be more likely to produce related phenotypic effects. Such a pathway-wide association study (PWAS) strategy14 may improve our ability to distinguish signals from background noise by mitigating the need to account for a large number of multiple-hypothesis testing. In general, however, the molecular pathways governing physiological and disease-related traits are poorly characterized. Indeed, the classical notion of a relatively linear and interpretable set of regulatory pathways should be revisited in light of the dynamic, multiscale, context-specific nature of gene regulatory networks. We thus favor an alternative approach requiring the simultaneous reconstruction of context-specific gene regulatory networks15 as well as of the genetic and epigenetic variability they harbor. We call this second strategy integrative network-based association studies (INAS) and suggest that INAS will become increasingly valuable as the context-specific logic of gene regulatory networks is further elucidated.
In this Perspective, we explore current advances in PWAS and INAS research, inspired by a regulatory network–oriented view of traits and disease, and examine future directions that are being pursued within the emerging community of systems geneticists. We explore how networks (and pathway motifs within them) can be reconstructed and validated and how they may provide a valuable integrative framework within which to interpret GWAS results as well as other data on genetic and epigenetic variation.
This is not my beautiful pathway
An increasing body of evidence suggests that canonical pathways are incomplete and largely inaccurate models for studying the complex interplay of signal transduction, transcriptional, post-transcriptional, metabolic and other regulatory events that determine cell behavior. Even today, entirely new classes of molecular entities (for example, long intergenic non-coding RNAs (lincRNAs))16 and interactions (for example, microRNA-mediated interactions)17 are being discovered and shown to have critical impact on cell regulation. Pathway models represented as linear chains of events provide ready visualization and the opportunity for intuitive predictions that can be experimentally tested in a manageable number of experiments. Unfortunately, cell regulation is anything but linear and is instead determined by complex, multivariate interactions that are not amenable to visual intepretation. For instance, individual transcription factors may regulate hundreds to thousands of cell context–dependent targets18,19, with functional specificity achieved by combinatorial transcription factor interactions20,21. For instance, FOXM1 and MYB individually regulate the transcription of more than 1,000 distinct genes in human B cells. Yet, the ~100 targets they co-regulate are exquisitely specific to germinal center formation20 (Fig. 1a), in contrast to those uniquely regulated by each transcription factor. Similarly, transcription factor activity is modulated by hundreds of signal transduction proteins22, whose availability is again context specific. A map of expressed transcription factors in human B cells and of their computationally inferred modulators is shown in Figure 1b. Many of these interactions were experimentally validated, indicating that such a level of complexity is realistic. Additionally, recent large-scale screens for protein-protein interactions in human cells23 suggest that the number of such interactions is orders of magnitude larger than the few thousand captured in canonical pathways. Finally, adding yet another level of complexity, causal dependencies between the genetic, regulatory and functional layers provide insight into the mechanisms by which genetic variation may affect the activity of entire constellations of transcription factors, which in turn regulate thousands of genes11,24–29 (Fig. 2).
Figure 1.

Examples of transcriptional and post-translational regulatory networks in human B cells. (a) FOXM1 and MYB co-regulation network from the Human B Cell Interactome. Red and blue represent over- and underexpression of genes, respectively, in centroblast versus naïve germinal centers (t test, false discovery rate < 0.05). Blue arcs represent protein-protein interactions. Adapted from reference 20. (b) Visualization of the molecular interaction network of signaling molecules and transcription factors in mature human B cells. Adapted from reference 22.
Figure 2.
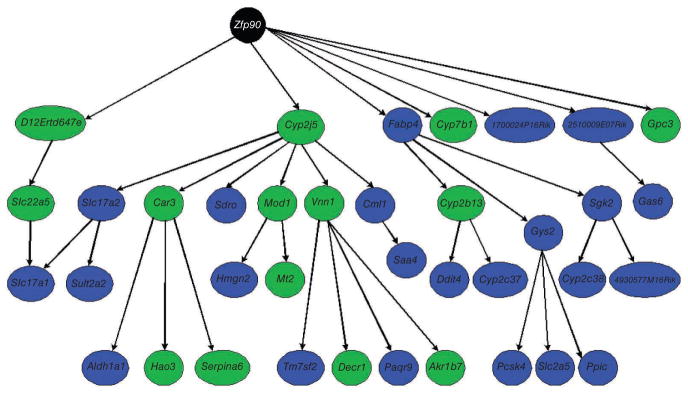
Genetic subnetwork controlled by Zfp90 (black node) as a central node in the liver transcriptional network. This subnetwork was obtained from a full liver expression network by identifying all nodes that were downstream of the Zpf90 node, within a path length of 3. Nodes highlighted in green represent genes that were validated as causal for fat mass. Adapted from ref. 26.
As discussed, such intrinsic complexity is made even more daunting by the context-specific nature of cell regulation. For instance, the oncogenic effect of genetic lesions depends both on cell type and microenvironment30. Finally, the paracrine and endocrine molecular interactions that allow distinct cell types and even whole organs to communicate form the highest-order networks in living organisms, directly affecting their physiological and pathological states and forcing the study of some diseases in their non–cell autonomous context. For instance, obesity and type 2 diabetes may result from failures in distinct organ systems. Similarly, insulin signaling in osteoblasts has been shown to be necessary for whole-body glucose homeostasis31. Thus, examination of networks spanning multiple tissues becomes critical to highlight interactions that would be otherwise invisible within individual tissue networks15. These examples suggest that molecular networks capable of predicting whole-system behavior will require both de novo reconstruction of molecular interactions within each cellular context of interest and novel modeling approaches that explicitly represent interactions within a hierarchy of scales and across the full range of cellular compartments that define the physiological states relevant to a disease phenotype32.
Reverse engineering of cellular networks
Until recently, experimental elucidation of a protein kinase substrate or transcription factor target may have required a year of bench work. As regulatory networks in eukaryotes seem to comprise hundreds of thousands of interactions23,33,34—both context-specific35 and dynamic34,36,37—dissecting them with sufficient accuracy, coverage and context specificity may thus seem to be an unrealistic goal. Yet, the field of high-throughput computational and experimental reverse engineering was born precisely to address this challenge.
Experimentally, over the last few years, large-scale, high-throughput efforts have already produced critical data sets. These have been used as a scaffold for the assembly of molecular interaction networks, thus providing the first insight into the architecture of the cell, tissues and even whole systems38. For example, protein-protein interactions have been dissected using the yeast two-hybrid (Y2H) system or tandem affinity purification and mass spectrometry (TAP–MS)23. Similarly, transcription factor–binding sites have been mapped using genome-wide chromatin immunoprecipitation approaches (ChIP-chip39 and ChIP-seq40). Physical interactions can also be measured in vitro with DNA or protein arrays, which have been used to identify transcription factor–binding sites41,42 and the substrates of kinases43. Although interactions characterized by high-throughput experimental methods generally have high false positive and false negative rates and are unlikely to generalize to cellular contexts other than the one in which they were ascertained, they nonetheless provide an initial, albeit sparse, snapshot of regulatory networks, especially when integrated with other types of data that can help contextualize individual interactions28.
Complementing such high-throughput approaches, computational reverse-engineering algorithms have recently achieved accuracy and sensitivity comparable with those obtained by their experimental counterpart, at a fraction of the cost and time requirements. Computational methods for reverse engineering cellular networks were first developed for the study of prokaryotes and lower eukaryotes44–46 and have more recently become highly successful in reconstructing the transcriptional33, post-translational34,47,48, post-transcriptional49, metabolic50 and protein-complex20 logic of human cells, as well as in elucidating the dependence of such logic on the genetic information and variability encoded in the DNA molecule26–28,51,52. Moreover, the combined use of multiple evidence sources has been particularly effective in reconstructing accurate, high-coverage regulatory models20,57,58 and in integrating multiple layers of regulation within cellular networks. Taken together, these computational and experimental approaches are paving the road to regulatory network–based studies of human disease27,53–56.
Computational methods all rely, in one way or another, on measuring changes in distinct molecular moieties (for example, RNAs or proteins) as a response to either endogenous or exogenous perturbations. The former include, for instance, differences in kinetic constants caused by the genotypic variability between individuals or the different spectra of genetic lesions associated with particular tumor phenotypes53. The latter include small-molecule59, RNA interference (RNAi) and environmental perturbations60, such as differences in temperature, nutrients or culture medium, among many others. In fact, several methods have been described that specifically use perturbations to infer regulatory networks60,61 or to interrogate them to infer drug sensitivity62, resistance63 and mechanism of action35,46. Monitoring network states over time provides another systematic variability source for causal inference64,65.
Finally, functional rather than physical interactions, such as the genetic interactions that define the combinatorial relationships between genes and phenotypes, constitute another valuable knowledge layer. In model organisms, such as yeast, genetic interaction networks are being systematically measured through synthetic lethality screens66, while, in higher eukaryotes, genetic interactions can be explored by a variety of combinatorial RNAi67 and RNAi-based screening approaches68. In the absence of previous information, however, de novo identification of such epistatic interactions from GWAS data is greatly limited by lack of statistical power, although emerging methods are beginning to address this limitation9,69.
Examples of PWAS and INAS approaches
In the following, we discuss a few illustrative examples of PWAS and INAS approaches that have successfully identified genes whose genetic alteration or functional dysregulation induces specific phenotypes.
Canonical pathway analysis
Canonical pathways are compact representations of literature-based knowledge about regulatory interactions. Although their representation is largely incomplete and lacks context specificity, it provides visual access to a collection of molecular interaction facts that have led to the elucidation of important biological mechanisms.
Some of the most accurate pathway models represent immunology-related signaling cascades. These have been used to identify genetic alterations in lymphomagenesis. For instance, integration of the nuclear factor (NF)-κB pathway and targets with GWAS data from a large collection of diffuse large B-cell lymphoma (DLBCL) samples led to the identification of the NF-κB nuclear complex as the key integrator of a spectrum of upstream genetic alterations characterizing the more aggressive activated B cell–like (ABC) subtype of the disease from its germinal center B cell–like (GC) counterpart70,71. These included several genes in the B-cell receptor (BCR) and other signal transduction pathways, such as CARD11, TNFAIP3, TRAF2, TRAF5, MAP3K7 and TRANK1, among others. Unexpectedly, whereas NFKB1, NFKB2, RELA, RELB and REL harbor no genetic alterations in ABC DLBCL tumors, the NF-κB nuclear complex constitutes a key non-oncogene addiction for this subtype70.
Pathways assembled by automated literature data mining approaches have also been useful in the study of genetic predisposition to several human diseases72.
Integrative genomics
There is abundant literature on cellular network analysis, including of protein-protein and protein-DNA interactions, to identify ‘expression-activated modules’ from gene expression data9,20,35,53,73–75. These are sets of proteins enriched for both network interaction and co-expression across several conditions; they allow the thousands of interactions in a typical cellular network to be reduced to a handful of small, differentially activated modules. Dysregulated gene set analysis via subnetworks (DEGAS) and interactome dysregulation enrichment analysis (IDEA) represent recent examples of tools for identifying connected subnetworks enriched in genes or interactions that are dysregulated in a disease or following chemical perturbations35,76. In Parkinson’s disease, DEGAS identified mRNA splicing, cell proliferation and the 14-3-3 complex as candidate disease-progression mediators. In B-cell lymphoma, IDEA identified validated genetic alterations in chronic lymphocytic leukemia and follicular lymphoma.
In parallel, related methods have been developed for integrating protein networks with genome-wide linkage and association studies. For instance, Lage et al.77 identified protein complexes encoded by genes that were associated with similar phenotypes, using a protein interaction network assembled with both human and model organism data. Proteins were ranked by the phenotypic similarity score of diseases associated with them and with their directly interacting proteins. In dense module searching for GWAS (dmGWAS)78, dense subnetworks of protein-protein interactions were tested for enrichment in genes harboring SNPs with low P values in GWAS studies.
A similar approach integrated genes linked to ataxia within a human protein interaction network, showing potential gains in statistical power38. Further attempts to boost statistical power in GWAS include the identification of SNP pairs, whose joint state was associated with the phenotype79. A biclustering method was used to cluster SNP-SNP interactions, first across genomic regions and then across a protein interaction network (Fig. 3). The analysis showed strong enrichment of GWAS genetic interactions among interacting proteins. This GWAS-based method suggested that the INO80 chromatin-remodeling complex is functionally linked to transcription elongation via RNA polymerase II and vacuolar protein degradation. Finally, related approaches were developed for using previous knowledge in the inference of epistatic interactions from GWAS39.
Figure 3.

Genetic networks extracted from GWAS elucidate pathway architecture. (a) A global map of the top GWAS genetic interactions between protein interaction complexes. Each node represents a protein complex, and each interaction represents a significant number of genetic interactions. Node sizes are proportional to the number of proteins in the complex. (b,c) Genetic interactions mined from GWAS data are shown in greater detail for the interaction between the synaptonemal complex and the RNA polymerase II complex (b) and the interaction between the mannan polymerase II complex, the TIM9-TIM10 complex and the TRAPP complex (c). Adapted from ref. 79.
Genetics of gene expression
Systems genetics represents a broad class of approaches that integrate germline or somatic genetic variants and phenotypic data to infer causal gene-gene and gene-phenotype relationships. Variations in DNA can directly affect gene expression and protein activity and can thus be viewed as the naturally occurring counterpart of the artificial perturbations commonly employed to establish causal relationships. However, because common forms of human disease and physiological differences are caused by such variation, they constitute a more relevant context in which to elucidate causal mechanisms related to disease risk assessment, initiation, progression and therapy.
DNA variation can be effectively used to infer causal relationships among molecular phenotypes24,26,27 and to reconstruct entire gene networks by systematically assessing its effect on gene, protein and metabolite expression and interactions28,51. Gene networks dissected from DNA variability data can elucidate gene subnetworks driven by common genetic factors in an unbiased, data-driven fashion. For instance, Zhong et al. identified such a subnetwork by studying islets isolated from a population of mice segregating with a type 2 diabetes (T2D) phenotype29. More than half of the genes that were predicted to be causal for T2D in this population were members of this sub-network. Furthermore, human SNPs associated with genes in the mouse-derived T2D network were more than eightfold enriched for statistically significant associations with T2D in GWAS data. Notably, no enrichments were observed using established GO and KEGG pathways11.
Along similar lines, module-based network approaches44 were extended to identify genetic determinants of differential regulation of genetic modules80 as well as to identify genetic alterations causally related to the presentation of a tumor phenotype81.
Regulatory network analysis
Causal regulatory networks have also been successfully used to identify disease-relevant genes that were then experimentally validated. In these networks, interactions are directed (causal) rather than undirected, as in protein interaction networks. Thus, if networks are sufficiently accurate and comprehensive, they may allow traversing back regulatory event cascades to identify ‘master regulator’ genes that are necessary and/or sufficient to induce specific disease-related molecular signatures. This method was originally proposed for networks reconstructed from DNA-binding signatures of transcription factors, without experimental validation82. More recently, master regulator genes were inferred and experimentally validated, both in disease, for human high-grade glioma53, and for normal physiological formation of germinal centers20. In high-grade glioma, for instance, the master regulator inference algorithm (MARINa) identified two transcription factors, C/EBP (including both the β and δ subunits) and STAT3, as master regulators of the mesenchymal subtype, which is associated with the worst prognosis in this disease. Ectopic expression of both transcription factors, but not of either one individually, was sufficient to reprogram neural stem cells along an aberrant mesenchymal lineage. Simultaneous silencing in high-grade glioma lines, but not individual silencing of either gene, was sufficient to abrogate the mesenchymal phenotype and tumorigenesis in vivo. Direct exploration of GWAS data from the Tumor Cancer Genome Atlas (TCGA) study on glioblastoma in the context of genes upstream of these master regulators has identified genetic alterations responsible for most mesenchymal cases.
Diseasome approaches
Genes and proteins work within highly coordinated programs. Thus, another approach for the analysis of GWAS data exploits previous biological knowledge of gene similarities and dissimilarities across diseases.
For example, although the immune system is implicated in many pathophysiological phenotypes, suggesting that autoimmune disorders may share causal genetic variants with them, there are also notable differences. For example, the G allele of the rs2076530 polymorphism in BTNL2 (encoding butyrophilin-like 2, a major histocompatibility complex (MHC) class II–associated factor) is more frequent among individuals with type 1 diabetes and rheumatoid arthritis than in healthy controls, whereas the A allele was more frequent in individuals with systemic lupus erythematosus than in healthy individuals83. One way to use disease relationships is to compare multiple GWAS data sets to find risk alleles and SNPs associated with disease sets, whether as predisposing or protective factors. The identification of such ‘toggleSNPs’ was used to study molecular mechanisms in actual human disease incidence, providing a key advantage over similar studies in animal models84.
Phenotype canalization
Many diseases, including cancer, present a seeming paradox. Whereas the number of genetic and epigenetic dysregulation patterns associated with disease etiology is generally large, the number of distinct molecular subtypes from gene expression profiling analysis is substantially smaller. For instance, in high-grade glioma, dozens of genetic alterations have been reported85, yet there are only three or four distinct molecular subtypes86,87. This suggests the existence of an integrative logic, usually at the level of transcriptional regulation, canalizing aberrant signals from complex genetic and epigenetic alteration patterns into a few molecular phenotypes. The existence of this integrative logic has been uncovered in several tumor types, including in lymphoma70 and in high-grade glioma53. These observations suggest yet another approach to INAS, based on the identification of candidate genes in the regulatory modules that control the disease subtype and in their upstream pathways. This handful of genes can then be directly assessed for genetic and/or epigenetic variation, thus dramatically increasing statistical power by reducing the number of multiple hypotheses tested.
Conclusions
Regulatory network models are emerging as powerful integrative frameworks to understand and interpret the roles of genetics and epigenetics in disease predisposition and etiology. By providing the backbone of molecular interactions through which signals are transduced and gene expression is regulated, they dramatically limit the search space of allele variants and alterations that can be causally linked to the presentation of a phenotype. In addition, by providing accurate regulatory models of the cellular machinery that integrates signals that are dysregulated in disease, they yield valuable hypotheses for diagnostic and prognostic biomarkers, for therapeutic targets and for the understanding of context-specific synthetic lethality.
For regulatory network models to yield their full potential, however, we must understand both the mechanistic and statistical implications of their variability across cellular context, their dependence on the genetic and epigenetic layers of regulation and their dynamics over time. The latter is particularly important for diseases where the underlying cellular pathophysiology cannot be considered to be close to steady state, such as metabolic and neurological diseases. We note that, in leveraging network models reflecting multiple conditions or multiple contexts to identify key drivers of phenotypes of interest, particular attention must be paid to assessing the significance of drivers predicted in one context after searching a diversity of contexts. Controlling for false discovery rates in this setting demands that one account for all of the models queried across the different contexts.
Unexpectedly, even rough regulatory models that are largely inaccurate and incomplete are starting to show substantial value in dissecting the genetics of disease. Thus, we expect that, as these models progress and become better able to deal with the dynamic, cell context–specific nature of biological process regulation, they will dramatically increase their ability to yield key insight into both normal cell physiology and its dysregulation in disease. We herald network reverse engineering and interrogation as one of the most critical challenges of quantitative biology.
Assembling these models will require efforts that transcend individual laboratories and even institutions. Yet, until very recently, nearly all of the historic studies that drive the current understanding of disease were performed by single laboratories. This process fails to recognize that the value of data is multiplied when it can be easily accessed and leveraged in ways that were not originally envisioned. While efforts like TCGA85, the database of Genotypes and Phenotypes (dbGAP), Gene Expression Omnibus (GEO) and GWAS meta-analysis have shown the usefulness of sharing data on a large scale, the absence of a culture of appropriate data sharing remains perhaps the single greatest impediment to the rapid development of the integrative techniques described here. Even in cases where substantial effort has gone into providing data in the most comprehensive fashion (for example, in the TCGA projects), the reproduction of results derived from such data by others remains often elusive88.
Acknowledgments
We would like to acknowledge the generous funding provided by the US National Institutes of Health (NIH) under the following grant awards: (i) Common Fund and National Cancer Institute, Roadmap grant for the Center for the Multiscale Analysis of Genetic Networks (MAGNet) (U54CA121852), (ii) National Cancer Institute, In Silico Research Centre of Excellence (NCI-caBIG 29XS192), (iii) National Cancer Institute CCSB Program (U54CA149237), (iv) (P41 GM103504) and (v) National Institute of General Medical Sciences (R01 GM079719). We would also like to acknowledge the State of Washington Life Sciences Discovery Fund and the Lucile Packard Foundation for Children’s Health.
Footnotes
AUTHOR CONTRIBUTIONS
A.C. and E.S. wrote the manuscript, and A.J.B., S.F. and T.I. provided specific examples and editorial comments.
COMPETING FINANCIAL INTERESTS
The authors declare no competing financial interests.
Reprints and permissions information is available online at http://www.nature.com/reprints/index.html.
This work is licensed under a Creative Commons Attribution-NonCommercial-ShareAlike 3.0 Unported License. To view a copy of this license, visit http://creativecommons.org/licenses/by-nc-sa/3.0/
References
- 1.Stranger BE, Stahl EA, Raj T. Progress and promise of genome-wide association studies for human complex trait genetics. Genetics. 2011;187:367–383. doi: 10.1534/genetics.110.120907. [DOI] [PMC free article] [PubMed] [Google Scholar]
- 2.Kraft P, Hunter DJ. Genetic risk prediction—are we there yet? N Engl J Med. 2009;360:1701–1703. doi: 10.1056/NEJMp0810107. [DOI] [PubMed] [Google Scholar]
- 3.Hardy J. Genomewide association studies and human disease. N Engl J Med. 2009;360:1759–1768. doi: 10.1056/NEJMra0808700. 360A. [DOI] [PMC free article] [PubMed] [Google Scholar]
- 4.Goldstein DB. Common genetic variation and human traits. N Engl J Med. 2009;360:1696–1698. doi: 10.1056/NEJMp0806284. [DOI] [PubMed] [Google Scholar]
- 5.Zeggini E, et al. Meta-analysis of genome-wide association data and large-scale replication identifies additional susceptibility loci for type 2 diabetes. Nat Genet. 2008;40:638–645. doi: 10.1038/ng.120. [DOI] [PMC free article] [PubMed] [Google Scholar]
- 6.Lyssenko V, et al. Clinical risk factors, DNA variants, and the development of type 2 diabetes. N Engl J Med. 2008;359:2220–2232. doi: 10.1056/NEJMoa0801869. [DOI] [PubMed] [Google Scholar]
- 7.Altshuler D, Daly MJ, Lander ES. Genetic mapping in human disease. Science. 2008;322:881–888. doi: 10.1126/science.1156409. [DOI] [PMC free article] [PubMed] [Google Scholar]
- 8.Manolio TA, et al. Finding the missing heritability of complex diseases. Nature. 2009;461:747–753. doi: 10.1038/nature08494. [DOI] [PMC free article] [PubMed] [Google Scholar]
- 9.Narayanan M, Vetta A, Schadt EE, Zhu J. Simultaneous clustering of multiple gene expression and physical interaction datasets. PLoS Comput Biol. 2010;6:e1000742. doi: 10.1371/journal.pcbi.1000742. [DOI] [PMC free article] [PubMed] [Google Scholar]
- 10.Stephens PJ, et al. Massive genomic rearrangement acquired in a single catastrophic event during cancer. Cell. 2011;144:27–40. doi: 10.1016/j.cell.2010.11.055. [DOI] [PMC free article] [PubMed] [Google Scholar]
- 11.Zhong H, Yang X, Kaplan LM, Molony C, Schadt EE. Integrating pathway analysis and genetics of gene expression for genome-wide association studies. Am J Hum Genet. 2010;86:581–591. doi: 10.1016/j.ajhg.2010.02.020. [DOI] [PMC free article] [PubMed] [Google Scholar]
- 12.Subramanian A, et al. Gene set enrichment analysis: a knowledge-based approach for interpreting genome-wide expression profiles. Proc Natl Acad Sci USA. 2005;102:15545–15550. doi: 10.1073/pnas.0506580102. [DOI] [PMC free article] [PubMed] [Google Scholar]
- 13.Ogata H, et al. KEGG: Kyoto Encyclopedia of Genes and Genomes. Nucleic Acids Res. 1999;27:29–34. doi: 10.1093/nar/27.1.29. [DOI] [PMC free article] [PubMed] [Google Scholar]
- 14.Wang K, Li M, Hakonarson H. Analysing biological pathways in genome-wide association studies. Nat Rev Genet. 2010;11:843–854. doi: 10.1038/nrg2884. [DOI] [PubMed] [Google Scholar]
- 15.Dobrin R, et al. Multi-tissue coexpression networks reveal unexpected subnetworks associated with disease. Genome Biol. 2009;10:R55. doi: 10.1186/gb-2009-10-5-r55. [DOI] [PMC free article] [PubMed] [Google Scholar]
- 16.Guttman M, et al. lincRNAs act in the circuitry controlling pluripotency and differentiation. Nature. 2011;477:295–300. doi: 10.1038/nature10398. [DOI] [PMC free article] [PubMed] [Google Scholar]
- 17.Sumazin P, et al. An extensive microRNA-mediated network of RNA-RNA interactions regulates established oncogenic pathways in glioblastoma. Cell. 2011;147:370–381. doi: 10.1016/j.cell.2011.09.041. [DOI] [PMC free article] [PubMed] [Google Scholar]
- 18.ENCODE Project Consortium. Identification and analysis of functional elements in 1% of the human genome by the ENCODE pilot project. Nature. 2007;447:799–816. doi: 10.1038/nature05874. [DOI] [PMC free article] [PubMed] [Google Scholar]
- 19.Margolin AA, et al. ChIP-on-chip significance analysis reveals large-scale binding and regulation by human transcription factor oncogenes. Proc Natl Acad Sci USA. 2009;106:244–249. doi: 10.1073/pnas.0806445106. [DOI] [PMC free article] [PubMed] [Google Scholar]
- 20.Lefebvre C, et al. A human B-cell interactome identifies MYB and FOXM1 as master regulators of proliferation in germinal centers. Mol Syst Biol. 2010;6:377. doi: 10.1038/msb.2010.31. [DOI] [PMC free article] [PubMed] [Google Scholar]
- 21.Ravasi T, et al. An atlas of combinatorial transcriptional regulation in mouse and man. Cell. 2010;140:744–752. doi: 10.1016/j.cell.2010.01.044. [DOI] [PMC free article] [PubMed] [Google Scholar]
- 22.Wang K, et al. Dissecting the interface between signaling and transcriptional regulation in human B cells. Pac Symp Biocomput. 2009:264–275. [PMC free article] [PubMed] [Google Scholar]
- 23.Rual JF, et al. Towards a proteome-scale map of the human protein-protein interaction network. Nature. 2005;437:1173–1178. doi: 10.1038/nature04209. [DOI] [PubMed] [Google Scholar]
- 24.Chen Y, et al. Variations in DNA elucidate molecular networks that cause disease. Nature. 2008;452:429–435. doi: 10.1038/nature06757. [DOI] [PMC free article] [PubMed] [Google Scholar]
- 25.Emilsson V, et al. Genetics of gene expression and its effect on disease. Nature. 2008;452:423–428. doi: 10.1038/nature06758. [DOI] [PubMed] [Google Scholar]
- 26.Schadt EE, et al. An integrative genomics approach to infer causal associations between gene expression and disease. Nat Genet. 2005;37:710–717. doi: 10.1038/ng1589. [DOI] [PMC free article] [PubMed] [Google Scholar]
- 27.Yang X, et al. Validation of candidate causal genes for obesity that affect shared metabolic pathways and networks. Nat Genet. 2009;41:415–423. doi: 10.1038/ng.325. [DOI] [PMC free article] [PubMed] [Google Scholar]
- 28.Zhu J, et al. Integrating large-scale functional genomic data to dissect the complexity of yeast regulatory networks. Nat Genet. 2008;40:854–861. doi: 10.1038/ng.167. [DOI] [PMC free article] [PubMed] [Google Scholar]
- 29.Zhong H, et al. Liver and adipose expression associated SNPs are enriched for association to type 2 diabetes. PLoS Genet. 2010;6:e1000932. doi: 10.1371/journal.pgen.1000932. [DOI] [PMC free article] [PubMed] [Google Scholar]
- 30.Kinzler KW, Vogelstein B. Landscaping the cancer terrain. Science. 1998;280:1036–1037. doi: 10.1126/science.280.5366.1036. [DOI] [PubMed] [Google Scholar]
- 31.Ferron M, et al. Insulin signaling in osteoblasts integrates bone remodeling and energy metabolism. Cell. 2010;142:296–308. doi: 10.1016/j.cell.2010.06.003. [DOI] [PMC free article] [PubMed] [Google Scholar]
- 32.Schadt EE. Molecular networks as sensors and drivers of common human diseases. Nature. 2009;461:218–223. doi: 10.1038/nature08454. [DOI] [PubMed] [Google Scholar]
- 33.Basso K, et al. Reverse engineering of regulatory networks in human B cells. Nat Genet. 2005;37:382–390. doi: 10.1038/ng1532. [DOI] [PubMed] [Google Scholar]
- 34.Wang K, et al. Genome-wide identification of post-translational modulators of transcription factor activity in human B cells. Nat Biotechnol. 2009;27:829–839. doi: 10.1038/nbt.1563. [DOI] [PMC free article] [PubMed] [Google Scholar]
- 35.Mani KM, et al. A systems biology approach to prediction of oncogenes and molecular perturbation targets in B-cell lymphomas. Mol Syst Biol. 2008;4:169. doi: 10.1038/msb.2008.2. [DOI] [PMC free article] [PubMed] [Google Scholar]
- 36.Luscombe NM, et al. Genomic analysis of regulatory network dynamics reveals large topological changes. Nature. 2004;431:308–312. doi: 10.1038/nature02782. [DOI] [PubMed] [Google Scholar]
- 37.Bandyopadhyay S, et al. Rewiring of genetic networks in response to DNA damage. Science. 2010;330:1385–1389. doi: 10.1126/science.1195618. [DOI] [PMC free article] [PubMed] [Google Scholar]
- 38.Pan W. Network-based model weighting to detect multiple loci influencing complex diseases. Hum Genet. 2008;124:225–234. doi: 10.1007/s00439-008-0545-1. [DOI] [PMC free article] [PubMed] [Google Scholar]
- 39.Chen GK, Thomas DC. Using biological knowledge to discover higher order interactions in genetic association studies. Genet Epidemiol. 2010;34:863–878. doi: 10.1002/gepi.20542. [DOI] [PubMed] [Google Scholar]
- 40.Calvano SE, et al. A network-based analysis of systemic inflammation in humans. Nature. 2005;437:1032–1037. doi: 10.1038/nature03985. [DOI] [PubMed] [Google Scholar]
- 41.Quayle AP, Siddiqui AS, Jones SJ. Perturbation of interaction networks for application to cancer therapy. Cancer Inform. 2007;5:45–65. [PMC free article] [PubMed] [Google Scholar]
- 42.Birtwistle MR, et al. Ligand-dependent responses of the ErbB signaling network: experimental and modeling analyses. Mol Syst Biol. 2007;3:144. doi: 10.1038/msb4100188. [DOI] [PMC free article] [PubMed] [Google Scholar]
- 43.Nelander S, et al. Models from experiments: combinatorial drug perturbations of cancer cells. Mol Syst Biol. 2008;4:216. doi: 10.1038/msb.2008.53. [DOI] [PMC free article] [PubMed] [Google Scholar]
- 44.Segal E, et al. Module networks: identifying regulatory modules and their condition-specific regulators from gene expression data. Nat Genet. 2003;34:166–176. doi: 10.1038/ng1165. [DOI] [PubMed] [Google Scholar]
- 45.Friedman N. Inferring cellular networks using probabilistic graphical models. Science. 2004;303:799–805. doi: 10.1126/science.1094068. [DOI] [PubMed] [Google Scholar]
- 46.Gardner TS, di Bernardo D, Lorenz D, Collins JJ. Inferring genetic networks and identifying compound mode of action via expression profiling. Science. 2003;301:102–105. doi: 10.1126/science.1081900. [DOI] [PubMed] [Google Scholar]
- 47.Linding R, et al. Systematic discovery of in vivo phosphorylation networks. Cell. 2007;129:1415–1426. doi: 10.1016/j.cell.2007.05.052. [DOI] [PMC free article] [PubMed] [Google Scholar]
- 48.Bandyopadhyay S, et al. A human MAP kinase interactome. Nat Methods. 2010;7:801–805. doi: 10.1038/nmeth.1506. [DOI] [PMC free article] [PubMed] [Google Scholar]
- 49.Huang Y, et al. A study of miRNAs targets prediction and experimental validation. Protein Cell. 2010;1:979–986. doi: 10.1007/s13238-010-0129-4. [DOI] [PMC free article] [PubMed] [Google Scholar]
- 50.Shlomi T, Cabili MN, Herrgard MJ, Palsson BO, Ruppin E. Network-based prediction of human tissue-specific metabolism. Nat Biotechnol. 2008;26:1003–1010. doi: 10.1038/nbt.1487. [DOI] [PubMed] [Google Scholar]
- 51.Zhu J, et al. An integrative genomics approach to the reconstruction of gene networks in segregating populations. Cytogenet Genome Res. 2004;105:363–374. doi: 10.1159/000078209. [DOI] [PubMed] [Google Scholar]
- 52.Yang X, et al. Validation of candidate causal genes for obesity that affect shared metabolic pathways and networks. Nat Genet. 2009;41:415–423. doi: 10.1038/ng.325. [DOI] [PMC free article] [PubMed] [Google Scholar]
- 53.Carro MS, et al. The transcriptional network for mesenchymal transformation of brain tumours. Nature. 2010;463:318–325. doi: 10.1038/nature08712. [DOI] [PMC free article] [PubMed] [Google Scholar]
- 54.Zhao X, et al. The N-Myc–DLL3 cascade is suppressed by the ubiquitin ligase Huwe1 to inhibit proliferation and promote neurogenesis in the developing brain. Dev Cell. 2009;17:210–221. doi: 10.1016/j.devcel.2009.07.009. [DOI] [PMC free article] [PubMed] [Google Scholar]
- 55.Yang X, et al. Identification and validation of genes affecting aortic lesions in mice. J Clin Invest. 2010;120:2414–2422. doi: 10.1172/JCI42742. [DOI] [PMC free article] [PubMed] [Google Scholar]
- 56.König R, et al. Human host factors required for influenza virus replication. Nature. 2010;463:813–817. doi: 10.1038/nature08699. [DOI] [PMC free article] [PubMed] [Google Scholar]
- 57.Jansen R, et al. A Bayesian networks approach for predicting protein-protein interactions from genomic data. Science. 2003;302:449–453. doi: 10.1126/science.1087361. [DOI] [PubMed] [Google Scholar]
- 58.Sharan R, et al. Conserved patterns of protein interaction in multiple species. Proc Natl Acad Sci USA. 2005;102:1974–1979. doi: 10.1073/pnas.0409522102. [DOI] [PMC free article] [PubMed] [Google Scholar]
- 59.Lamb J, et al. The Connectivity Map: using gene-expression signatures to connect small molecules, genes, and disease. Science. 2006;313:1929–1935. doi: 10.1126/science.1132939. [DOI] [PubMed] [Google Scholar]
- 60.Wang W, Cherry JM, Botstein D, Li H. A systematic approach to reconstructing transcription networks in Saccharomyces cerevisiae. Proc Natl Acad Sci USA. 2002;99:16893–16898. doi: 10.1073/pnas.252638199. [DOI] [PMC free article] [PubMed] [Google Scholar]
- 61.Pe’er D, Regev A, Elidan G, Friedman N. Inferring subnetworks from perturbed expression profiles. Bioinformatics. 2001;17 (suppl 1):S215–S224. doi: 10.1093/bioinformatics/17.suppl_1.s215. [DOI] [PubMed] [Google Scholar]
- 62.di Bernardo D, et al. Chemogenomic profiling on a genome-wide scale using reverse-engineered gene networks. Nat Biotechnol. 2005;23:377–383. doi: 10.1038/nbt1075. [DOI] [PubMed] [Google Scholar]
- 63.Chen BJ, et al. Harnessing gene expression to identify the genetic basis of drug resistance. Mol Syst Biol. 2009;5:310. doi: 10.1038/msb.2009.69. [DOI] [PMC free article] [PubMed] [Google Scholar]
- 64.Zhu J, et al. Characterizing dynamic changes in the human blood transcriptional network. PLoS Comput Biol. 2010;6:e1000671. doi: 10.1371/journal.pcbi.1000671. [DOI] [PMC free article] [PubMed] [Google Scholar]
- 65.Leonardson AS, et al. The effect of food intake on gene expression in human peripheral blood. Hum Mol Genet. 2010;19:159–169. doi: 10.1093/hmg/ddp476. [DOI] [PMC free article] [PubMed] [Google Scholar]
- 66.Chautard E, Thierry-Mieg N, Ricard-Blum S. Interaction networks: from protein functions to drug discovery. A review. Pathol Biol (Paris) 2009;57:324–333. doi: 10.1016/j.patbio.2008.10.004. [DOI] [PubMed] [Google Scholar]
- 67.Jia J, et al. Mechanisms of drug combinations: interaction and network perspectives. Nat Rev Drug Discov. 2009;8:111–128. doi: 10.1038/nrd2683. [DOI] [PubMed] [Google Scholar]
- 68.Xie L, Li J, Bourne PE. Drug discovery using chemical systems biology: identification of the protein-ligand binding network to explain the side effects of CETP inhibitors. PLoS Comput Biol. 2009;5:e1000387. doi: 10.1371/journal.pcbi.1000387. [DOI] [PMC free article] [PubMed] [Google Scholar]
- 69.Pandey G, et al. An integrative multi-network and multi-classifier approach to predict genetic interactions. PLoS Comput Biol. 2010;6:e1000928. doi: 10.1371/journal.pcbi.1000928. pii. [DOI] [PMC free article] [PubMed] [Google Scholar]
- 70.Compagno M, et al. Mutations of multiple genes cause deregulation of NF-κB in diffuse large B-cell lymphoma. Nature. 2009;459:717–721. doi: 10.1038/nature07968. [DOI] [PMC free article] [PubMed] [Google Scholar]
- 71.Lenz G, et al. Stromal gene signatures in large-B-cell lymphomas. N Engl J Med. 2008;359:2313–2323. doi: 10.1056/NEJMoa0802885. [DOI] [PMC free article] [PubMed] [Google Scholar]
- 72.Feldman I, Rzhetsky A, Vitkup D. Network properties of genes harboring inherited disease mutations. Proc Natl Acad Sci USA. 2008;105:4323–4328. doi: 10.1073/pnas.0701722105. [DOI] [PMC free article] [PubMed] [Google Scholar]
- 73.Ideker T, Ozier O, Schwikowski B, Siegel AF. Discovering regulatory and signalling circuits in molecular interaction networks. Bioinformatics. 2002;18 (suppl 1):S233–S240. doi: 10.1093/bioinformatics/18.suppl_1.s233. [DOI] [PubMed] [Google Scholar]
- 74.Zien A, Kuffner R, Zimmer R, Lengauer T. Analysis of gene expression data with pathway scores. Proc Int Conf Intell Syst Mol Biol. 2000;8:407–417. [PubMed] [Google Scholar]
- 75.Faust K, Dupont P, Callut J, van Helden J. Pathway discovery in metabolic networks by subgraph extraction. Bioinformatics. 2010;26:1211–1218. doi: 10.1093/bioinformatics/btq105. [DOI] [PMC free article] [PubMed] [Google Scholar]
- 76.Ulitsky I, Krishnamurthy A, Karp RM, Shamir R. DEGAS: de novo discovery of dysregulated pathways in human diseases. PLoS ONE. 2010;5:e13367. doi: 10.1371/journal.pone.0013367. [DOI] [PMC free article] [PubMed] [Google Scholar]
- 77.Lage K, et al. A human phenome-interactome network of protein complexes implicated in genetic disorders. Nat Biotechnol. 2007;25:309–316. doi: 10.1038/nbt1295. [DOI] [PubMed] [Google Scholar]
- 78.Jia P, Zheng S, Long J, Zheng W, Zhao Z. dmGWAS: dense module searching for genome-wide association studies in protein-protein interaction networks. Bioinformatics. 2011;27:95–102. doi: 10.1093/bioinformatics/btq615. [DOI] [PMC free article] [PubMed] [Google Scholar]
- 79.Hannum G, et al. Genome-wide association data reveal a global map of genetic interactions among protein complexes. PLoS Genet. 2009;5:e1000782. doi: 10.1371/journal.pgen.1000782. [DOI] [PMC free article] [PubMed] [Google Scholar]
- 80.Lee SI, Pe’er D, Dudley AM, Church GM, Koller D. Identifying regulatory mechanisms using individual variation reveals key role for chromatin modification. Proc Natl Acad Sci USA. 2006;103:14062–14067. doi: 10.1073/pnas.0601852103. [DOI] [PMC free article] [PubMed] [Google Scholar]
- 81.Akavia UD, et al. An integrated approach to uncover drivers of cancer. Cell. 2010;143:1005–1017. doi: 10.1016/j.cell.2010.11.013. [DOI] [PMC free article] [PubMed] [Google Scholar]
- 82.Rhodes DR, et al. Mining for regulatory programs in the cancer transcriptome. Nat Genet. 2005;37:579–583. doi: 10.1038/ng1578. [DOI] [PubMed] [Google Scholar]
- 83.Orozco G, et al. Analysis of a functional BTNL2 polymorphism in type 1 diabetes, rheumatoid arthritis, and systemic lupus erythematosus. Hum Immunol. 2005;66:1235–1241. doi: 10.1016/j.humimm.2006.02.003. [DOI] [PubMed] [Google Scholar]
- 84.Sirota M, Schaub MA, Batzoglou S, Robinson WH, Butte AJ. Autoimmune disease classification by inverse association with SNP alleles. PLoS Genet. 2009;5:e1000792. doi: 10.1371/journal.pgen.1000792. [DOI] [PMC free article] [PubMed] [Google Scholar]
- 85.TCGA-Consortium. Comprehensive genomic characterization defines human glioblastoma genes and core pathways. Nature. 2008;455:1061–1068. doi: 10.1038/nature07385. [DOI] [PMC free article] [PubMed] [Google Scholar]
- 86.Phillips HS, et al. Molecular subclasses of high-grade glioma predict prognosis, delineate a pattern of disease progression, and resemble stages in neurogenesis. Cancer Cell. 2006;9:157–173. doi: 10.1016/j.ccr.2006.02.019. [DOI] [PubMed] [Google Scholar]
- 87.Verhaak RG, et al. Integrated genomic analysis identifies clinically relevant subtypes of glioblastoma characterized by abnormalities in PDGFRA, IDH1, EGFR, and NF1. Cancer Cell. 2010;17:98–110. doi: 10.1016/j.ccr.2009.12.020. [DOI] [PMC free article] [PubMed] [Google Scholar]
- 88.Marko NF, Quackenbush J, Weil RJ. Why is there a lack of consensus on molecular subgroups of glioblastoma? Understanding the nature of biological and statistical variability in glioblastoma expression data. PLoS ONE. 2011;6:e20826. doi: 10.1371/journal.pone.0020826. [DOI] [PMC free article] [PubMed] [Google Scholar]