

Abstract
It has been reported that α-tocopherol (α-Toc), a vitamin E analog, is effective for treatment of non-alcoholic steatohepatitis (NASH). However, it is unknown whether or not other vitamin E analogs are effective. Therefore we designed a new rat model of steatohepatitis induced by tumor necrosis factor-α (TNF-α) stimulation, and used it to investigate the effects of vitamin E analogs. The rat liver triglyceride content increased with the dosage of TNF-α/d-galactosamine (GalN), but was suppressed by intake of both tocotrienol (T3) and α-tocopherol. Moreover, lipid peroxides (thiobarbituric acid-reactive substances) level in the liver level was also lower in both groups after tocotrienol and α-Toc intake. Intake of both tocotrienol and α-tocopherol also tended to control the increase of liver damage marker activity. In the tocotrienol and α-tocopherol groups, increases of inflammatory cytokines mRNA expression in the liver were inhibited, and these effects were considered to contribute to improvement of inflammation and fibrosis. The expression of mRNAs for inflammatory cytokines in rat primary hepatocytes was increased by TNF-α stimulation, but was inhibited by addition of α-tocotrienol and γ-tocotrienol. Transforming growth factor-β1 mRNA expression in particular was significantly inhibited by γ-tocotrienol. These findings suggest that tocotrienol species are effective for amelioration of steatohepatitis, and that tocotrienol and α-tocopherol exert a synergistic effect.
Keywords: tocotrienol, tocopherol, steatohepatitis, inflammation, fibrosis
Introduction
The prevalence of non-alcoholic fatty liver disease (NAFLD) has been increasing in Japan. NAFLD is a term used to describe a spectrum of liver diseases that are not attributable to alcohol intake. Non-alcoholic steatohepatitis (NASH), one of the conditions of NAFLD, was first reported by Ludwig et al.(1) The histopathological picture in NASH resembles that of alcoholic steatohepatitis. However, NASH is more difficult to treat than alcoholic steatohepatitis, and can lead to liver cirrhosis and cancer. It is considered that fatty liver progresses further to NASH under conditions such as oxidative stress and the action of inflammatory cytokines: the so-called two-hit theory.(2) The first ”hit” is the accumulation of triglyceride (TG) in the liver, and the second ”hit” is stimulation of oxidative stress or inflammatory cytokines. NASH is closely related to obesity and metabolic syndrome. Monocytes assemble and infiltrate adipose tissue when adipocytes become hypertrophic as a result of obesity. The infiltrated monocytes then differentiate to macrophages and become activated, producing inflammatory cytokines such as tumor necrosis factor-α (TNF-α).(3,4) Moreover, macrophages promote the permeation of monocytes into fatty tissue by secretion of monocyte chemotactic protein-1 (MCP-1), thus initiating a vicious cycle. Inflammatory cytokines that are secreted from macrophages pass into the hepatic portal vein and reach the liver. It has been suggested that this stimulation plays a significant role in the development of NASH.
Vitamin E is present naturally in the form of eight analogs, each differing in the number and position of the methyl groups on the chroman ring and by the presence or absence of a double bond on the phytyl side chain. One group, the tocopherols (Tocs), have a saturated phytyl side chain, and the other, the tocotrienols (T3s), have an unsaturated phytyl side chain. Each of the groups can occur in α-, β-, γ-, or δ-forms. It has been reported that α-Toc is effective for treatment of NASH, and it has already been applied therapeutically. A report by Hasegawa et al.(5) indicated that ALT activity in the serum of NASH patients was reduced, and that the histopathological status (fatty degeneration, inflammation, and fibrosis) was improved by administration of α-Toc (300 mg/day) for one year. However, it is still unclear whether T3 has any effect on NASH.
In this study, we designed a new animal model of NASH by administering GalN and TNF-α to rats. Based on the two-hit theory, this led to the development of fatty liver while the rats were fed a high-fat diet. We then used the model to examine the effects of α-Toc and T3. In addition, we investigated the effect of T3s (α-T3 and γ-T3) in vitro using rat primary hepatocytes.
Materials and Methods
In vivo study
Animals and diets
Male SD-IGS rats (7 weeks old) were purchased from Charles River Japan, Inc. They were housed individually in stainless steel wire netting cages, and fed a vitamin E-deficient diet for three days for acclimation. The animals were kept in an environment controlled at 23 ± 2°C and 55 ± 5% humidity, with a 12 h/12 h light-dark cycle. After the pre-feeding period, the rats were fed each experimental diet for 4 weeks. The compositions of the experimental diets are shown in Table 1. α-Cornstarch, casein, sucrose, cellulose, mineral mix, and a vitamin E-deficient vitamin mixture were obtained from Oriental Yeast Co., Ltd. (Tokyo, Japan). Vitamin E-deficient stripped corn oil was purchased from Funabashi Farm Co., Ltd. (Chiba, Japan). l-Cystine and t-butylhydroquinone were purchased from Wako Pure Chem. Ind, Ltd. (Osaka, Japan). The purity of the T3 mixture (α-T3; 37.8%, β-T3; 4.0%, γ-T3; 45.5%, δ-T3; 10.7%) was 98%. The purity of α-tocopherol was above 96.1%. All the vitamin E analogs were donated by Eisai Food & Chemical Co., Ltd. (Tokyo, Japan). All experiments were conducted in accordance with the guidelines for the care and use of laboratory animals at Kanagawa Institute of Technology (Kanagawa, Japan).
Table 1.
The composition of the experimental diets (g)
| Control | α-Toc | T3 | α-Toc + T3 | |
|---|---|---|---|---|
| α-Tocopherol | — | 850 mg | 800 mg | 50 mg |
| Tocotrienol mixture | — | — | — | 800 mg |
| α-Cornstarch | 250 | 250 | 250 | 250 |
| Casein | 200 | 200 | 200 | 200 |
| Sucrose | 252 | 252 | 252 | 252 |
| Vitamin E-deficient stripped corn oil | 200 | 200 | 200 | 200 |
| Cellulose | 50 | 50 | 50 | 50 |
| Mineral mix | 35 | 35 | 35 | 35 |
| Vitamin E-deficient vitamin mix | 10 | 10 | 10 | 10 |
| l-Cystine | 3 | 3 | 3 | 3 |
| t-buthylhydroquinone | 0.014 | 0.014 | 0.014 | 0.014 |
T3-enriched high-fat diet consisted of 800 mg T3 mixture mixed with 1 kg vitamin E-deficient High-fat diet. α-Toc-enriched high-fat diet consisted of 850 mg α-Toc mixed with 1 kg vitamin E-deficient high-fat diet, and α-Toc and T3-enriched high-fat diet consisted of 800 mg T3 mixture and 50 mg α-Toc mixed with 1 kg vitamin E-deficienthigh-fat diet. T3 mixture contains 37.8% α-T3, 4.0% β-T3, 45.5% γ-T3, and 10.7% δ-T3.
Experimental design
Rats were divided into 5 groups; a vitamin E-deficient high-fat diet group (Control group), a vitamin E-deficient high-fat diet + TNF/GalN group (TNF group), an α-Toc-enriched high-fat diet + TNF/GalN group (αT/TNF group), a T3-enriched high-fat diet + TNF/GalN group (T3/TNF group), and an α-Toc and T3-enriched high-fat diet + TNF/GalN group (αT + T3/TNF group). The α-Toc-enriched high-fat diet consisted of 850 mg α-Toc mixed with 1 kg of vitamin E-deficient high-fat diet, and the α-Toc and T3-enriched high-fat diet consisted of 800 mg of T3 mix and 50 mg α-Toc mixed with 1 kg of the vitamin E-deficient high-fat diet. Rats were fed each diet for 4 weeks. After a 24 h fast, all the rats were administered GalN (250 mg/kg body weight) into the abdominal cavity without a control group. Thirty minutes later, the rats were given an intravenous injection of TNF-α (10 µg/kg body weight). The control rats were administered 0.9% NaCl solution as a placebo. At 2 h or 5 h after TNF-α administration, each rat was killed under anesthesia, and the arterial blood and liver were removed for analysis. The plasma was separated from blood cells by centrifugation at 3,000 rpm for 10 min. All tissues were immediately stored at −80°C until analysis for biological parameters. A portion of liver to be used for RNA isolation was soaked immediately in RNA later® solution (Ambion, Inc., Austin, TX) and stored at −80°C. Also, another portion of liver to be used for histopathological examination was fixed in 10% formalin.
Measurement of liver lipid content
Total lipid in the liver was extracted by the method of Folch et al.(6) A 0.9 g sample of liver was ground with sodium sulfate and extracted with chloroform: methanol = 2:1, then made up to 25 ml. A 125 µl aliquot of the extract was added to 125 µl of 1% TritonX-100 ethanol solution, followed by heating at 50°C overnight, and then dissolved in 15 µL of distilled water. TG and T-Chol concentrations in the liver were measured using a biochemical autoanalyzer (CA-180; Furuno Electric Co., Ltd., Hyogo, Japan).
Measurement of liver TBARS
The level of TBARS in the liver was measured using a modified version of the method of Ohkawa et al.(7) A 0.3 g portion of liver was homogenized in 1.15% KCl (wt/vol) solution. The resulting homogenate (0.2 ml), H2O (0.2 ml) and 8.1% (wt/vol) SDS were pipetted into a 10 ml brown tube, and stirred for 30 s. Then, 0.75 ml of 20% acetate buffer, 0.75 ml of TBA solution and 10 µl of 2.0% BHT ethanol were added to the brown tube, and the contents were stirred for precisely 60 s, then heated at 95°C for 60 min. After cooling, TBARS were extracted with 0.5 ml of H2O and 2.5 ml of n-butanol:pyridine (15:1), and centrifuged at 3,000 rpm at 4°C for 15 min. The absorbance of the upper layer was measured at 532 nm. Tetra-methoxypropane was used as the standard sample and the TBARS value was calculated.
Measurement of liver damage markers and lipid concentration in plasma
Activities of liver damage markers (AST and ALT) and TG concentrations in plasma were measured using a biochemical autoanalyzer.
Measurement of expression of IL1-β, IL6, MTP and TGF-β1 mRNAs in the liver
Total RNA was extracted from liver tissues using RNAiso Plus (TAKARA BIO Inc., Shiga, Japan). The quantity and purity of the RNA were determined from the absorbance at 258/280 nm. Total RNA was reverse-transcribed into cDNA using a high-capacity RNA-to-cDNA kit in accordance with the manufacturer’s protocol. A 7500 Fast Real-Time PCR system and real-time PCR kit (TaqMan® Gene Expression Assays) were employed based on the manufacturer’s instruction. β-Actin, a housekeeping gene, was used as an internal control. The contents of the primer/probe mixture are shown in Table 2.
Table 2.
Primer probe mixture of inflammatory cytokines and β-actin
| Assay ID | Refseq | |
|---|---|---|
| Rat IL1-β | Rn99999011_m1 | NM_012589.1 |
| Rat IL6 | Rn99999017_m1 | NM_012675.2 |
| Rat MTP | Rn01522970_m1 | NM_001107727.1 |
| Rat TGF-β1 | Rn99999016_m1 | NM_021578.2 |
| Rat β-actin | Rn00667869_m1 | NM_031144.2 |
TaqMan® Gene Expression Assays (Applied Biosystems).
Histopathological examination of the liver
Paraffin embedding of liver specimens was assigned to Sapporo General Pathology Laboratory Co., Ltd. (Hokkaido, Japan). Sections were stained with hematoxylin-eosin (HE) or azan, and observed using an optical microscope at ×400 (Olympus Co., Tokyo, Japan).
Quantitative analysis of vitamin E analogs using HPLC
The quantity of vitamin E in each organ was measured using Ueda’s method.(8) A 0.1 g sample of each organ was homogenized with 0.9 ml of 0.9% NaCl (wt/vol) solution. The resulting homogenate (0.1 ml) was pipetted into a 10 ml centrifuge tube, and 50 µl of 1,2,2,5,7,8-pentamethyl-6-hydroxychroman (PMC, 1 µg/ml) as an internal standard and 1.0 ml of ethanolic pyrogallol (6%, wt/vol) were added to each tube with stirring. After 0.2 ml of 60% (wt/vol) KOH solution had been added to each tube, the contents were saponified at 70°C for 30 min. Vitamin E analogs were extracted with 4.5 ml of 1% sodium chloride solution and 3.0 ml of 10% ethyl acetate/n-hexane solution, and centrifuged at 3,000 rpm for 5 min at 4°C. A 2.0 ml aliquot of the upper layer was evaporated, dissolved in 0.2 ml of n-hexane, and subjected to HPLC. The HPLC system consisted of a pump, degasser, column oven, and detector (LC-20AD, DGU-20A3, CTO-20A and RF-10AXL, Shimadzu Co., Kyoto, Japan). The analytical conditions were as follows: column, Capcell pak NH2 column (4.6 mm I.D. × 250 mm; Shiseido, Tokyo, Japan); mobile phase, n-hexane-isopropanol (98:2); flow rate, 1.0 ml/min; detection wavelength, 325 nm.
In vitro study
Animals and diets
Male SD-IGS rats (3 weeks old) were purchased from Charles River Japan, Inc. They were housed individually in stainless steel wire netting cages. The animals were kept in an environment controlled at 23 ± 2°C and 55 ± 5% humidity, with a 12 h/12 h light-dark cycle. After the pre-feeding period, the rats were fed a vitamin E-deficient diet or a vitamin E-deficient high-fat diet for 4 weeks. The compositions of these diets are shown in Table 3.
Table 3.
The composition of the experimental diets (g)
| Vitamin E-deficient diet | Vitamin E-deficient high-fat diet | |
|---|---|---|
| α-Cornstarch | 400 | 250 |
| Casein | 200 | 200 |
| Sucrose | 252 | 252 |
| Vitamin E-deficient stripped corn oil | 50 | 200 |
| Cellulose | 50 | 50 |
| Mineral mix | 35 | 35 |
| Vitamin E-deficient vitamin mix | 10 | 10 |
| l-Cystine | 3 | 3 |
| t-buthylhydroquinone | 0.014 | 0.014 |
Preparation of hepatocytes
Hepatocytes were isolated by collagenase perfusion(9) from rats that had been fed the vitamin E-deficient diet or vitamin E-deficient high-fat diet. The isolated hepatocytes were seeded at a density of 1.0 × 10⁵ cells per 60 mm dish (coated with collagen-I) in DMEM-F12 medium supplemented with T3 (final concentration: 1 × 10⁻⁹ M), hydrocortisone (final concentration: 5 × 10⁻⁸ M), ethanolamine (final concentration: 1 × 10⁻⁶ M), ornithine (final concentration: 4 × 10⁻⁴ M), lactic acid (final concentration: 1.8 × 10⁻⁵ M), and penicillin/streptomycin (final concentration: 100 U/ml, 100 µg/ml).(10) After cell attachment (4 h), the medium was changed and the hepatocytes were incubated at 37°C in a 5% CO2 atmosphere.
Establishment of a steatohepatitis model using rat hepatocytes
Hepatocytes were isolated from a rat that had been fed the vitamin E-deficient diet or vitamin E-deficient high-fat diet. At 48 h after the start of incubation, the hepatocytes were stimulated with 0, 0.1, 0.5 and 1.0 nM TNF-α added in serum-free medium. The hepatocytes were collected at 2, 4, 8 and 12 h after TNF-α addition, and their TG content and expression of IL6 and TGF-β1 mRNA were measured.
Measurement of rat hepatocyte TG content
Hepatocytes were washed with iced PBS. TG was extracted with hexane:2-propanol (3:2, v:v) for 10 min at 4°C, emulsified with 2% Triton X-100 in 2-propanol for 20 min at 70°C, and measured using the triglyceride E-test Wako kit (Wako Pure Chem. Ind., Ltd., Osaka, Japan).
Comparison of rat hepatocyte lipid content by oil red O staining
Hepatocytes were washed twice with iced PBS and fixed with 4% buffered formalin for 30 min at 4°C. The cells were then stained for 30 min at room temperature with a filtered oil red O solution (0.3% oil red O in 60% 2-propanol), washed with distilled water, and observed using an optical microscope at ×400 (Olympus Co., Tokyo, Japan).
Measurement of cytokine mRNA expression
Total RNA was extracted using RNAiso Plus (TAKARA BIO Inc., Shiga, Japan). The quantity and purity of the RNA were determined from the absorbance at 258/280 nm. Total RNA was reverse-transcribed into cDNA using a high-capacity RNA-to-cDNA kit in accordance with the manufacturer’s protocol. A 7500 Fast Real-Time PCR system and real-time PCR kit (TaqMan® Gene Expression Assays) were employed based on the manufacturer’s instructions. β-Actin was used as an internal control. The contents of the primer/probe mixture are shown in Table 4.
Table 4.
Primer probe mixture of cytokines, Smads and β-actin
| Assay ID | Refseq | |
|---|---|---|
| Rat IL1-β | Rn99999011_m1 | NM_012589.1 |
| Rat IL6 | Rn99999017_m1 | NM_012675.2 |
| Rat TGF-β1 | Rn99999016_m1 | NM_021578.2 |
| Rat Smad3 | Rn00565331_m1 | NM_013095.2 |
| Rat Smad7 | Rn00578319_m1 | NM_030858.1 |
| Rat β-actin | Rn00667869_m1 | NM_031144.2 |
TaqMan® Gene Expression Assays (Applied Biosystems).
Statistical analysis
All data are expressed as the mean ± SD. Statistical analyses were performed by one-way ANOVA, followed by Bonferroni’s post hoc test, employing Kaleida Graph ver. 4 for Windows (Hulinks Inc., Tokyo, Japan). Differences were considered to be significant at p<0.05.
Results
In vivo study
Liver and plasma lipid content, and hepatic expression of MTP mRNA
At 2 and 5 h after TNF-α administration, the liver TG content was markedly increased in the TNF group relative to the Cont group, but was significantly decreased in the αT + T3/TNF group compared with the TNF group (Fig. 1A). Moreover, amelioration of lipid accumulation was confirmed by histopathological examination in the αT + T3/TNF group (Fig. 1C). Also the expression of MTP mRNA did not differ between the groups at 2 h after TNF-α administration (data not shown). After 5 h, the expression of MTP mRNA in the TNF group tended to be decreased relative to the Cont group; however, the decrease of MTP mRNA expression was inhibited in the αT/TNF group and the αT + T3/TNF group (Fig. 1B). At 5 h after TNF-α administration, the TG concentration in plasma was decreased in the TNF, αT/TNF and T3/TNF groups. However, the decrease was less obvious in the αT + T3/TNF group (Table 5). These results suggested that VLDL synthesis and VLDL-TG secretion were improved by T3 intake. Additively, amelioration of lipid accumulation was confirmed by histopathological examination in the αT + T3/TNF group (Fig. 1C).
Fig. 1.
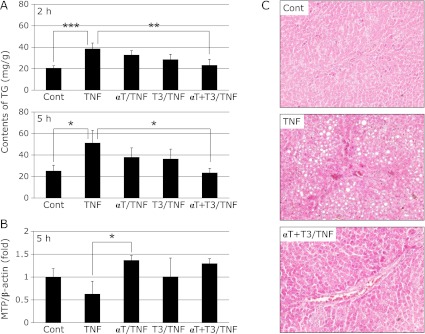
Effects of vitamin E analogs on TG contents of rat liver 2 h or 5 h after administration of GalN/TNF-α (A), MTP mRNA expression in rat liver at 5 h after administration of GalN/TNF-α (B), and histopathological examination (stained with hematoxylin-eosin; original magnification × 400, arrowheads indicate lipid droplets) (C) in rat liver 5 h after administration of GalN/TNF-α. Cont; Control group, TNF; TNF-α, GalN dosage group, αT/TNF; α-Toc-enriched diet and TNF-α/GalN dosage group, T3/TNF; T3-enriched diet and TNF-α/GalN dosage group, αT + T3/TNF; α-Toc and T3-enriched diet and TNF-α/GalN dosage group. The values are mean ± SD for 4 rats. Statistical analysis was performed by one-way ANOVA, followed by Bonferroni’s post hoc test (*p<0.05, **p<0.01, ***p<0.001).
Table 5.
Activities of liver damage markers and plasma lipid concentrations at 5 h after administration of TNF-α/GalN
| Cont | TNF | αT/TNF | T3/TNF | αT + T3/TNF | |
|---|---|---|---|---|---|
| AST (IU/l) | 109.50 ± 30.02a | 348.25 ± 216.73b | 186.75 ± 121.95a,b | 181.00 ± 2.65a,b | 151.00 ± 41.61a,b |
| ALT (IU/l) | 30.75 ± 13.86a | 232.50 ± 129.65b | 169.25 ± 89.20a,b | 120.67 ± 25.56a,b | 77.00 ± 44.66a,b |
| TG (mg/dl) | 32.00 ± 6.14a | 10.25 ± 2.43b | 14.25 ± 6.30b | 19.00 ± 0.89b | 20.33 ± 2.07a,b |
| CHO (mg/dl) | 37.25 ± 3.41 | 31.00 ± 2.37 | 29.00 ± 10.32 | 45.25 ± 13.19 | 46.33 ± 1.37 |
Effects of vitamin E analogs on liver damage marker activity and lipid concentration in plasma : 5 h after TNF-α administration, plasma samples were taken and the liver damage marker activities and lipid concentraion were measured. Cont; vitamin E-deficient high-fat diet group, TNF; vitamin E-deficient high-fat diet + TNF/GalN group, αT/TNF; α-Toc-enriched high-fat diet + TNF/GalN group, T3/TNF; T3-enriched high-fat diet + TNF/GalN group, αT + T3/TNF; α-Toc and T3-enriched high-fat diet + TNF/GalN group. The values are mean ± SD for 4 rats (one-way ANOVA followed by Bonferroni’s post hoc test). There is a significant difference between a and b.
Activities of liver damage markers
At 2 h after TNF-α administration, there were no differences in AST and ALT activity among the groups (data not shown). Five hours later, these activities were significantly increased in the TNF group compared with the other groups, but tended to be suppressed in the vitamin E analog-treated groups. The activities were especially low in αT + T3 group (Table 5).
Liver TBARS value
The liver TBARS value was lowest in the αT + T3/TNF group, suggesting that antioxidative ability was reinforced and longer-lasting when T3 and α-Toc were added at the same time (Fig. 2).
Fig. 2.

Effects of vitamin E analogs on TBARS contents of rat liver at 2 h or 5 h after administration of GalN/TNF-α. Cont; Control group, TNF; TNF-α/GalN dosage group, αT/TNF; α-Toc-enriched diet and TNF-α/GalN dosage group, T3/TNF; T3-enriched diet and TNF-α/GalN dosage group, αT + T3/TNF; α-Toc and T3-enriched diet and TNF-α/GalN dosage group. The values are mean ± SD for 4 rats. Statistical analysis was performed by one-way ANOVA, followed by Bonferroni’s post hoc test (*p<0.05, **p<0.01).
Expression of cytokine mRNAs
At 2 h after TNF-α administration, the hepatic expression of both IL1-β and IL6 mRNA was markedly increased in the TNF group relative to the Cont group. This increase of IL1-β mRNA expression was significantly inhibited by intake of α-Toc or simultaneous intake of α-Toc and T3. However, there was no effect of vitamin E intake 5 h later (Fig. 3A). On the other hand, the increase of IL6 mRNA expression was significantly inhibited in the T3/TNF and αT + T3/TNF groups (Fig. 3B). At 2 h after TNF-α administration, the expression of TGF-β1 mRNA was significantly increased in the TNF group relative to the Cont group, but the increase was suppressed by T3 intake (Fig. 4A). Moreover, inhibition of liver fibrosis was confirmed by histopathological examination in the αT + T3/TNF group (Fig. 4B).
Fig. 3.

The mRNA expressions of IL1-β (A) and IL6 (B) in rat liver at 2 h or 5 h after administration of GalN/TNF-α. Cont; Control group, TNF; TNF-α/GalN dosage group, αT/TNF; α-Toc-enriched diet and TNF-α/GalN dosage group, T3/TNF; T3-enriched diet and TNF-α/GalN dosage group, αT + T3/TNF; α-Toc and T3-enriched diet and TNF-α/GalN dosage group. The values are mean ± SD for 4 rats. Statistical analysis was performed by one-way ANOVA, followed by Bonferroni’s post hoc test (*p<0.05, **p<0.01, ***p<0.001).
Fig. 4.
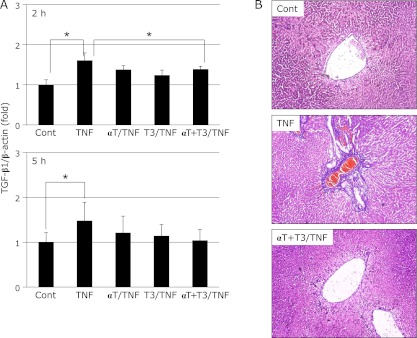
The mRNA expression of TGF-β1 in rat liver at 2 h or after administration of GalN/TNF-α (A) and histopathological examination (AZAN staining; original magnification ×400, arrowheads indicate fibrosing site) (B) in rat liver after administration of GalN/TNF-α 5 h. Cont; Control group, TNF; TNF-α/GalN dosage group, αT/TNF; α-Toc-enriched diet and TNF-α/GalN dosage group, T3/TNF; T3-enriched diet and TNF-α/GalN dosage group, αT + T3/TNF; α-Toc and T3-enriched diet and TNF-α/GalN dosage group. The values are mean ± SD for 4 rats. Statistical analysis was performed by one-way ANOVA, followed by Bonferroni’s post hoc test (*p<0.05).
In vitro study
Establishment of a steatohepatitis model using rat hepatocytes
The expression of IL6 mRNA was significantly increased at 4 h after addition of 1.0 nM TNF-α. IL6 mRNA expression was significantly increased at 8 h after addition of both 0.1 nM and 0.5 nM TNF-α. On the other hand, TGF-β1 mRNA expression was significantly increased 4 h after addition of 1.0 nM TNF-α, and was restored immediately afterwards (Supplemental Fig. 1A*). The TG content of primary hepatocytes isolated from rats fed the high-fat diet was significantly increased compared with control rat hepatocytes (Supplemental Fig. 1B*). However, the TG content was decreased to the control level after culture for 72 h. From these results, we decided to use a TNF-α concentration of 1.0 nM, and to collect the cells at 4 h after addition of TNF-α.
Effect of T3 on expression of mRNAs for inflammatory cytokines, MTP and TGF-β1 signaling proteins
Expression of mRNAs for IL1-β and IL6 was significantly increased in the TNF group, but the increase was suppressed by addition of α-T3 or γ-T3 (Fig. 5A). Furthermore, γ-T3 inhibited the expression of TGF-β1 mRNA. Smad3 mRNA expression also tended to decrease after γ-T3 addition (Fig. 5C). These effects were considered to contribute to amelioration of inflammation and fibrosis. Expression of mRNA for MTP was decreased by TNF-α stimulation, there was no effects of the addition of α-T3 or γ-T3 (Fig. 5B).
Fig. 5.

The mRNA expression of inflammatory cytokines (A), MTP (B) and TGF-β1 and Smads, TGF-β1 signaling proteins (C) in rat primary hepatocytes at 4h after TNF-α stimulation. Cont; Control group, TNF; TNF-α stimulation group, α-T3 + TNF; α-T3 addition and TNF-α stimulation group, γ-T3 + TNF; γ-T3 addition and TNF-α stimulation group. The values are mean ± SD for 3 samples. Statistical analysis was performed by one-way ANOVA, followed by Bonferroni’s post hoc test (*p<0.05, **p<0.01, ***p<0.001).
Discussion
We established for the first time a rat model of steatohepatitis induced by a high-fat diet and treatment with TNF-α/GalN. TNF-α is a well known inflammatory cytokine participating in the development of NASH. Our present findings suggested that TNF-α administration induced further accumulation of lipid. However, expression of mRNAs for liver damage markers and inflammatory cytokines was not increased by TNF-α administration alone (Supplemental Fig. 2A and B*). Therefore, we administered GalN to induce endotoxin shock and inflammation beforehand. As a result, ALT activity and IL1-β mRNA expression were increased (Supplemental Fig. 2C*). Furthermore, inflammation was observed histopathologically (Supplemental Fig. 2D*). In addition, TGF-β1 mRNA expression was increased by TNF-α/GalN dosage (Supplemental Fig. 3A*), and liver fibrosis was confirmed by histopathological examination (Supplemental Fig. 3B*). These histopathological findings resembled those of NASH. Therefore, we adopted the TNF-α/GalN dosage model as our steatohepatitis model.
Next, we investigated the effects of simultaneous α-Toc and T3 intake in this rat model. Liver lipid accumulation was induced by TNF-α/GalN treatment, and suggesting that this had been caused by down-regulation of MTP mRNA expression. It has been reported that inflammatory cytokine stimulation decreases the hepatic expression of MTP mRNA.(11,12) Accordingly, we assumed that this effect was due to IL1 or IL6, and predicted that IL1 and IL6 induced by TNF-α would decrease the expression of MTP mRNA synergistically in this TNF-α/GalN rat model. TG accumulation in the liver was significantly reduced by αT + T3 intake (Fig. 1A). Expression of MTP mRNA in rat liver tended to be restored in the αT + T3/TNF group (Fig. 1B). Therefore, we hypothesized that up-regulation of MTP mRNA expression would contribute to inhibition of liver lipid accumulation. We have already reported that T3 controlled TG accumulation in the liver and ameliorated the liver damage induced by carbon tetrachloride (CCl4) in rats.(13) We considered that liver lipid accumulation would be caused by deactivation of fatty acid metabolic enzymes in an acute hepatitis model such as that induced by CCl4. Also, some reports have indicated that lipid peroxide deactivates fatty acid-metabolizing enzymes.(14,15) In the present study, the TBARS content was decreased in the αT + T3/TNF group. Accordingly, we assumed that inhibition of liver lipid accumulation by T3 would be attributable to protection of fatty acid-metabolizing enzymes by antioxidative activity. Moreover, it was suggested that antioxidative activity was reinforced by simultaneous intake of α-Toc and T3. The stronger resulting antioxidative ability might partly inhibit the accumulation of liver lipid.
AST and ALT activity in plasma tended to decrease in the T3 intake group compared with the TNF group, and was lower in the αT + T3 intake group relative to the TNF group. These results suggested that T3 intake is effective for reducing hepatic inflammation, and that these effects were reinforced by intake of α-Toc and T3 simultaneously. Recently, it has been reported that T3 inhibits UV-induced cutitis in mice via inhibition of the expression of inflammatory cytokines and signaling factors.(16) In the present study, hepatic expression of mRNAs for inflammatory cytokines was inhibited in the T3 group and the αT + T3 group. Hence, we concluded that inhibition of inflammatory cytokine mRNA expression would impact on the progression of steatohepatitis.
It is well known that overexpression of TGF-β1 mRNA causes liver fibrosis. Moreover, it is clear that overexpression of TGF-β1 mRNA is induced by increased expression of mRNA for inflammatory cytokines such as TNF-α, IL1 and IL6.(17) In fact, hepatic expression of TGF-β1 mRNA was increased by TNF-α treatment in this steatohepatitis model. Furthermore, fibrosis around veins was confirmed in the TNF group by histopathological examination with azan staining. On the other hand, liver fibrosis was inhibited by intake of T3, and hepatic expression of TGF-β1 mRNA tended to decrease in this group. In particular, expression of TGF-β1 mRNA was significantly decreased in the αT + T3/TNF group at 2 h after TNF-α treatment. These results suggest that T3 regulates liver fibrosis by inhibiting the overexpression of TGF-β1 mRNA. These effects may be exerted through inhibition of inflammatory cytokine expression. The Smad proteins are nuclear effectors of TGF-β that can regulate transcription. One of the Smad family, Smad3, shows intrinsic sequence-specific DNA-binding activity. On the other hand, the major cellular function of Smad7 is inhibition of TGF-β1 signaling. In this study, Smad3 mRNA expression tended to increase upon TNF-α stimulation in rat hepatocytes. The expression of Smad3 mRNA tended to be inhibited by addition of γ-T3, but not to a significant degree. However, it is expected that phosphorylation of Smad3 would have been inhibited because TGF-β1 mRNA expression was decreased.
In conclusion, our findings suggest that intake of T3 inhibits lipid accumulation, inflammation and fibrosis in the liver in this rat model of steatohepatitis. These effects are reinforced synergistically by simultaneous intake of α-Toc and T3.
Acknowledgments
This work was supported by the grant from Eisai Food & Chemical Co., Ltd.
Abbreviations
- ALT
alanine transferase
- AST
asparagine transferase
- IL1-β
interleukin 1-β
- IL6
interleukin 6
- MCP-1
monocyte chemotactic factor-1
- NASH
non-alcoholic steatohepatitis
- Smad
signaling mother against decapentaplegic
- TBARS
thiobarbituric acid reactive substances
- TG
triglyceride
- TGF-β1
transforming growth factor-β1
- TNF-α
tumor necrosis factor-α
- Toc
tocopherol
- T3
tocotrienol
Conflict of Interest
No potential conflicts of interest were disclosed.
Supplementary Material
References
- 1.Ludwig J, Viggiano TR, McGill DB, Oh BJ. Nonalcoholic steatohepatitis: Mayo Clinic experiences with a hitherto unnamed disease. Mayo Clin Proc. 1980;55:434–438. [PubMed] [Google Scholar]
- 2.Day CP, James OF. Steatohepatitis: a tale of two ”hits”? Gastroenterology. 1998;114:842–845. doi: 10.1016/s0016-5085(98)70599-2. [DOI] [PubMed] [Google Scholar]
- 3.Levine JA, Jensen MD, Eberhardt NL, O’Brien T. Adipocyte macrophage colony-stimulating factor is a mediator of adipose tissue growth. J Clin Invest. 1998;101:1557–1564. doi: 10.1172/JCI2293. [DOI] [PMC free article] [PubMed] [Google Scholar]
- 4.Sartipy P, Loskutoff DJ. Monocyte chemoattactant protein 1 in obesity and insulin resistance. Proc Natl Acad Sci USA. 2003;100:7265–7270. doi: 10.1073/pnas.1133870100. [DOI] [PMC free article] [PubMed] [Google Scholar]
- 5.Hasegawa T, Yoneda M, Nakamura K, Makino I, Terano A. Plasma transforming growth factor-β1 level and efficacy of α-tocopherol in patients with non-alcoholic steatohepatitis: a pilot study. Aliment Pharmacol Ther. 2001;15:1667–1672. doi: 10.1046/j.1365-2036.2001.01083.x. [DOI] [PubMed] [Google Scholar]
- 6.Folch J, Lees M, Sloane Stanley GH. A simple method for the isolation and purification of total lipides from animal tissues. J Biol Chem. 1957;226:497–509. [PubMed] [Google Scholar]
- 7.Ohkawa H, Ohishi N, Yagi K. Assay for lipid peroxides in animal tissues by thiobarbituric acid reaction. Anal Biochem. 1979;95:351–358. doi: 10.1016/0003-2697(79)90738-3. [DOI] [PubMed] [Google Scholar]
- 8.Ueda T, Ichikawa H, Igarashi O. Determination of α-tocopherol stereoisomers in biological specimens using chiral phase high-performance liquid chromatography. J Nutr Sci Vitaminol (Tokyo) 1993;39:207–219. doi: 10.3177/jnsv.39.207. [DOI] [PubMed] [Google Scholar]
- 9.Umeda-Sawada R, Fujiwara Y, Abe H, Seyama Y. Effects of sesamin and capsaicin on the mRNA expressions of Δ6 and Δ5 desaturases in rat primary cultured hepatocytes. J Nutr Sci Vitaminol (Tokyo) 2003;49:442–446. doi: 10.3177/jnsv.49.442. [DOI] [PubMed] [Google Scholar]
- 10.Tenoutasse S, Van Vliet G, Ledru E. IGF-I transcript levels in whole-liver tissue, in freshly isolated hepatocytes, and in cultured hepatocytes from lean and obese Zucker rats. Horm Res. 2003;59:135–141. doi: 10.1159/000069066. [DOI] [PubMed] [Google Scholar]
- 11.Björkegren J, Beigneux A, Bergo MO, Maher JJ. Blocking the secretion of hepatic very low density lipoproteins renders the liver more susceptible to toxin-induced injury. J Biol Chem. 2002;277:5476–5483. doi: 10.1074/jbc.M108514200. [DOI] [PubMed] [Google Scholar]
- 12.Navasa M, Gordon DA, Hariharan N, et al. Regulation of microsomal triglyceride transfer protein mRNA expression by endotoxin and cytokines. J Lipid Res. 1998;39:1220–1230. [PubMed] [Google Scholar]
- 13.Yachi R, Igarashi O, Kiyose C. Protective effects of vitamin E analogs against carbon tetrachloride-induced fatty liver in rats. J Clin Biochem Nutr. 2010;47:148–154. doi: 10.3164/jcbn.10-35. [DOI] [PMC free article] [PubMed] [Google Scholar]
- 14.Rao KS, Recknagel RO. Early onset of lipoperoxidation in rat liver after carbon tetrachloride administration. Exp Mol Pathol. 1968;9:271–278. doi: 10.1016/0014-4800(68)90041-5. [DOI] [PubMed] [Google Scholar]
- 15.Masuda Y, Murano T. Carbon tetrachloride-induced lipid peroxidation of rat liver microsomes in vitro. Biochem pharmacol. 1977;26:2275–2281. doi: 10.1016/0006-2952(77)90291-x. [DOI] [PubMed] [Google Scholar]
- 16.Shibata A, Nakagawa K, Kawakami Y, Tsuzuki T, Miyazawa T. Suppression of gamma-tocotrienol on UVB induced inflammation in HaCaT keratinocytes and HR-1 hairless mice via inflammatory mediators multiple signaling. J Agric Food Chem. 2010;58:7013–7020. doi: 10.1021/jf100691g. [DOI] [PubMed] [Google Scholar]
- 17.Anstee QM, Goldin RD. Mouse models in non-alcoholic fatty liver disease and steatohepatitis research. Int J Exp Pathol. 2006;87:1–16. doi: 10.1111/j.0959-9673.2006.00465.x. [DOI] [PMC free article] [PubMed] [Google Scholar]
Associated Data
This section collects any data citations, data availability statements, or supplementary materials included in this article.