

Abstract
Objective
To evaluate the interaction of articular cartilage (AC) and subchondral bone (SB) through analysis of osteoarthritis (OA)-related genes of site-matched tissue.
Design
We developed a novel method for isolating site-matched overlying AC and underlying SB from three and four regions of interest respectively from the human knee tibial plateau (n=50). For each site, the severity of cartilage changes of OA were assessed histologically, and the severity of bone abnormalities were assessed by microcomputed tomography. An RNA isolation procedure was optimized that yielded high quality RNA from site-matched AC and SB tibial regions. Q-PCR analysis was performed to evaluate gene expression of 61 OA-associated genes for correlation with cartilage integrity and bone structure parameters.
Results
A total of 27 (44%) genes were coordinately up or down regulated in both tissues. The expression levels of 19 genes were statistically significantly correlated with the severity of AC degeneration and changes of SB structure; these included: ADAMTS1, ASPN, BMP6, BMPER, CCL2, CCL8, COL5A1, COL6A3, COL7A1, COL16A1, FRZB, GDF10, MMP3, OGN, OMD, POSTN, PTGES, TNFSF11 and WNT1.
Conclusions
These results provide a strategy for identifying targets whose modification may have the potential to ameliorate pathological alterations and progression of disease in both AC and SB simultaneously. In addition, this is the first study, to our knowledge, to overcome the major difficulties related to isolation of high quality RNA from site-matched joint tissues. We expect this method to facilitate advances in our understanding of the coordinated molecular responses of the whole joint organ.
Keywords: Subchondral bone, cartilage, RNA isolation, Gene expression, Bone sectioning and grinding, Osteoarthritis
Introduction
Osteoarthritis (OA) is a disease of the whole joint organ involving pathological changes of articular cartilage (AC), structural changes of underlying subchondral bone (SB) and synovitis [1]. Maintenance of normal joint structure and function relies on load adaptation of the cartilage and bone. Disruption of the physiological relationship between these tissues contributes to the development of OA pathology [2, 3]. Although it is debated whether skeletal adaptations antedate detectable alterations in the structural integrity of the AC, numerous clinical and experimental studies have confirmed that increased bone volume and changes in bone quality of the tibial SB of the knee are related to loss of AC integrity [4-8]. The cellular system of the SB adapts rapidly in response to adverse mechanical influences [9]. It also appears that factors released from bone cells might affect cartilage metabolism [10, 11]. These studies provide insights into the association of mechanical load with OA and highlight the close relationship between the SB structural changes and alterations in AC.
Despite the fact that some of the most promising therapeutics for OA are agents that target bone, including bisphosphonates [12, 13], calcitonin [14] and vitamin D [15], all the gene expression studies in OA have been performed on AC or synovium and none have been performed on human SB tissue directly. This is most likely due to the difficulties associated with isolation of RNA from SB. The SB adheres tightly to the overlying AC and contains cells and abundant mineralized extracellular matrix (ECM) that negatively impacts the ability to purify RNA. For these reasons, SB might be one of the most difficult tissues from which to extract nucleic acid.
We developed a novel method for extracting high quality nucleic acid from bone that relies on finely grinding the desired regions of the knee tibial plateau under liquid nitrogen. By controlling the depth of drill penetration we could reliably separate and isolate articular cartilage and site-matched subchondral bone with high fidelity. We also set up a model system based on four specific regions of interest within a joint corresponding to a gradient of disease severities; this system can be used to represent different disease severity states of OA. With this method we have been able to address the goal of this study: To understand the coordinated molecular responses of the AC-SB unit of the OA knee. To our knowledge, this represents the first direct assessment of gene expression in OA of site-matched AC and SB.
Materials and Methods
Human knee joint tissues
Human tibial plateaus were obtained during total knee joint replacement surgery from 50 patients with medial compartment knee OA, comprising 32 females and 18 males (mean age 69 years, range 51-91 years). To ensure consistency of sampling of prespecified regions of interest, the anatomic orientation was indicated on the freshly isolated specimens by marker pen then all specimens were stored immediately in liquid nitrogen. The study was approved by the institutional review board of all the participating hospitals and Academia Sinica, Taiwan, and written informed consent was obtained from all of the participants.
Regions of interest
The regions of interest chosen for this study were informed by prior work of Appleyard [16] and our preliminary analyses of 26 regions of three human tibial plateau specimens (Supplementary Figure 1). We were able to reduce our analyses to four specific regions encompassing a full range of histological severity in knee OA specimens: (a) the outer region of the lateral tibial plateau (oLT, excluding adjacent fibrocartilage) with a visibly smooth AC surface (Figure 1d and regions 2+3 in Appleyard’s study); (b) the inner lateral tibial plateau (iLT) with sufficient AC to detect visible fissures on tissue crossection (Figure 1e and regions 10+11 in Appleyard’s study); (c) the inner medial tibial plateau (iMT), a region on the inner side of the MT with visible loss of AC (Figure 1f and regions 16+17+20+21 in Appleyard’s study); (d) the central medial tibial plateau (cMT), the central region of the MT with near full thickness loss of AC (Figure 1f and regions 20+21+24+25 in Appleyard’s study). Regions of interest were ~2mm in width, ~2-4 cm in length, and ~5mm in height. If regions of the tibial plateau were too small to section or too thin to analyze, these regions were excluded from further analysis; in total, 50 oLT and 50 iLT regions could be tested, but only 38 of 50 iMT and 36 of 50 cMT regions had sufficient cartilage and bone for sample analysis.
Figure 1. Custom tools for joint tissue sectioning and sites of analysis and regions for RNA isolation.
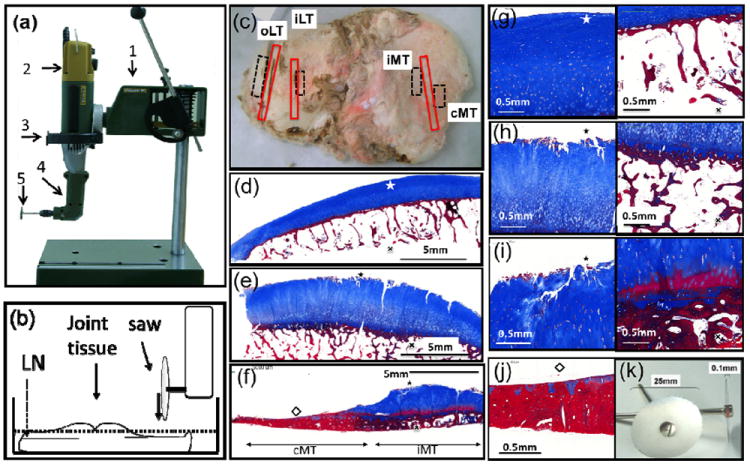
(a) The workstation was constructed from commercially available components: (1) a rotary tool holder; (2) a high speed rotary motor, (3) custom adapter, (4) a 90 Angle Adaptor and (5) a 25mm diameter cutting disc of 0.1mm thickness for grinding tissue. (b) Joint tissue bathed in liquid nitrogen (LN) ready for sectioning. (c) Human osteoarthritic knee tibial plateau; the red boxes indicate regions for micro CT and histological analysis at the 4 regions of interest; the dashed boxes demonstrate regions for RNA isolation: (d) outer lateral tibia (oLT); (e) inner lateral tibia (iLT); (f) inner medial tibia (iMT); and the central medial tibia (cMT) devoid of cartilage. Osteophytes were not included in the sampling by the nature of the prespecified locations chosen. Masson stained photomicrographs of AC (left) and site matched SB (right) from the following regions: (g) oLT, (h) iLT, (i) iMT and (j) cMT. (k) Cutting discs, 0.1mm thick, 25mm diameter.
Joint tissue sectioning
The workstation, used to section regions of interest from the isolated tibial plateaus, was constructed primarily from commercially available components: a rotary tool holder (PROXXON, no28606, Germany); a high speed rotary motor (PROXXON, no38481, Germany), custom adapter (Academia Sinica, Taiwan), a 90 Angle Adaptor (PROXXON, no28405, Germany) (Figure 1a); and a 25mm diameter cutting disc of 0.1mm thickness for grinding tissue (Busch, S606025s, Germany) (Figure 1k). Tissues were sectioned to generate 2mm thick slices of intact cartilage and attached bone from regions of interest for histology as well as adjacent regions for subsequent grinding and RNA isolation. To prevent RNA degradation, and to precisely obtain specimens of a particular type from specific regions of interest of the joint, the tissues were manipulated at all times under liquid nitrogen in a thermally insulated styrofoam container (Figure 1b). Three 2-2.5 mm-thick osteochondral slabs were generated for further microCT scanning and histological staining (Figure 1c).
Tissue grinding
After trimming specimens under liquid nitrogen, longitudinal sections of the tibial plateaus were exposed. Cartilage (white coloration) and subchondral bone (pink coloration) could be observed. To harvest specimens of overlying AC separately from the underling SB, the high-speed rotary tool was carefully lowered onto the cartilage surface and grinding was carried out in a mortar filled with liquid nitrogen (to prevent RNA degradation) until the subchondral bone boundary was reached. The ground cartilage powder that sank to the bottom of the mortar was carefully decanted into a 50 ml tube. The same procedure was performed for the subchondral bone. The ground tissue powders from the AC and SB were stored in -80°C until RNA extraction. The absence of heat generation while grinding under liquid nitrogen was confirmed by thermal imaging (Figure 2).
Figure 2. Sectioning and grinding methods for separating overlying AC and underlying SB.
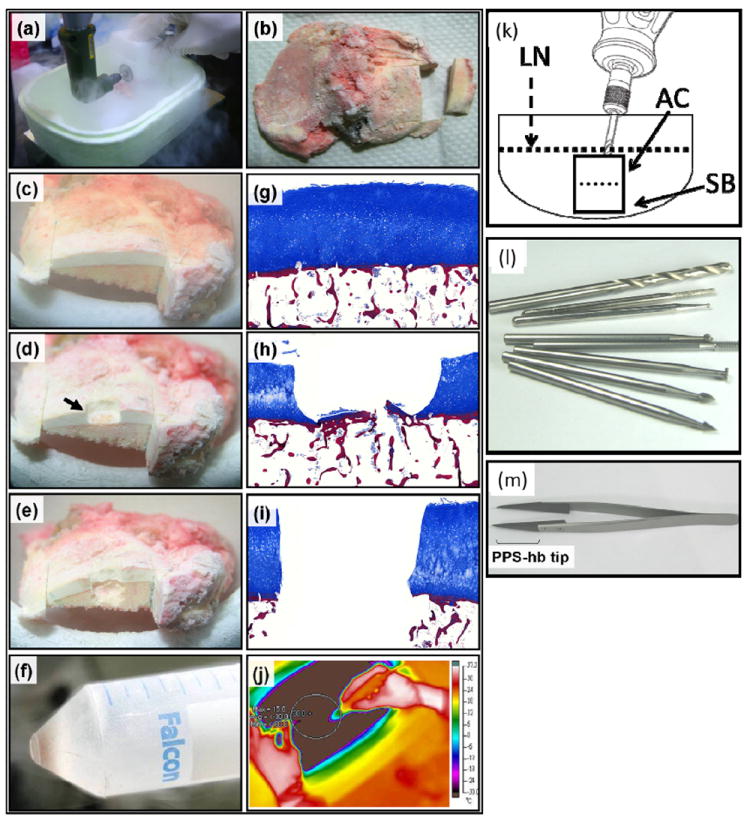
(a-b) The custom-made mini bone saw workstation was utilized to section regions of interest in liquid nitrogen. (c) Tissue elements could be clearly distinguished consisting of white overlying articular cartilage (AC) and light pink/yellow underlying subchondral bone (SB). (d) The black arrow depicts a region from which cartilage has been ground off by the high speed rotary grinder. (e) Site-matched SB subsequently ground off below the corresponding overlying AC. (f) An example of the powdered tissue collected by decanting the liquid N2 into a tube for further manipulation. (g-i) Masson staining was performed to illustrate the stages of the procedure through histologic examination of the tissue. Cartilage was stained with blue color and Bone was stained with red color. Original magnification ×10. (k) The entire process was performed in liquid nitrogen and were carried out below -30 °C. (j) Minimal heat was generated by the drilling procedure as demonstrated by thermal imaging. Wolfram vanadium steel milling bits for precision grinding, Ø 2.35mm. (l) PPS-hb (polyurthane resin) tip forceps with low temperature resistance used to stabilize samples during manipulation.
RNA extraction
RNA was isolated from the four prespecified regions of interest for 8 individual specimens; these 8 specimens were chosen on the basis of having a gradient of lesion severity across the tibial plateau and adequate amounts of bone and cartilage tissue from each of the regions for RNA isolation. These 8 subjects were representative of the whole sample set (overall similar mean age of 68 years and similar gender distribution with 38% male). Approximately 100 mg of powdered AC or SB from each region of interest was obtained for RNA extraction. 5ml of Trizol (Invitrogen, CA) were added to 100 mg (dry weight) of the ground tissue powder and mixed by vortexing until homogeneous. The remaining protocol is described in supplementary protocol. The RNA concentration and purity were determined by a Nano-Drop (NanoDrop Technologies, DE). The RNA integrity number (RIN) and 28s/18s ratio were estimated using the RNA 6000 Nano Assays on an Agilent 2100 Bioanalyzer (Agilent Technologies, CA).
Histological scoring of cartilage and bone
Adjacent to the regions ground for RNA, we obtained cartilage-bone sections of approximately 2 mm diameter from the tibial plateau for histological and bone structure evaluation of all 50 specimens. Sections were fixed in 4% paraformaldehyde (4%PFA) (Sigma-Aldrich, Mo) overnight and decalcified in 10% ethylenediamine-N,N,N’,N’-tetra-acetic acid, disodium salt, dehydrate (EDTA2Na) (Sigma-aldrich, Mo) for two weeks. After decalcification, the sections were embedded in paraffin and 10 μm sections were prepared, then deparaffinized, hydrated and treated with Masson’s trichrome stain according to the manufacturer’s instructions (Sigma-Aldrich, Mo).
Digital images of each section were acquired at 200x magnification using a Mirax Scan (Carl Zeiss, Germany). After routine histological processing, sections were scored on a six level histopathological grading scale (G1-6) and a five level staging scale (S0-4) based on the Osteoarthritis Research Society International (OARSI) Osteoarthritis Cartilage Histopathology Assessment System [17]; the overall score was computed as the product of the grade and stage. Two graders performed the assessments, blinded to the topographical origin of each slide. They scored three consecutive sections of every specific region of the OA tibial plateau; the results were averaged to achieve a final OARSI histopathological score for each joint site of each joint (possible range 0 - 24).
Microcomputed tomography
Regions of interest were sectioned from the tibial plateau extending from the surface to the subarticular tissue beneath the calcified cartilage (~2mm width, 2~4cm length, and ~5mm height). The sections were fixed in 4% PFA overnight at 4°C then scanned in a high performanceμCT scanner, SKYSCAN 1076 (SKYSCAN, Belgium) at a resolution of 18μm. After scanning, the bone mineral density (BMD) was determined for a volume of interest (~2mm width, ~5mm length, and ~5mm height) using the CT Analyser software (SKYSCAN, Kontich, Belgium). Three-dimensional reconstruction was performed to obtain the bone structural parameters that included the following: percent bone volume (BV/TV; %); the structure model index (SMI); trabecular thickness (Tb.Th; mm); trabecular number (Tb.N; mm-1); and trabecular separation (Tb.Sp; mm). SMI is an estimation of the plate-like or rod-like (cylindrical) characteristics of the subchondral bone structure. The ideal plate and cylindrical architectures have SMI values of 0 and 3 respectively [18]. A rod-like trabecular bone structure has higher mechanical strength than a plate-like structure [19].
Real time quantitative PCR
A total of 1600ng RNA from each section was converted into cDNA using Superscript III reverse transcriptase (Invitrogen, CA). A total of 64 genes were selected for gene expression analysis (Supplementary Table 1). Gene expression was determined by real time quantitative PCR (Q-PCR) using the Taqman high density microfluidic cards (Invitrogen, CA) according to the manufacturer’s instructions. The Q-PCR reactions were performed on the ABI Prism 7900HT Sequence Detection system and the fluorescent signal intensity was analyzed by Sequence Detector v2.3 software. The levels of cDNA among samples were normalized to the expression of GAPDH first and the ΔΔCt relative quantification method for calculating gene expression was then applied.
Statistical analysis
The normality of all the measures has been tested by the Kolmogorov-Smirnov test (Graphpad Prism v5.0, San Deigo, CA); this revealed that all parameters were normally distributed with the exception of BMD which violated this assumption for a very few of the regions studied (Supplementary Table 2). One-way ANOVA was used to determine differences among regions with respect to tibial OARSI scores, BV/TV, SMI, Tb.Th, Tb.N, and Tb.Sp. To control for type I error, the Bonferroni multiple comparison test was performed as a post-hoc analysis to determine the statistical significance of changes in cartilage integrity and bone parameter between regions. BMD data was analyzed with non-parametric Kruskal–Wallis test and Dunn’s post-hoc test. Student’s t-tests were used to assess differences in the means levels of expression for each gene between iLT, iMT, and cMT regions relative to the oLT region. Correlation between the histologic scores of the cartilage, site-matched bone parameters, and real-time PCR determined gene expression were calculated using Pearson correlation. P value < 0.05 was considered statistically significant.
Results
Model system
Histologic evaluation using the OARSI scoring system verified that cartilage pathology varied in severity by location. The greatest pathological changes occurred at the cMT region where there was complete cartilage loss and denuded sclerotic bone (Figures 1f, j). For the other regions, we observed the following histological findings: superficial zone delamination and mid layer cyst formation at iMT regions (Figures 1f, i); branched fissures of matrix and disorientation of chondron columns at iLT regions (Figures 1e, h); and predominantly an intact or only mildly fibrillated superficial zone in oLT regions (Figures 1d, g). Histological analysis indicated that cMT, iMT, and even the nearby iLT regions of each specimen had significantly more severe cartilage pathological changes than the oLT regions (P< 0.001) (Table 1).
Table 1.
Characteristics of the overlying AC and underlying SB by region of interest in the human knee tibial plateau (mean ± SD)
| Characteristics | oLT | iLT | iMT | cMT | |
|---|---|---|---|---|---|
| Cartilage Severity | OARSI | 5.24 ± 2.02 | 12 ± 3.04 | 17.5 ± 1.45 | 21.9 ± 0.49 |
| Percent bone volume | BV/TV,(%) | 22.9 ± 4.5 | 33.5 ± 8.81 | 61 ± 14.5 | 67.8 ± 12.5 |
| Structure model index | SMI | 1.59 ± 0.39 | 1.22 ± 0.61 | -0.79 ± 1.32 | -2.21 ± 2.03 |
| Trabecular thickness | Tb.Th,(mm) | 0.21 ± 0.04 | 0.28 ± 0.05 | 0.35 ± 0.07 | 0.4 ± 0.09 |
| Trabecular number | Tb.N,(1/mm) | 1.11 ± 0.2 | 1.22 ± 0.24 | 1.75 ± 0.26 | 1.73 ± 0.27 |
| Trabecular separation | Tb.Sp,(mm) | 0.5 ± 0.08 | 0.46 ± 0.12 | 0.28 ± 0.1 | 0.25 ± 0.09 |
| Bone mineral density | BMD,(gm/cm3) | 1 ± 0.06 | 1.05 ± 0.07 | 1.08 ± 0.08 | 1.08 ± 0.09 |
| AGE, (years) | 69.9 ± 7.75 | 70.7 ± 7.87 | 70.7 ± 7.26 | 70.8 ± 7.6 | |
| Numbers | 50 | 50 | 38 | 36 | |
Structural parameters of the subchondral bone
In our system, subchondral bone referred to the total subarticular tissue under the calcified cartilage, which included the subchondral bone plate and subarticular spongiosa and extended to 2-5mm depth depending on the individual specimen, The structure of the subchondral bone in the four regions was analyzed by μCT. The pathological changes in the bone were striking for their incremental and orderly step-wise progression beginning with the least affected area (oLT) through to the most affected area (cMT). The oLT regions were distinctly different from the other three regions and distinguished by the following characteristics: the lowest BV/TV; a rod-like trabecular architecture; the thinnest and least trabecular bone; the highest trabecular separation; and the lowest bone density. The iMT and cMT regions had predominantly sclerotic bone features compared to the oLT and iLT regions; in addition, the iMT and cMT regions had a higher bone volume, and a plate-like structure with thicker, denser and more abundant trabecular bone (Table 1 and Figure 3). There were no statistically significant gender differences for any parameter (Supplementary Table 3).
Figure 3. Quantification of underlying subchondral bone parameters of each of the four regions.
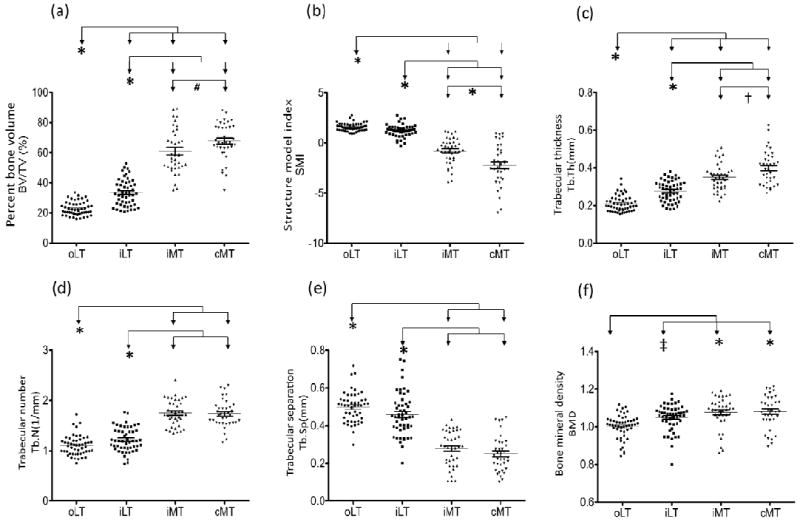
A total of 6 bone structural parameters were quantified for the 4 regions of interest of SB: (a) percent bone volume (BV/TV); (b) structure model index (SMI); (c) trabecular thickness (Tb.Th); (d) trabecular number (Tb.N); (e) trabecular separation (Tb.Sp); and (f) bone mineral density (BMD). Compared with lateral tibial sites, bone parameters from medial sites exhibited higher BV/TV, Tb.Th Tb.N, and BMD, but lower SMI and Tb.Sp. (oLT: n=50; iLT: n=50; iMT: n=38; cMT: n=36) Each bar represents the mean, and error bars represent SEM. *: P<0.001; #: P = 0.0253; †: P = 0.0069; ‡: P= 0.0114
Correlation between underlying subchondral bone features and overlying cartilage degeneration
The severity of articular cartilage degeneration, as assessed by OARSI scores, was significantly correlated with BV/TV (r=0.83, P<0.001), Tb.Th (r=0.75, P<0.001), Tb.N (r=0.68, P<0.001), and BMD (r=0.42, P<0.001) (Figures 2a, c, d, f), and inversely correlated with SMI (r= -0.7, P<0.001) and Tb.Sp (r= -0.7, P<0.001) (Figure 4). In addition, BV/TV represented the highest correlation with the degree of cartilage loss and other bone structure parameters (Supplementary Table 4). These data confirm the close association of the structural integrity of the AC and SB, and BV/TV as the key bone structural parameter corresponding to the severity of cartilage pathology.
Figure 4. Pearson’s correlation of OA severity of the overlying AC and structural parameters of the underlying SB.
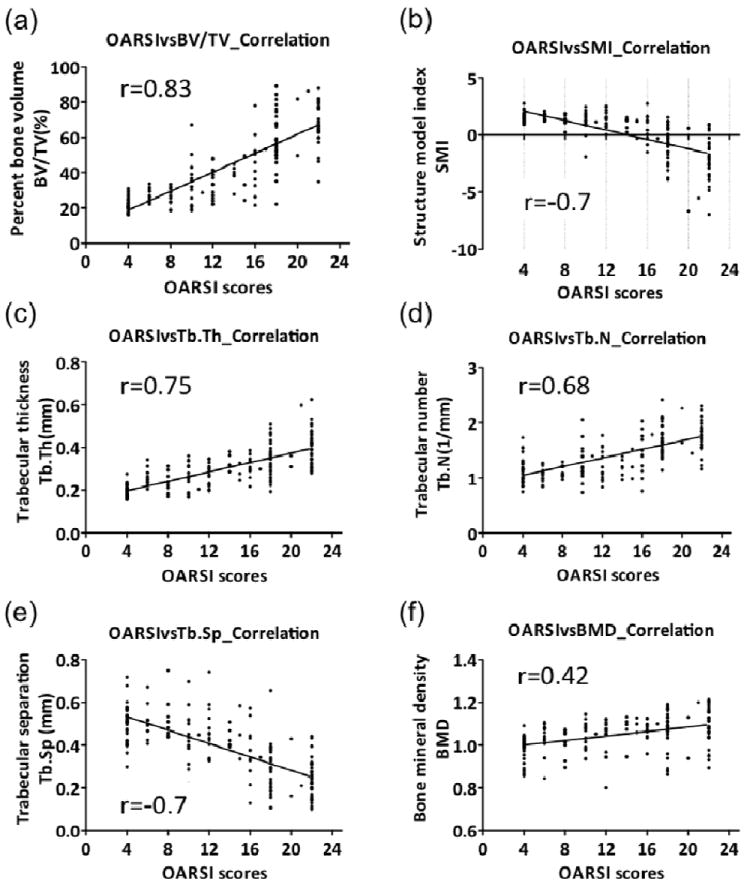
The data for all regions were combined for evaluation of the correlation between OA severity determined by the OARSI grading system, and the 6 bone structure parameters. Significant correlations were observed for OA severity and all the bone parameters: (a) percent bone volume (BV/TV) (r=0.83); (b) structure model index (SMI) (r= -0.7); (c) trabecular thickness (Tb.Th) (r=0.75); (d) trabecular number (Tb.N) (r=0.68); (e) trabecular separation (Tb.Sp) (r=-0.7); and (f) bone mineral density (BMD) (r=0.42).
Quality of the extracted RNA
All 56 RNA samples extracted from AC and SB had 28S/18S ratios greater than 1. The RIN values were all greater than 6, which demonstrated that high quality RNA was isolated from both AC and SB (Supplementary Table 5). On average, 100 mg of powdered tissue yielded 2.26 μg total RNA from cartilage and 3.29 μg total RNA from bone.
Expression levels of OA genes
Gene expression for 6 genes—3 AC-associated genes (COL2A1, COMP, and CRTAC1) and 3 SB-associated genes (COL1A1, COL1A2, and SPP1) [20-24]—confirmed minimal to no cross-contamination of these tissue elements during harvest by an experienced operator (Supplementary Figure 2). The gene expression (by real-time PCR normalized to GAPDH) for 61 genes was analyzed for three overlying AC and four underlying SB regions for 8 individuals totaling 56 specimens; the mean expression pattern of the oLT region was compared with the expression patterns in all the other regions of interest. The 61 genes selected for analysis were based on results of previous gene expression studies, candidate-gene approaches, and genome-wide association studies in OA [25-37]. Our novel system permitted the first assessment of coordinated gene expression in AC and site-matched SB. A total of 27 of the 61 genes (44%) were coordinately regulated (i.e. in the same direction with disease) in both tissues; 16 of 27 genes were coordinately up-regulated, and 11 of 27 genes were coordinately down-regulated in both tissue elements. A total of 20 of the 61 genes (33%) were significantly regulated only in SB (half of the 20 genes were up-regulated and the remainder down-regulated), and 10 of the 61 genes (16%) were significantly regulated only in AC (7 of the 10 genes were up-regulated, and 3 of the 10 genes were down-regulated); very few genes (4 of 61 genes) were oppositely regulated, i.e. expression altered but in opposite directions. Relative to oLT, the site-specific changes are depicted in Figure 5a (numbers of significantly up- or down-regulated genes), Table 2 (fold changes in gene expression) and supplementary Table 6 (exact p values in gene expression).
Figure 5. Genes correlating with OA severity and bone structural alterations.
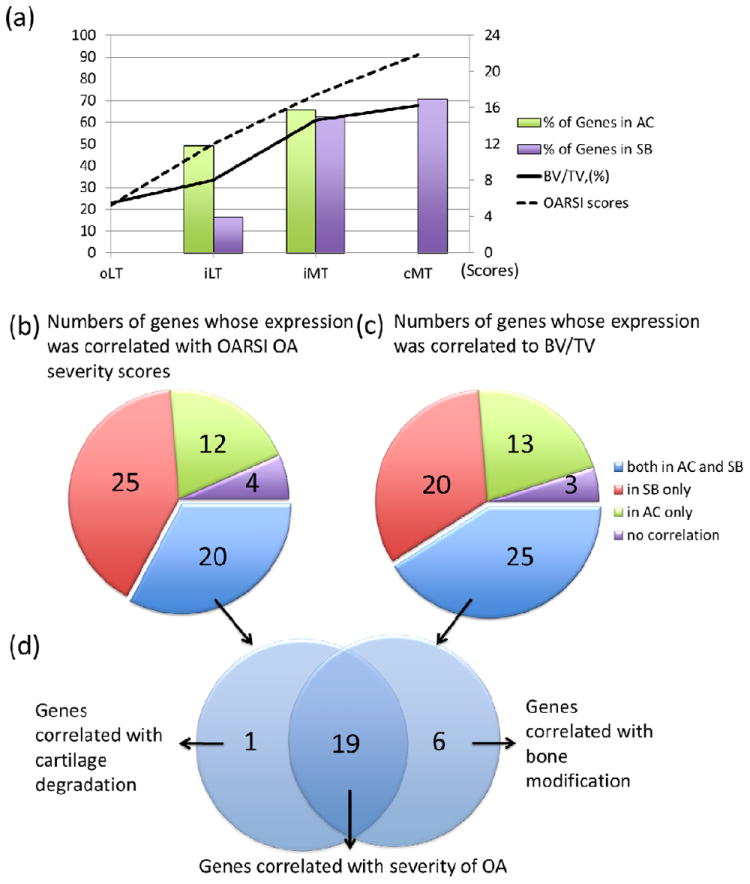
(a) Representation of cartilage degradation, bone volume augmentation and gene involvement in the regions of interest of the human OA knee tibia. Compared with gene expression levels of the oLT region, 30 of 61 and 40 of 61 genes showed significant fold-changes in iLT and iMT regoins in AC. Compared with gene expression levels of the oLT region, 10 of 61, 38 of 61 and 43 of 61 genes in the iLT, iMT and cMT regions showed significant fold-changes in SB. The increasing trends in cartilage loss (OARSI score) and bone structural changes (BV/TV, %) are displayed. (b) 20 of 61 genes were significantly regulated in both AC and SB, and were correlated with cartilage loss. (c) 25 of 61 genes were significantly regulated in both AC and SB, and correlated with structural alterations of the bone. (d) Venn diagram depicting 19 genes that genes correlated with OA severity and bone structural abnormalities including the following: ADAM metallopeptidase with thrombospondin type 1 motif, 14 (ADAMTS14), asporin (ASPN), bone morphogenetic protein 6 (BMP6), BMP binding endothelial regulator (BMPER), chemokine (C-C motif) ligand 2 (CCL2), chemokine (C-C motif) ligand 8 (CCL8), collagen, type V, alpha 1 (COL5A1), collagen, type VI, alpha 3 (COL6A3), collagen, type VII, alpha 1 (COL7A1), collagen, type XVI, alpha 1 (COL16A1), frizzled-related protein (FRZB), growth differentiation factor 10 (GDF10), matrix metallopeptidase 3 (MMP3), osteoglycin (OGN), osteomodulin (OMD), periostin (POSTN), prostaglandin E synthase (PTGES), tumor necrosis factor (ligand) superfamily, member 11 (TNFSF11), and wingless-type MMTV integration site family, member 1 (WNT1).
Table 2.
Site-specific fold changes (FC) in gene expression in articular cartilage (AC) and site-matched subchondral bone (SB).
| FC in Overlying AC | FC in Underlying SB | Expression Relative to oLT | ||||||
|---|---|---|---|---|---|---|---|---|
| Genes | GenBank | iLTC | iMTC | iLTB | iMTB | cMTB | AC | SB |
| ADAMTS14 | NM_139155 | 3.72** | 6.21** | 3.17* | ||||
| ADAMTSL2 | NM_014694 | 11.1** | 2.35* | 3.27** | 2.83* | 2.46** | ||
| COL5A1 | NM_000093 | 5.90** | 2.91** | 2.44** | 6.39** | |||
| COL6A3 | NM_004369 | 2.76* | 2.11** | 5.61** | ||||
| COL7A1 | NM_000094 | 3.03* | 3.23** | 3.81** | ||||
| CILP2 | NM_153221 | 6.74** | 2.43* | 5.91* | 3.77** | |||
| COMP | NM_000095 | 4.68** | 4.96** | 4.07* | 5.81** | |||
| FN1 | NM_054034 | 2.85** | 4.24** | 2.09* | ||||
| ASPN | NM_017680 | 3.47** | 2.94** | 4.48** | 6.86** | |||
| WNT1 | NM_005430 | 13.9** | 2.30* | 3.69** | 5.49** | |||
| OGN | NM_033014 | 3.97** | 5.46** | 9.63** | 6.21** | |||
| GDF6 | NM_001001557 | 6.34* | 8.67* | 3.63* | ||||
| OMD | NM_005014 | 3.22* | 3.50** | 2.38** | 2.60** | |||
| POSTN | NM_006475 | 10.32* | 2.51** | 10.63** | ||||
| PTGES | NM_004878 | 4.11** | 6.02** | 1.69** | 2.64** | 2.57** | ||
| TNFSF11 | NM_003701 | 5.49* | 1.76** | 2.41** | 2.63** | |||
| BMP3 | NM_001201 | -2.52* | -2.23* | -2.11** | ||||
| BMP5 | NM_021073 | -4.84** | -2.63** | -3.71** | ||||
| BMPER | NM_133468 | -2.15** | -6.42** | -2.43** | ||||
| COL10A1 | NM_000493 | -1.93** | -1.92** | -1.67* | -2.17** | |||
| MATN4 | NM_003833 | -6.02** | -13.12** | -2.33** | -2.74* | |||
| MMP3 | NM_002422 | -2.66** | -5.91** | -2.34* | -2.15* | |||
| FRZB | NM_001463 | -1.55* | -8.13** | -3.25** | -7.76** | |||
| FZD4 | NM_012193 | -1.74* | -2.36** | -4.95** | ||||
| GDF10 | NM_004962 | -4.45** | -1.53* | -3.37** | ||||
| CCL2 | NM_002982 | -2.04* | -2.15* | -2.56** | -4.88** | |||
| CCL8 | NM_005623 | -1.83* | -2.77* | -3.75** | -6.54** | |||
| BMP7 | NM_001719 | 1.72* | 2.26* | - | ||||
| COL1A1 | NM_000088 | 3.82* | 11.03* | - | ||||
| COL1A2 | NM_000089 | 3.20** | 8.82* | - | ||||
| COL3A1 | NM_000090 | 2.39** | 7.07** | - | ||||
| COL5A2 | NM_000393 | 1.87** | 3.17** | - | ||||
| COL6A1 | NM_001848 | 2.28* | - | |||||
| ECM1 | NM 004425 | 2.93** | - | |||||
| DIO2 | NM_013989 | 2.86** | 6.11** | - | ||||
| SOST | NM_025237 | 4.76** | - | |||||
| DKK3 | NM_015881 | 1.92* | 2.40** | 3.19** | - | |||
| ADAMTS5 | NM_007038 | -2.06** | -2.97** | - | ||||
| LAMA3 | NM_198129 | -2.84** | - | |||||
| GDF5 | NM_000557 | -3.94** | - | |||||
| IL1B | NM_000576 | -2.27* | -3.55** | - | ||||
| TNF | NM_000594 | -1.84* | -3.48** | - | ||||
| JUN | NM_002228 | -2.32* | -4.17** | - | ||||
| FOSB | NM_006732 | -2.83* | -4.55** | - | ||||
| LEP | NM_000230 | -6.93** | -17.43** | - | ||||
| MMP11 | NM_005940 | 2.72** | - | |||||
| JUNB | NM_002229 | -1.83* | -2.94** | - | ||||
| ADAM12 | NM_003474 | 2.59* | 4.98** | - | ||||
| ADAMTS6 | NM_197941 | 3.43** | 5.13** | - | ||||
| COL15A1 | NM_001855 | 2.35* | 3.71** | - | ||||
| LOX | NM_002317 | 2.41* | 2.16* | - | ||||
| LOXL2 | NM_002318 | 3.69* | 4.75** | - | ||||
| LOXL3 | NM_032603 | 3.13** | 3.20** | - | ||||
| TGFBI | NM_000358 | 3.60* | 3.76** | - | ||||
| COL12A1 | NM_004370 | -2.36** | -3.57** | - | ||||
| COL9A1 | NM_001851 | -3.34** | - | |||||
| IL7 | NM_000880 | -4.31** | -2.45* | - | ||||
| COL16A1 | NM_001856 | -3.14** | 2.68* | |||||
| MMP2 | NM_004530 | -3.36** | -2.37* | 3.05* | ||||
| BMP6 | NM_001718 | 3.60* | ||||||
| FOS | NM_005252 | 2.03* | -2.63* | -6.18** | ||||
| Count † | 30 | 40 | 10 | 38 | 43 | |||
FC= fold-change
= P< 0.05,
= P< 0.01, = gene up-regulated compared with the oLT region, = gene down-regulated compared with oLT region
Count = total number of significantly (up or down) regulated genes
iLTC = inner lateral tibial cartilage, iMTC = inner medial tibial cartilage iLTB = inner lateral tibial bone, iMTC = inner medial tibial bone, cMTB= central medial tibial bone. Exact p values presented on supplementary Table 5.
Correlation with gene expression and severity of OA
Gene expression changes in AC and SB were correlated with OARSI scores of OA severity and the bone structure parameter, BV/TV (Supplementary Table 7). In one or both tissue elements, the expression of a total of 57 of 61 genes was correlated with OARSI scores of histological OA severity; 20 genes were significantly correlated both in AC and SB, 25 genes in SB only and 12 genes in AC only (Figure 5b). The expression of a total of 58 of 61 genes was correlated with BV/TV: 25 genes in both AC and SB, 20 genes in SB only, and 13 genes in AC only (Figure 5c). Of the 26 genes whose regulation was significantly altered in both AC and SB, the expression of the majority (19) was correlated with OA severity (OARSI score) and bone structure. (Figure 5d and Table 3).
Table 3.
Genes with significant correlation to OA severity (OARSI score) and/or bone structure (BV/TV) in overlying articular cartilage (AC) and underlying subchondral bone (SB).
| Gene | Site | OARSI score | BV/TV | ||
|---|---|---|---|---|---|
|
| |||||
| Pearson r | P value | Pearson r | P value | ||
| ADAMTS14 | AC | 0.7251 | < 0.0001 | 0.7855 | < 0.0001 |
| SB | 0.4338 | 0.0131 | 0.517 | 0.0024 | |
| ASPN | AC | 0.6562 | 0.0005 | 0.4704 | 0.0204 |
| SB | 0.7331 | < 0.0001 | 0.7633 | < 0.0001 | |
| BMP6 | AC | 0.4902 | 0.0176 | 0.5536 | 0.0061 |
| SB | -0.4327 | 0.0134 | -0.4773 | 0.0057 | |
| BMPER | AC | -0.6449 | 0.0009 | -0.8332 | < 0.0001 |
| SB | -0.6401 | < 0.0001 | -0.6559 | < 0.0001 | |
| CCL2 | AC | -0.4135 | 0.0446 | -0.5384 | 0.0097 |
| SB | -0.6466 | < 0.0001 | -0.7173 | < 0.0001 | |
| CCL8 | AC | -0.4471 | 0.037 | -0.4056 | 0.0493 |
| SB | -0.7005 | < 0.0001 | -0.7309 | < 0.0001 | |
| COL5A1 | AC | 0.4322 | 0.0349 | 0.4448 | 0.0294 |
| SB | 0.6571 | < 0.0001 | 0.7002 | < 0.0001 | |
| COL6A3 | AC | 0.606 | 0.0017 | 0.6099 | 0.0016 |
| SB | 0.6239 | 0.0001 | 0.6905 | < 0.0001 | |
| COL7A1 | AC | 0.5969 | 0.0021 | 0.6637 | 0.0004 |
| SB | 0.5947 | 0.0003 | 0.5926 | 0.0004 | |
| COL16A1 | AC | -0.5438 | 0.006 | -0.5438 | 0.006 |
| SB | 0.4772 | 0.0058 | 0.5439 | 0.0013 | |
| FRZB | AC | -0.6527 | 0.0005 | -0.788 | < 0.0001 |
| SB | -0.7958 | < 0.0001 | -0.8406 | < 0.0001 | |
| GDF10 | AC | -0.6439 | 0.0007 | -0.73 | < 0.0001 |
| SB | -0.7365 | < 0.0001 | -0.71 | < 0.0001 | |
| MMP3 | AC | -0.517 | 0.0115 | -0.7159 | 0.0001 |
| SB | -0.4027 | 0.0274 | -0.4364 | 0.0159 | |
| OGN | AC | 0.6954 | 0.0002 | 0.7016 | 0.0001 |
| SB | 0.5289 | 0.0019 | 0.5088 | 0.0029 | |
| OMD | AC | 0.538 | 0.0067 | 0.5801 | 0.003 |
| SB | 0.5209 | 0.0022 | 0.5112 | 0.0028 | |
| POSTN | AC | 0.4252 | 0.0383 | 0.5377 | 0.0067 |
| SB | 0.6753 | < 0.0001 | 0.7582 | < 0.0001 | |
| PTGES | AC | 0.7715 | < 0.0001 | 0.826 | < 0.0001 |
| SB | 0.6332 | 0.0001 | 0.6513 | < 0.0001 | |
| TNFSF11 | AC | 0.4326 | 0.0347 | 0.59 | 0.0024 |
| SB | 0.7519 | < 0.0001 | 0.6635 | < 0.0001 | |
| WNT1 | AC | 0.4143 | 0.0441 | 0.4333 | 0.0344 |
| SB | 0.5658 | 0.0007 | 0.6516 | < 0.0001 | |
Discussion
Molecular crosstalk of the cartilage-subchondral bone unit is a key component in the pathogenesis of OA [38]. To the best of our knowledge, this is the first study to successfully extract high quality RNA from site-matched AC and SB. The techniques described in this study represent a significant advance over previous methods. Most previous studies focused on the non-calcified components of the joint: freshly isolated cartilage, enzymatically isolated chondrocytes with and without in vitro culture, or synovium. Hard tissues, such as bone, become brittle when frozen; this makes them more difficult to handle, laborious and time consuming to process, and results in inconsistent RNA quality. Thus, the majority of previous OA-related gene expression studies have focused on AC and very little data exist regarding OA-related gene changes in SB. As a result of achieving high quality RNA extraction from both AC and SB, it was feasible to analyze the gene expression of chondrocytes from the AC and of all the cellular elements from the SB (unlike cartilage, that has only a single cell type, the SB has a very heterogeneous complement of cells, including osteoblasts, osteoclasts, osteocytes, and bone marrow cells). Although the specific cell types contributing to the changes in gene expression cannot easily be confirmed, all the cell types in the SB would be expected to contribute to the SB gene expression profile [39].
In addition, this method offers several advantages: RNA can be isolated from tissues that are frozen immediately thereby avoiding alterations in cell differentiation state and gene expression associated with other methods; specific regions of interest can be dissected with the bone saw; histological examination can be performed on adjacent regions to evaluate the site-matched tissue morphology; and the remaining specimens of bone and cartilage can be ground at later times without compromising RNA quality because the tissue is never thawed. This method is also applicable to cartilage that is thinned because the depth of drill penetration can be precisely controlled to target specific layers of the tissue. Finally, it allows separation of the site-matched tissues. It is likely that cross contamination of tissues can occur, however, this can be reduced with experience. In fact, tissue elements could be clearly distinguished in liquid nitrogen consisting of white overlying AC and light pink/yellow underlying SB, allowing an experienced operator to easily divide the two tissue elements. We further analyzed the expression of 8 tissue associated genes; although no single gene may be considered absolutely tissue specific, taken together, the results of all 8 tissue associated genes strongly supported the lack of cross-contamination between the tissues.
The main limitations of our study were the lack of non-OA site matched tissues for comparison, and the limited number of separate subjects (8 subjects, 56 samples) that contributed to the gene expression analyses. However, this system overcomes a major hurdle in the field—namely, the problem of significant background variation in gene expression studies; normalization to a standardized histologically normal region (oLT) in each tissue controlled for inter-individual variation and thereby enabled us to focus on disease-related variation. Moreover, even though this represents a small sample size, most of the OA-related genes had sufficient statistical power in our gene expression analysis; we attribute this to the normalization strategy and to the use of microfluidic cards that had high accuracy and ability to detect the gene expression for many genes from multiple regions of one sample simultaneously.
Of the 61 genes analyzed, approximately half were significantly changed at least two-fold compared with the relatively normal oLT region in both SB and AC. These genes were coordinately up- (52%) or down- (36%) regulated simultaneously, and very few genes were regulated in opposite directions. Moreover, the level of expression of the majority of these genes (in the iLT, iMT and cMT regions of both tissue elements) displayed strong correlation to severity states of the disease. However, we could not differentiate the response to load from correlation with severity state as these are inextricably linked; it is known for instance, that in normal and disease knees that there are consistently strong contact pressures in the iLT and cMT regions and relatively low contact pressures in the oLT region [20].
We believe that the pathways identified by the coordinately regulated genes provide insights into disease pathogenesis and are of interest for three main reasons: they may reveal generalizable tissue responses in OA; they may provide insight into the signals mediating the communication between AC and SB; and they may identify targets whose modification could produce beneficial effects in both AC and SB. For instance, GDF10 (also called BMP-3b), a member of the bone morphogenetic protein (BMP) family and the TGF-beta superfamily, has been reported to be an important regulator of key events in the processes of articular chondrocyte differentiation and bone formation [40, 41]. However, no prior study linked GDF10 with OA. Our data clearly showed that GDF10 was down-regulated in both AC and SB in association with OA severity and bone structural changes. Taken together, these data serve to identify a potential new and promising molecular contributor to the pathogenesis of OA and a potential new target for OA therapy.
Given the gradient of OA severity across the tibial plateau, this model system also has the potential to provide insights into OA pathogenesis and progression. Support for this supposition was provided by changes in the WNT signaling gene pathway known to be associated with OA progression [42]; for instance, in our model system, a gradual up-regulation of WNT1 and down-regulation of FRZB, a WNT1 modulator [43], was evident comparing regions of intermediate severity of disease (iLT region) to regions with more severe disease (iMT and cMT regions).
In addition, our study identified 19 genes whose expression in both AC and SB correlated with OA severity and bone structural abnormalities. These 19 genes clustered into four main functional categories: genes known to regulate chondrocyte maturation and long bone development - BMP6, BMPER, GDF10, FRZB, OMD, TNFSF11, and WNT1 [44, 45]; genes involved in inflammatory responses - CCL2, CCL8, and PTGES; genes contributing to the collagenous framework of the ECM - ASPN, COL5A1, COL6A3, COL7A1, COL16A1, OGN, and POSTN; and genes of the metalloproteinase family that process ECM proteins - ADAMTS14 and MMP3. Zhang et. al. [46] recently reported a whole genome microarray analysis of SB in an early experimental OA mouse model; their reported fold changes in SB gene expression of ASPN, CCL2, COL5A1, POSTN and TNFSF11 at the initial stages of OA were similar to those of our study. Moreover, comparing gene expression by microarray analysis of human OA lesional cartilage versus intact cartilage from donors lacking macroscopic and microscopic signs of OA, these same five genes were identified as differentially regulated [36]. These results strongly support the credibility of our methods and model system for identifying genes in AC and SB that play a role in the pathogenesis of OA. Given evidence by Catterall et al. [47] suggesting that the metabolic activity of lesional cartilage differs considerably between the hip and knee, we believe this model system could provide insights into future studies of joint site specific gene regulation in the pathogenesis of OA.
In conclusion, our custom workstation made it possible to establish a model system for evaluating alterations in gene expression with OA severity representative of different stages of OA within and between knee OA subjects. This method is not limited to expression studies; miRNA and proteins can also be extracted from the isolated sections of AC and SB to allow a systematic approach to the study of OA. We believe this will provide insights into the early pathogenic mechanisms of OA and further contribute to the development of new therapeutic strategies.
Supplementary Material
Gene list and TaqMan probes for the 61 genes analyzed.
Results of normal distribution testing of all the measures.
Parameters of cartilage and bone related to lack of gender differences.
Correlation between OARSI score and the bone parameters.
Quality and yields of RNA from the articular cartilage (AC) and subchondral bone (SB) of human tibial plateaus.
Exact p values from analyses of gene expression.
Correlation of gene expression with cartilage integrity and bone volume.
Depiction of the original 23 Appleyard regions of interest.
Determination of expression levels for cartilage and bone related genes.
RNA extraction protocol
Acknowledgments
Funding source
This study was supported by the Academia Sinica Genomic Medicine Multicenter Study (40-05-GMM), the National Research Program for Genomic Medicine, National Science Council, Taiwan (Translational Resource Center for Genomic Medicine: NSC101-2325-B-001-035, National Center for Genome Medicine: NSC101-2319-B-001-001 and MTML: NSC101-2320-B-001-020-MY3), NIH/NIA Claude D. Pepper OAIC 5P30 AG028716 and P01 AR50245 (VBK), and an OARSI scholarship (to C-H Chou).
Footnotes
Authors’ contributions
All authors were involved in drafting the article or revising it critically for important intellectual content, and all authors approved the final version to be published. CC Wu and MTM Lee had full access to all of the data in the study and take responsibility for the integrity of the data and the accuracy of the data analysis.
Study conception and design. CH Chou, JY Wu, YT Chen, VB Kraus, CC Wu, MTM Lee
Acquisition of data. CH Chou, CH Lee, LS Lu, IW Song, HP Chuang, SY Kuo, CC Wu
Analysis and interpretation of data. CH Chou, VB Kraus, CC Wu, MTM Lee
Manuscript preparation. CH Chou, VB Kraus, CC Wu, MTM Lee
Competing interests
The authors declare that they have no competing interests.
Publisher's Disclaimer: This is a PDF file of an unedited manuscript that has been accepted for publication. As a service to our customers we are providing this early version of the manuscript. The manuscript will undergo copyediting, typesetting, and review of the resulting proof before it is published in its final citable form. Please note that during the production process errors may be discovered which could affect the content, and all legal disclaimers that apply to the journal pertain.
References
- 1.Grynpas MD, Alpert B, Katz I, Lieberman I, Pritzker KP. Subchondral bone in osteoarthritis. Calcif Tissue Int. 1991;49:20–26. doi: 10.1007/BF02555898. [DOI] [PubMed] [Google Scholar]
- 2.Goldring MB, Goldring SR. Articular cartilage and subchondral bone in the pathogenesis of osteoarthritis. Ann N Y Acad Sci. 2010;1192:230–237. doi: 10.1111/j.1749-6632.2009.05240.x. [DOI] [PubMed] [Google Scholar]
- 3.Herrero-Beaumont G, Roman-Blas JA, Largo R, Berenbaum F, Castaneda S. Bone mineral density and joint cartilage: four clinical settings of a complex relationship in osteoarthritis. Ann Rheum Dis. 2011;70:1523–1525. doi: 10.1136/ard.2011.151233. [DOI] [PubMed] [Google Scholar]
- 4.Ding C, Cicuttini F, Jones G. Tibial subchondral bone size and knee cartilage defects: relevance to knee osteoarthritis. Osteoarthritis Cartilage. 2007;15:479–486. doi: 10.1016/j.joca.2007.01.003. [DOI] [PubMed] [Google Scholar]
- 5.Kraus VB, Feng S, Wang S, White S, Ainslie M, Brett A, et al. Trabecular morphometry by fractal signature analysis is a novel marker of osteoarthritis progression. Arthritis Rheum. 2009;60:3711–3722. doi: 10.1002/art.25012. [DOI] [PMC free article] [PubMed] [Google Scholar]
- 6.Muraoka T, Hagino H, Okano T, Enokida M, Teshima R. Role of subchondral bone in osteoarthritis development: a comparative study of two strains of guinea pigs with and without spontaneously occurring osteoarthritis. Arthritis Rheum. 2007;56:3366–3374. doi: 10.1002/art.22921. [DOI] [PubMed] [Google Scholar]
- 7.Cox LG, van Rietbergen B, van Donkelaar CC, Ito K. Bone structural changes in osteoarthritis as a result of mechanoregulated bone adaptation: a modeling approach. Osteoarthritis Cartilage. 2011;19:676–682. doi: 10.1016/j.joca.2011.02.007. [DOI] [PubMed] [Google Scholar]
- 8.Weinans H, Siebelt M, Agricola R, Botter SM, Piscaer TM, Waarsing JH. Pathophysiology of peri-articular bone changes in osteoarthritis. Bone. 2012;51:190–196. doi: 10.1016/j.bone.2012.02.002. [DOI] [PubMed] [Google Scholar]
- 9.Burr DB. Anatomy and physiology of the mineralized tissues: role in the pathogenesis of osteoarthrosis. Osteoarthritis Cartilage. 2004;12(Suppl A):S20–30. doi: 10.1016/j.joca.2003.09.016. [DOI] [PubMed] [Google Scholar]
- 10.Westacott CI, Webb GR, Warnock MG, Sims JV, Elson CJ. Alteration of cartilage metabolism by cells from osteoarthritic bone. Arthritis Rheum. 1997;40:1282–1291. doi: 10.1002/1529-0131(199707)40:7<1282::AID-ART13>3.0.CO;2-E. [DOI] [PubMed] [Google Scholar]
- 11.Sanchez C, Deberg MA, Piccardi N, Msika P, Reginster JY, Henrotin YE. Osteoblasts from the sclerotic subchondral bone downregulate aggrecan but upregulate metalloproteinases expression by chondrocytes. This effect is mimicked by interleukin-6, -1beta and oncostatin M pre-treated non-sclerotic osteoblasts. Osteoarthritis Cartilage. 2005;13:979–987. doi: 10.1016/j.joca.2005.03.008. [DOI] [PubMed] [Google Scholar]
- 12.Moreau M, Rialland P, Pelletier JP, Martel-Pelletier J, Lajeunesse D, Boileau C, et al. Tiludronate treatment improves structural changes and symptoms of osteoarthritis in the canine anterior cruciate ligament model. Arthritis Res Ther. 2011;13:R98. doi: 10.1186/ar3373. [DOI] [PMC free article] [PubMed] [Google Scholar]
- 13.Walsh DA, Chapman V. Bisphosphonates for osteoarthritis. Arthritis Res Ther. 2011;13:128. doi: 10.1186/ar3448. [DOI] [PMC free article] [PubMed] [Google Scholar]
- 14.Castaneda S, Roman-Blas JA, Largo R, Herrero-Beaumont G. Subchondral bone as a key target for osteoarthritis treatment. Biochem Pharmacol. 2012;83:315–323. doi: 10.1016/j.bcp.2011.09.018. [DOI] [PubMed] [Google Scholar]
- 15.Arabelovic S, McAlindon TE. Considerations in the treatment of early osteoarthritis. Curr Rheumatol Rep. 2005;7:29–35. doi: 10.1007/s11926-005-0006-y. [DOI] [PubMed] [Google Scholar]
- 16.Appleyard RC, Burkhardt D, Ghosh P, Read R, Cake M, Swain MV, et al. Topographical analysis of the structural, biochemical and dynamic biomechanical properties of cartilage in an ovine model of osteoarthritis. Osteoarthritis Cartilage. 2003;11:65–77. doi: 10.1053/joca.2002.0867. [DOI] [PubMed] [Google Scholar]
- 17.Pritzker KP, Gay S, Jimenez SA, Ostergaard K, Pelletier JP, Revell PA, et al. Osteoarthritis cartilage histopathology: grading and staging. Osteoarthritis Cartilage. 2006;14:13–29. doi: 10.1016/j.joca.2005.07.014. [DOI] [PubMed] [Google Scholar]
- 18.Ding M, Odgaard A, Danielsen CC, Hvid I. Mutual associations among microstructural, physical and mechanical properties of human cancellous bone. J Bone Joint Surg Br. 2002;84:900–907. doi: 10.1302/0301-620x.84b6.11994. [DOI] [PubMed] [Google Scholar]
- 19.Ding M, Odgaard A, Hvid I. Changes in the three-dimensional microstructure of human tibial cancellous bone in early osteoarthritis. J Bone Joint Surg Br. 2003;85:906–912. [PubMed] [Google Scholar]
- 20.Bae JY, Park KS, Seon JK, Kwak DS, Jeon I, Song EK. Biomechanical analysis of the effects of medial meniscectomy on degenerative osteoarthritis. Med Biol Eng Comput. 2012;50:53–60. doi: 10.1007/s11517-011-0840-1. [DOI] [PubMed] [Google Scholar]
- 21.Steck E, Braun J, Pelttari K, Kadel S, Kalbacher H, Richter W. Chondrocyte secreted CRTAC1: a glycosylated extracellular matrix molecule of human articular cartilage. Matrix Biol. 2007;26:30–41. doi: 10.1016/j.matbio.2006.09.006. [DOI] [PubMed] [Google Scholar]
- 22.Steck E, Benz K, Lorenz H, Loew M, Gress T, Richter W. Chondrocyte expressed protein-68 (CEP-68), a novel human marker gene for cultured chondrocytes. Biochem J. 2001;353:169–174. doi: 10.1042/0264-6021:3530169. [DOI] [PMC free article] [PubMed] [Google Scholar]
- 23.Parsons P, Gilbert SJ, Vaughan-Thomas A, Sorrell DA, Notman R, Bishop M, et al. Type IX collagen interacts with fibronectin providing an important molecular bridge in articular cartilage. J Biol Chem. 2011;286:34986–34997. doi: 10.1074/jbc.M111.238188. [DOI] [PMC free article] [PubMed] [Google Scholar]
- 24.Couchourel D, Aubry I, Delalandre A, Lavigne M, Martel-Pelletier J, Pelletier JP, et al. Altered mineralization of human osteoarthritic osteoblasts is attributable to abnormal type I collagen production. Arthritis Rheum. 2009;60:1438–1450. doi: 10.1002/art.24489. [DOI] [PMC free article] [PubMed] [Google Scholar]
- 25.Rodriguez-Lopez J, Mustafa Z, Pombo-Suarez M, Malizos KN, Rego I, Blanco FJ, et al. Genetic variation including nonsynonymous polymorphisms of a major aggrecanase, ADAMTS-5, in susceptibility to osteoarthritis. Arthritis Rheum. 2008;58:435–441. doi: 10.1002/art.23201. [DOI] [PubMed] [Google Scholar]
- 26.Rodriguez-Lopez J, Pombo-Suarez M, Loughlin J, Tsezou A, Blanco FJ, Meulenbelt I, et al. Association of a nsSNP in ADAMTS14 to some osteoarthritis phenotypes. Osteoarthritis Cartilage. 2009;17:321–327. doi: 10.1016/j.joca.2008.07.012. [DOI] [PubMed] [Google Scholar]
- 27.Nakamura T, Shi D, Tzetis M, Rodriguez-Lopez J, Miyamoto Y, Tsezou A, et al. Meta-analysis of association between the ASPN D-repeat and osteoarthritis. Hum Mol Genet. 2007;16:1676–1681. doi: 10.1093/hmg/ddm115. [DOI] [PubMed] [Google Scholar]
- 28.Snelgrove TA, Peddle LJ, Stone C, Nofball F, Peddle D, Squire D, et al. Association of COL1A2, COL2A1 and COL9A1 and primary osteoarthritis in a founder population. Clin Genet. 2005;67:359–360. doi: 10.1111/j.1399-0004.2005.00399.x. [DOI] [PubMed] [Google Scholar]
- 29.Meulenbelt I, Min JL, Bos S, Riyazi N, Houwing-Duistermaat JJ, van der Wijk HJ, et al. Identification of DIO2 as a new susceptibility locus for symptomatic osteoarthritis. Hum Mol Genet. 2008;17:1867–1875. doi: 10.1093/hmg/ddn082. [DOI] [PubMed] [Google Scholar]
- 30.Valdes AM, Evangelou E, Kerkhof HJ, Tamm A, Doherty SA, Kisand K, et al. The GDF5 rs143383 polymorphism is associated with osteoarthritis of the knee with genome-wide statistical significance. Ann Rheum Dis. 2011;70:873–875. doi: 10.1136/ard.2010.134155. [DOI] [PMC free article] [PubMed] [Google Scholar]
- 31.Loughlin J, Dowling B, Chapman K, Marcelline L, Mustafa Z, Southam L, et al. Functional variants within the secreted frizzled-related protein 3 gene are associated with hip osteoarthritis in females. Proc Natl Acad Sci U S A. 2004;101:9757–9762. doi: 10.1073/pnas.0403456101. [DOI] [PMC free article] [PubMed] [Google Scholar]
- 32.Qin J, Shi D, Dai J, Zhu L, Tsezou A, Jiang Q. Association of the leptin gene with knee osteoarthritis susceptibility in a Han Chinese population: a case-control study. J Hum Genet. 2010;55:704–706. doi: 10.1038/jhg.2010.86. [DOI] [PubMed] [Google Scholar]
- 33.Aigner T, Fundel K, Saas J, Gebhard PM, Haag J, Weiss T, et al. Large-scale gene expression profiling reveals major pathogenetic pathways of cartilage degeneration in osteoarthritis. Arthritis Rheum. 2006;54:3533–3544. doi: 10.1002/art.22174. [DOI] [PubMed] [Google Scholar]
- 34.Appleton CT, Pitelka V, Henry J, Beier F. Global analyses of gene expression in early experimental osteoarthritis. Arthritis Rheum. 2007;56:1854–1868. doi: 10.1002/art.22711. [DOI] [PubMed] [Google Scholar]
- 35.Fukui N, Miyamoto Y, Nakajima M, Ikeda Y, Hikita A, Furukawa H, et al. Zonal gene expression of chondrocytes in osteoarthritic cartilage. Arthritis Rheum. 2008;58:3843–3853. doi: 10.1002/art.24036. [DOI] [PubMed] [Google Scholar]
- 36.Karlsson C, Dehne T, Lindahl A, Brittberg M, Pruss A, Sittinger M, et al. Genome-wide expression profiling reveals new candidate genes associated with osteoarthritis. Osteoarthritis Cartilage. 2010;18:581–592. doi: 10.1016/j.joca.2009.12.002. [DOI] [PubMed] [Google Scholar]
- 37.Meng J, Ma X, Ma D, Xu C. Microarray analysis of differential gene expression in temporomandibular joint condylar cartilage after experimentally induced osteoarthritis. Osteoarthritis Cartilage. 2005;13:1115–1125. doi: 10.1016/j.joca.2005.03.010. [DOI] [PubMed] [Google Scholar]
- 38.Lories RJ, Luyten FP. The bone-cartilage unit in osteoarthritis. Nat Rev Rheumatol. 2011;7:43–49. doi: 10.1038/nrrheum.2010.197. [DOI] [PubMed] [Google Scholar]
- 39.Kumarasinghe DD, Perilli E, Tsangari H, Truong L, Kuliwaba JS, Hopwood B, et al. Critical molecular regulators, histomorphometric indices and their correlations in the trabecular bone in primary hip osteoarthritis. Osteoarthritis Cartilage. 2010;18:1337–1344. doi: 10.1016/j.joca.2010.07.005. [DOI] [PubMed] [Google Scholar]
- 40.Kaihara S, Bessho K, Okubo Y, Sonobe J, Komatsu Y, Miura M, et al. Over expression of bone morphogenetic protein-3b (BMP-3b) using an adenoviral vector promote the osteoblastic differentiation in C2C12 cells and augment the bone formation induced by bone morphogenetic protein-2 (BMP-2) in rats. Life Sci. 2003;72:1683–1693. doi: 10.1016/s0024-3205(02)02477-3. [DOI] [PubMed] [Google Scholar]
- 41.Lafont JE, Talma S, Hopfgarten C, Murphy CL. Hypoxia promotes the differentiated human articular chondrocyte phenotype through SOX9-dependent and -independent pathways. J Biol Chem. 2008;283:4778–4786. doi: 10.1074/jbc.M707729200. [DOI] [PubMed] [Google Scholar]
- 42.Lane NE, Nevitt MC, Lui LY, de Leon P, Corr M. Wnt signaling antagonists are potential prognostic biomarkers for the progression of radiographic hip osteoarthritis in elderly Caucasian women. Arthritis Rheum. 2007;56:3319–3325. doi: 10.1002/art.22867. [DOI] [PubMed] [Google Scholar]
- 43.He J, Sheng T, Stelter AA, Li C, Zhang X, Sinha M, et al. Suppressing Wnt signaling by the hedgehog pathway through sFRP-1. J Biol Chem. 2006;281:35598–35602. doi: 10.1074/jbc.C600200200. [DOI] [PubMed] [Google Scholar]
- 44.Zhu F, Friedman MS, Luo W, Woolf P, Hankenson KD. The transcription factor osterix (SP7) regulates BMP6-induced human osteoblast differentiation. J Cell Physiol. 2012;227:2677–2685. doi: 10.1002/jcp.23010. [DOI] [PMC free article] [PubMed] [Google Scholar]
- 45.Chen D, Zhao M, Mundy GR. Bone morphogenetic proteins. Growth Factors. 2004;22:233–241. doi: 10.1080/08977190412331279890. [DOI] [PubMed] [Google Scholar]
- 46.Zhang R, Fang H, Chen Y, Shen J, Lu H, Zeng C, et al. Gene expression analyses of subchondral bone in early experimental osteoarthritis by microarray. PLoS One. 2012;7:e32356. doi: 10.1371/journal.pone.0032356. [DOI] [PMC free article] [PubMed] [Google Scholar]
- 47.Catterall JB, Hsueh MF, Stabler TV, McCudden CR, Bolognesi M, Zura R, et al. Protein modification by deamidation indicates variations in joint extracellular matrix turnover. J Biol Chem. 2012;287:4640–4651. doi: 10.1074/jbc.M111.249649. [DOI] [PMC free article] [PubMed] [Google Scholar]
Associated Data
This section collects any data citations, data availability statements, or supplementary materials included in this article.
Supplementary Materials
Gene list and TaqMan probes for the 61 genes analyzed.
Results of normal distribution testing of all the measures.
Parameters of cartilage and bone related to lack of gender differences.
Correlation between OARSI score and the bone parameters.
Quality and yields of RNA from the articular cartilage (AC) and subchondral bone (SB) of human tibial plateaus.
Exact p values from analyses of gene expression.
Correlation of gene expression with cartilage integrity and bone volume.
Depiction of the original 23 Appleyard regions of interest.
Determination of expression levels for cartilage and bone related genes.
RNA extraction protocol