Abstract
Genetically encoded fluorescent indicators for bioimaging are powerful tools for visualizing biological phenomena in specified cell types or cellular compartments. However, available gene promoters or localization sequences are not applicable for visualizing all expression events. Furthermore, a visualization technique focusing on single cells or cellular compartments is required for characterizing specific cellular properties including individuality of cells in the cell population. To address these limitations, we developed a genetically encoded caged Ca2+ indicator for which expression timing and location could be controlled. This indicator, PA-TNXL, comprises a Ca2+-binding protein and troponin between a photoactivatable FRET donor (PA-GFP) and a FRET quencher (dim variant of YFP). Ultraviolet irradiation activates the FRET Ca2+ indicator. Using this indicator, we successfully imaged Ca2+ dynamics in a given set of HeLa cells and cultured hippocampal neurons. This technology can be applied for developing other photoactivatable indicators, thereby opening a new area of biological research.
The calcium ion (Ca2+) is a universal second messenger involved in cellular signal transduction and plays crucial role in a number of physiological processes such as neural transmission and cardiac contraction1. To investigate how concentration changes of Ca2+ are associated with physiological events in living cells, various indicators have been developed. Ca2+ imaging initially involved the luminescent protein aequorin followed by a variety of chemically synthesized fluorescent dyes such as fura-22,3. Moreover, progress in fluorescent protein (FP) technology has led to the development of genetically encoded Ca2+ indicators that can be expressed in specific cellular compartments such as the mitochondrial matrix and endoplasmic reticulum lumen through fusion with localization sequences or in various cell types using specific gene promoters4. There are 2 types of genetically encoded Ca2+ indicators4. The Förster resonance energy transfer (FRET)-based indicators include cameleon5 and TN-XL6, the fluorescence signals of which ratiometrically change with Ca2+ level. The second indicator is based on a circularly permuted FP such as G-CaMP7, pericam8, or GECO9, in which Ca2+-dependent interactions between calmodulin and M13 induce changes in chromophore ionization status, resulting in intensiometric changes in emission signals. Methods for improving detectable Ca2+ level, dynamic range, and colour variation are continually being investigated9,10. A primary goal of Ca2+ imaging using such indicators is the elucidation of Ca2+ dynamics in specific cells in tissues or entire organisms to reveal the relationship between Ca2+ dynamics on a single-cell level and physiological phenomena on a macro-scale. For these purposes, distinct visualization of Ca2+ dynamics by expressing cell-specific Ca2+ indicators in tissues or whole organisms is indispensable. Moreover, to investigate relationships between cells, a technique for visualizing a small number of cells is required. Although several promoters for cell/tissue-specific gene expression are available for targeted gene expression, such promoters are not available for all cell/tissue/organ types, and the most recently developed methods cannot express Ca2+ indicators in arbitrary cells at specific time points. Therefore, expression must be carefully controlled.
To overcome these limitations, we developed a ‘caged’ Ca2+ indicator that becomes fluorescent upon light stimulation during microscopic observation, allowing light illumination at specific locations and time points. Therefore, if a caged Ca2+ indicator is ubiquitously expressed in entire tissues or whole organisms, the emergence of a fluorescent Ca2+ indicator can be controlled using light in any cell.
Results
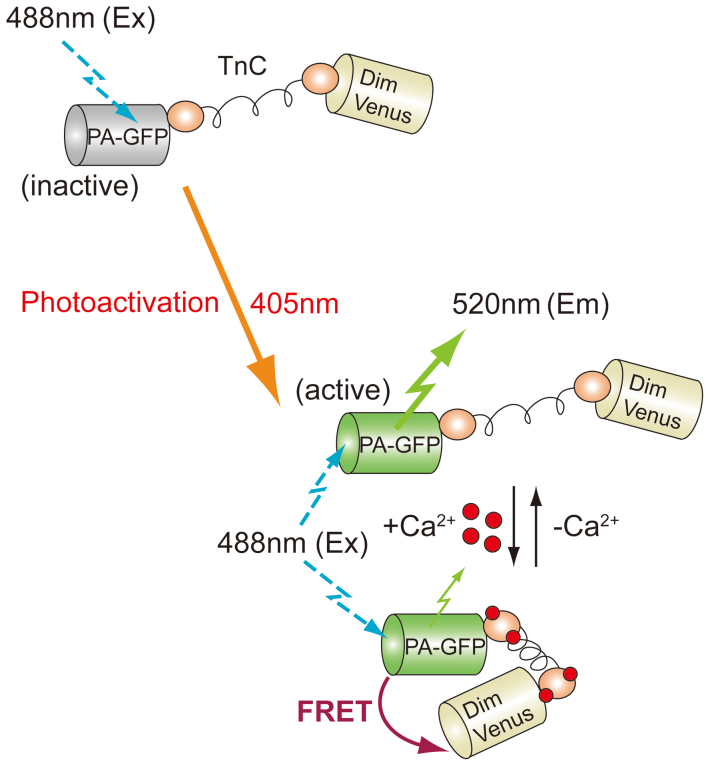
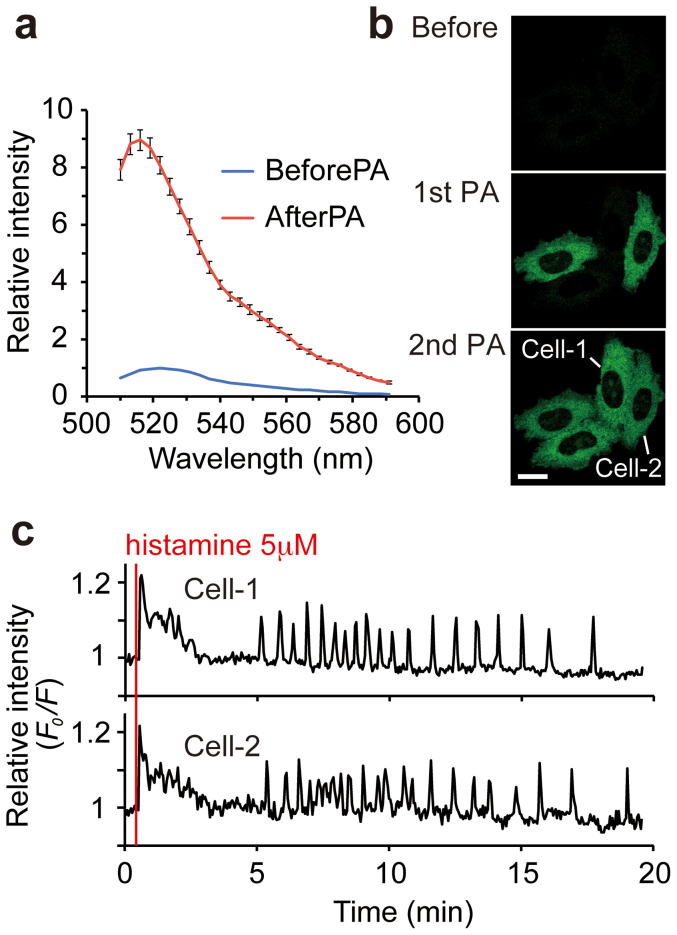
We first designed a photoactivatable indicator by replacing the CFP and YFP moieties of a FRET-based Ca2+ indicator, TN-XL, with a photoactivatable green fluorescent protein (PA-GFP)11 and a red fluorescent protein, respectively. We attempted several red FPs whose absorption spectra showed moderate overlapping with the emission spectrum of activated PA-GFP. However, unfortunately, all constructs showed only a subtle response to Ca2+. Moreover, the absorption spectra for all red FPs extended into shorter wavelengths; thus, constructs containing a red FP showed weak fluorescence at red wavelengths even before photoactivation (see Supplementary Fig. 1 online)12. On the basis of these results, we next attempted a non-fluorescent chromo protein, asFP59513, which absorbs green to yellow light but does not emit red fluorescence. However, this construct aggregated when expressed in living cells, which may be due to the aggregation properties of asFP595. To obtain a suitable acceptor protein, we then focused on the YFP variant Venus, because it does not aggregate and shows higher spectral overlapping of its absorption with the activated PA-GFP emission spectrum. To construct a dim variant of Venus14, we introduced a Y145W mutation15 into Venus and referred to this mutant as DimVenus. We also attempted to create a Venus variant containing Y145W/H148V, which is known as DarkVenus16. Relative intensities to native Venus, calculated by taking the product of extinction coefficients and fluorescence quantum yields, were 3% and 7% for DimVenus and DarkVenus, respectively (see Supplementary Table 1 online). Their absorbance spectra showed high overlapping with the emission spectrum of activated PA-GFP (see Supplementary Fig. 2 online). We replaced the asFP595 moiety in the above indicator with DimVenus or DarkVenus, as well as their circularly permuted versions, cp173DimVenus or cp173DarkVenus, both of which were created through introducing split site before 173th residue, interchanging the N and C portions and reconnecting by a short spacer between the original termini. To compare the indicator properties of these constructs, various arrangements of the fluorescent tags were constructed. One contained PA-GFP at the N-terminus and the dim variant of Venus at C-terminus, with another construct in the reverse position (Fig. 1; see also Supplementary Fig. 3 online). These indicators were expected to decrease the intensity of green fluorescence upon Ca2+ binding (Fig. 1) since the FRET efficiency of the parental TN-XL increases upon Ca2+ binding. Among indicators prepared, the construct with PA-GFP at the N-terminus and cp173DimVenus at the C-terminus (PA-GFP-troponin-cp173DimVenus) showed the highest increase (approximately 9-fold) in fluorescence intensity upon irradiation at 405 nm compared to the other constructs (less than 4-fold increase) (Fig. 2a–b; see also Supplementary Fig. 3 online). This construct was referred to as ‘PA-TNXL’.
Figure 1. Schematic representation of the photoactivation and Ca2+-sensing mechanism of PA-TNXL.
TnC, Ca2+-binding moiety of TN-XL derived from fast chicken skeletal muscle troponin C. PA-GFP, PA-GFP with C-terminal 11 amino acids deleted. DimVenus, circularly permuted cp173DimVenus. Before photoactivation, the chromophore of PA-GFP is inactive. After photoactivation of PA-GFP using a 405-nm light, the chromophore of PA-GFP becomes active, and bright green fluorescence appears. At high Ca2+ concentrations, increases in FRET efficiency from activated PA-GFP to DimVenus were induced through structural changes to the TnC moiety, resulting in decreased fluorescence intensity of the FRET donor PA-GFP.
Figure 2. Ca2+ imaging in HeLa cells using PA-TNXL.
(a) Fluorescence spectrum of PA-TNXL in HeLa cells before and after photoactivation (PA). Error bars, s.d. (n = 8). (b) Confocal images showing photoactivation of PA-TNXL in HeLa cells. Two different cells expressing PA-TNXL were photoactivated using 405-nm light stimulation at 1st PA and 2nd PA. Scale bar: 20 μm. (c) Relative fluorescence intensity ratio F0/F of the 2 cells depicted in (b). F0 is the averaged intensity of the initial 10 frames. Responses to stimulation with 5 μM histamine are shown.
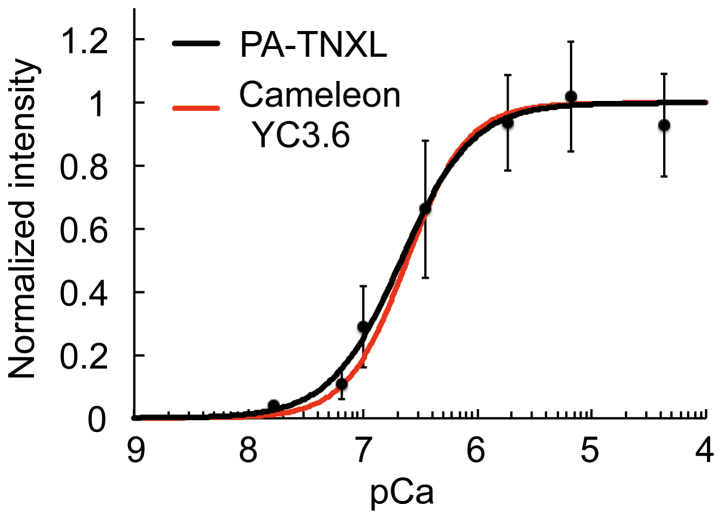
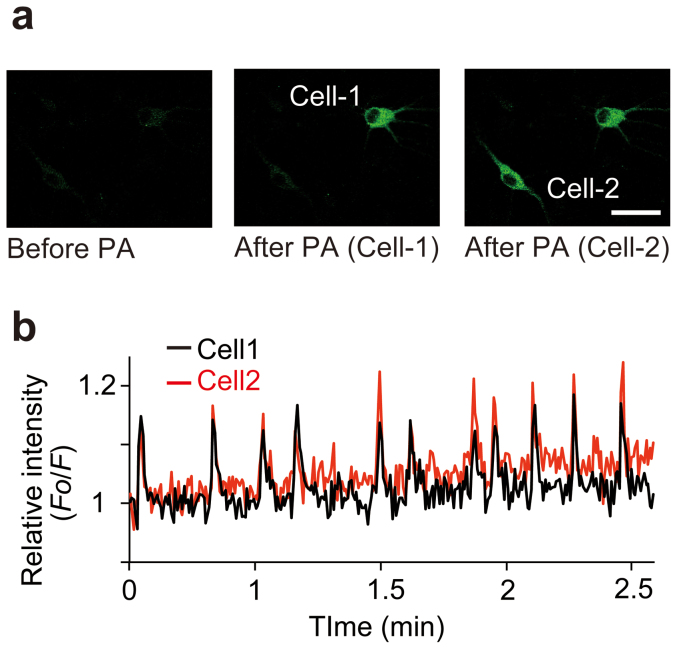
Ca2+ titration using photoactivated purified PA-TNXL revealed that the Kd for Ca2+ was 215 nM with a Hill constant of 1.4 and a dynamic range of 18%. This indicates that PA-TNXL can be used to measure changes in Ca2+ concentration in general biological phenomena such as ligand-induced Ca2+ increases, which range from 50 nM to approximately 1 μM5,9,10 (Fig. 3). As expected, when expressed in HeLa cells, fluorescence could be activated in specific cells upon irradiation at 405 nm; we observed a histamine-evoked large decrease in fluorescence intensity. This equates to a large increase in Ca2+, followed by persistent Ca2+ oscillation; this has been observed earlier for conventional Ca2+ indicators (Fig. 2c; see also Supporting movie 1)5,9,10. Furthermore, upon highlighting several hippocampal neurons in dissociation culture at DIV-10, we observed that Ca2+ oscillation occurs due to spontaneous neuron firing (Fig. 4).
Figure 3. Ca2+ titration curves for the indicators.
The normalized fluorescence intensity change is represented as a function of pCa (−log[Ca2+]). Error bars, s.d. (n = 7). Resulting Kd of PA-TNXL was 215 nM with a Hill constant of 1.4. Titration curve for Cameleon YC3.6 (Kd for Ca2+ was 250 nM with a Hill constant of 1.7) is also shown.
Figure 4. Performance of PA-TNXL in primary hippocampal neurons.
(a) Rat primary hippocampal neuron expressing PA-TNXL. Images show before PA (left), after PA of Cell-1 (middle), and following PA of Cell-2 (right). Scale bar: 50 μm. (b) Time trace of relative fluorescence intensity ratio (F0/F) for the 2 cells after photoactivation.
Discussion
In this study, we used a 405-nm laser to photoactivate PA-TNXL and performed fluorescence imaging studies using an excitation wavelength of 488 nm. However, this one photon-based photoactivation and image acquisition may not be applicable for highlighted Ca2+ imaging in arbitrary cells in vivo where multi-layer cell structures can be formed. For multi-layer cells, photoactivation of PA-TNXL by using multiphoton absorption may be effective since PA-GFP was previously demonstrated to be photoactivated by two-photon absorption17.
Our strategy for designing the photoactivatable indicator, which is based on substituting a FRET pair in the existing FRET-based indicator for PA-GFP and a dim variant of FP, can be applied to confer photoactivatable properties to all types of FRET-based indicators. However, there is a critical point that must be considered. To achieve a large increase in fluorescence intensity upon photoactivation, the indicator should be photoactivated under conditions of low FRET between photoactivated PA-GFP and DimVenus (i.e., before a sustained Ca2+ increase). Higher FRET efficiency can lead to a reduction of the fluorescence intensity of the donor PA-GFP after photoactivation. This property is not desirable for ‘caged’ indicators, which become visible after photoactivation. Therefore, functional photoactivatable indicators which show low FRET efficiency after photoactivation and high FRET efficiency during sensing biological event such as Ca2+ increase should be designed through the optimization of circularly permuted versions and/or linker amino acids length between each protein domain.
A functional indicator based on a circularly permuted FP is also available, and this indicator can be used to develop a photoactivatable indicator. However, activation of cpFP-based indicators relies on changes in the chemical environment surrounding the chromophore. Thus, simple substitution of the cpFP moiety to the photoactivatable cpFP does not work. In our study, we utilized the existing FRET indicator, a significantly less labour-intensive process.
In summary, we developed a photoactivatable Ca2+ indicator, PA-TNXL, composed of PA-GFP and cp173DimVenus linked through a Ca2+ sensing domain, troponin, derived from TN-XL. We successfully monitored Ca2+ dynamics using PA-TNXL in highlighted HeLa cells and dissociated neurons derived from the hippocampus. Imaging studies conducted using photoactivatable functional indicators will allow imaging of specific cells; imaging studies will no longer be limited to the small repertoire of available gene promoters. In addition, examining single cells will allow for more precise quantitation, a quality that is lost when examining bulk cells. This indicator can be used to determine how individual cells cooperate to contribute to the systematic behaviour in the tissue or entire body.
Methods
Gene construction
Venus was modified to a nonfluorescent form using a previously described method with Venus/pRSETB as a template18. DimVenus was prepared by substituting tyrosine at 145 for tryptophan. DarkVenus was prepared by introducing additional substitution of histidine at 148 for valine into DimVenus. cDNAs of the 5′ portions of the cp173DimVenus, cp173DarkVenus, or cp173PA-GFP were amplified using PCR with sense primers containing a BamHI site, followed by first methionine and reverse primers containing the sequence encoding a linker (GGSGG) between the natural N- and C-termini. cDNAs of their 3′ ends were extended using PCR at the 5′ end with a sequence encoding the linker and at the 3′ end with a sequence containing an EcoRI site. The resulting cDNAs for cp173DimVenus, cp173DarkVenus, or cp173PA-GFP were amplified by using a mixture of the 2 PCR products with primers containing sites for BamHI and EcoRI. Products were restriction-digested and cloned in-frame into the BamHI/EcoRI sites of pRSETB (Invitrogen, Carlsbad, CA), yielding cp173DimVenus/pRSETB, cp173DarkVenus/pRSETB, and cp173PA-GFP/pRSETB. Next, the cDNA of cp173DimVenus, cp173DarkVenus, or cp173PA-GFP was modified using PCR to contain a 5′ SacI site. The cDNA of DimVenus, DarkVenus, or PA-GFP was modified using PCR to contain a 5′ BamHI and 3′ SphI site. BamHI/SphI fragments and SacI/EcoRI fragments were substituted for the genes encoding CFP and Citrin in TN-XL/pCDNA3, respectively, to generate troponin-based photoactivatable Ca2+ indicators containing PA-GFP and nonfluorescent Venus variants as a FRET pair. For protein expression in Escherichia coli, the restricted product of PA-TNXL was cloned in-frame into the BamHI/EcoRI sites of pRSETB, yielding PA-TNXL/pRSETB. The nucleotide sequence of the PA-TNXL gene was submitted to GenBANK, with an accession number of AB773422.
Protein expression and purification
Escherichia coli (JM109(DE3)) that had been transformed with pRSETB containing the cDNA for nonfluorescent Venus variants or PA-TNXL was grown for 60 h at 23°C with gentle shaking at 150 rpm10. Recombinant proteins were sequentially purified using an Ni-NTA column (Qiagen, Hilden, Germany), followed by gel filtration using a PD-10 column (GE Healthcare, Uppsala, Sweden) to exchange the buffer with 10 mM HEPES, pH 7.2.
In vitro Ca2+ titration
Protein solution (100 μM, 3 μL) was dropped into the chamber constructed by attaching a coverslip with a silicon rubber sheet (thickness, 3 mm) with a cylindrical hole (diameter, 1.5 mm). The open end of the chamber was covered by another coverslip and placed on a Nikon inverted microscope Ti-E equipped with a PlanApo 60 × 1.40 numerical aperture (NA) oil objective and mercury-arc lamp. For photoactivation, light reflected by Chroma 420DCLP dichroic mirror (110 W/cm2) was irradiated on the sample for 10 min. Photoactivation was repeated, and the recovered sample was collected. The emission spectra of PA-TNXL at 0.3 μM were measured by excitation at 488 nm using an F-7000 fluorescence spectrophotometer (Hitachi). Ca2+ titrations were performed by reciprocal dilution of Ca2+-saturated and Ca2+-free buffers containing MOPS (10 mM), KCl (100 mM), and EGTA (10 mM) or EDTA-OH (10 mM) with or without 10 mM Ca2+ from CaCO3 at pH 7.2 and room temperature (23–25°C)19.
HeLa cell culture and transfection
HeLa cells were grown in Dulbecco's modified Eagle's medium containing 10% heat-inactivated fetal calf serum at 37°C in a CO2 incubator. One day before transfection, cells were dissociated and transferred onto a 35-mm glass-bottom dish (Matsunami, Osaka, Japan). Expression vectors encoding troponin-based photoactivatable Ca2+ indicators were transfected using Lipofectamine reagent (Invitrogen) according to the manufacturer's instructions.
Rat hippocampal neuron culture and transfection
Primary cultures of hippocampal neurons co-cultured with astrocytes were prepared from E18 Wistar rat embryos as previously described20 with some modifications. Hippocampal cells were dissociated in plating medium comprising minimum essential medium (MEM; Invitrogen) supplemented with 2% B27 (Invitrogen), 2 mM L-glutamine, 1 mM sodium pyruvate (Invitrogen), and antibiotics (penicillin-G potassium salt (50 units/mL), and streptomycin sulphate (50 μg/mL)), and were plated at a density of 1.5 × 10⁵ cells/ml onto 18-mm diameter glass coverslips (Deckgläser, Carolina Biologicals) precoated with 0.04% polyethyleneimine (Sigma, Tokyo, Japan). On the 4th day in vitro (DIV-4), half of the culture medium was replaced with MEM containing 2% fetal bovine serum (FBS), 1 × N2 Supplement (Invitrogen), and penicillin-streptomycin. Neuronal cells were transfected on DIV-7 with PA-TNXL/pcDNA3 using calcium phosphate precipitation. Cells were imaged 2–4 days after transfection. All animal experiments were performed according to the Institutional Guidance of Osaka university on Animal Experimentation and under permission by the animal experiment committee of Osaka-University.
Imaging
For cell imaging, we used an Olympus confocal inverted microscope FV1000 equipped with UPLSAPO 60 × 1.35 NA oil objective and multi-Argon ion laser. We used a 405 nm laser diode (25 mW) for photostimulation. The green fluorescence signal was acquired by excitation at 488 nm and detected in the 500–600 nm wavelength range. To image histamine-induced Ca2+ dynamics in HeLa cells, histamine (10 μL) was added at a final concentration of 5 μM approximately 30 s after beginning the measurement.
Author Contributions
T.N. conceived the experiments. T.M. and K.H. designed PA-TNXL construct. T.M. performed construction and characterization of PA-TNXL and Ca2+ imaging. K.S. created the DimVenus construct. T.N. and T.M. wrote the manuscript.
Supplementary Material
Supplementary Video 1
Supplementary Information
Acknowledgments
We thank H. Bannai and K. Mikoshiba for their guidance with imaging in the neuron dissociation culture. We also thank V.P. Koldenkova for valuable comments. This work was partly supported by MEXT Grant-in-Aid for Scientific Research on Innovative Areas (23115003, T.N. and 23111502, T.M.).
References
- Clapham D. E. Calcium signaling. Cell 131, 1047–1058 (2007). [DOI] [PubMed] [Google Scholar]
- Grynkiewicz G., Poenie M. & Tsien R. Y. A new generation of Ca2+ indicators with greatly improved fluorescence properties. J. Biol. Chem. 260, 3440–3450 (1985). [PubMed] [Google Scholar]
- Paredes R. M., Etzler J. C., Watts L. T., Zheng W. & Lechleiter J. D. Chemical calcium indicators. Methods 46, 143–151 (2008). [DOI] [PMC free article] [PubMed] [Google Scholar]
- Mank M. & Griesbeck O. Genetically encoded calcium indicators. Chem. Rev. 108, 1550–1564 (2008). [DOI] [PubMed] [Google Scholar]
- Nagai T., Yamada S., Tominaga T., Ichikawa M. & Miyawaki A. Expanded dynamic range of fluorescent indicators for Ca2+ by circularly permuted yellow fluorescent proteins. Proc. Natl. Acad. Sci. USA 101, 10554–10559 (2004). [DOI] [PMC free article] [PubMed] [Google Scholar]
- Mank M. et al. A FRET-based calcium biosensor with fast signal kinetics and high fluorescence change. Biophys. J. 90, 1790–1796 (2006). [DOI] [PMC free article] [PubMed] [Google Scholar]
- Nakai J., Ohkura M. & Imoto K. A high signal-to-noise Ca2+ probe composed of a single green fluorescent protein. Nat. Biotechnol. 19, 137–141 (2001). [DOI] [PubMed] [Google Scholar]
- Nagai T., Sawano A., Park E. S. & Miyawaki A. Circularly permuted green fluorescent proteins engineered to sense Ca2+. Proc. Natl. Acad. Sci. USA 98, 3197–3202 (2001). [DOI] [PMC free article] [PubMed] [Google Scholar]
- Zhao Y. et al. An expanded palette of genetically encoded Ca2+ indicators. Science 333, 1888–1891 (2011). [DOI] [PMC free article] [PubMed] [Google Scholar]
- Horikawa K. et al. Spontaneous network activity visualized by ultrasensitive Ca2+ indicators, yellow Cameleon-Nano. Nat. Methods 7, 729–732 (2010). [DOI] [PubMed] [Google Scholar]
- Patterson G. H. & Lippincott-Schwartz J. A photoactivatable GFP for selective photolabeling of proteins and cells. Science 297, 1873–1877 (2002). [DOI] [PubMed] [Google Scholar]
- Verkhusha V. V. & Lukyanov K. A. The molecular properties and applications of Anthozoa fluorescent proteins and chromoproteins. Nat. Biotechnol. 22, 289–296 (2004). [DOI] [PubMed] [Google Scholar]
- Lukyanov K. A. et al. Natural animal coloration can Be determined by a nonfluorescent green fluorescent protein homolog. J. Biol. Chem. 275, 25879–25882 (2000). [DOI] [PubMed] [Google Scholar]
- Nagai T. et al. A variant of yellow fluorescent protein with fast and efficient maturation for cell-biological applications. Nat. Biotechnol. 20, 87–90 (2002). [DOI] [PubMed] [Google Scholar]
- Ganesan S., Ameer-Beg S. M., Ng T. T., Vojnovic B. & Wouters F. S. A dark yellow fluorescent protein (YFP)-based Resonance Energy-Accepting Chromoprotein (REACh) for Förster resonance energy transfer with GFP. Proc. Natl. Acad. Sci. USA 103, 4089–4094 (2006). [DOI] [PMC free article] [PubMed] [Google Scholar]
- Kwok S. et al. Genetically encoded probe for fluorescence lifetime imaging of CaMKII activity. Biochem. Biophys. Res. Commun. 369, 519–525 (2008). [DOI] [PMC free article] [PubMed] [Google Scholar]
- Ruta V. et al. A dimorphic pheromone circuit in Drosophila from sensory input to descending output. Nature 468, 686–690 (2010). [DOI] [PubMed] [Google Scholar]
- Sawano A. & Miyawaki A. Directed evolution of green fluorescent protein by a new versatile PCR strategy for site-directed and semi-random mutagenesis. Nucleic Acids Res. 28, E78 (2000). [DOI] [PMC free article] [PubMed] [Google Scholar]
- Tsien R. & Pozzan T. Measurement of cytosolic free Ca2+ with quin2. Methods Enzymol. 172, 230–262 (1989). [DOI] [PubMed] [Google Scholar]
- Goslin K., Asmussen H. & Banker G. Rat Hippocampal Neurons in Low-Density Culture. In: Culturing nerve cells 2nd Ed. (MIT press, 1998) Ch. 13, pp. 339–370. [Google Scholar]
Associated Data
This section collects any data citations, data availability statements, or supplementary materials included in this article.
Supplementary Materials
Supplementary Video 1
Supplementary Information


