Abstract
The present study used concurrent-vowel recognition to measure integration efficiency of combined acoustic and electric stimulation in eight actual cochlear-implant subjects who had normal or residual low-frequency acoustic hearing contralaterally. Although these subjects could recognize single vowels (>90% correct) with either electric or combined stimulation, their performance degraded significantly in concurrent-vowel recognition. Compared with previous simulation results using normal-hearing subjects, the present subjects produced similar performance with acoustic or electric stimulation alone, but significantly lower performance with combined stimulation. A probabilistic model found reduced integration efficiency between acoustic and electric stimulation in the present subjects. The integration efficiency was negatively correlated with residual acoustic hearing in the non-implanted ear and duration of deafness in the implanted ear. The present result suggests a central origin of the integration deficit and that this integration be evaluated and considered in future management of hearing impairment and design of auditory prostheses.
Combined electric-acoustic stimulation (EAS) enhances cochlear implant (CI) speech recognition in noise, particularly when the noise is a competing talker1,2,3. However, two major issues still remain unresolved in the present literature. First, there is a great deal of variability in the EAS benefit but the sources of this variability are unknown. At least three different factors have been implicated, including target and masker materials, acoustic signal processing and presentation, and individual psychophysical capabilities4,5,6. Second, the mechanisms of the EAS benefit are unclear. Three different mechanisms have been suggested to include auditory object segregation7,8, temporal glimpsing9,10,11, and synergetic integration of independent acoustic and electric stimulation (namely, “1 + 1 > 2”)3,9,12.
The present study focused on concurrent vowel recognition, in which both “target and masker” are voiced and have the same duration and the same amplitude. This stimulus configuration would not only prevent the use of the temporal glimpsing cue or other strong perceptual segregation cues such as onset and offset, but also eliminate high-level semantic and grammatical context cues8,13. Therefore, concurrent-vowel recognition can be used to explicitly test synergetic interaction between acoustic and electric stimulation. In an EAS simulation study, Qin and Oxenham8 asked normal-hearing subjects to recognize low-passed, noise-vocoded, and combined concurrent vowels and found a significant synergetic EAS interaction even with a 300-Hz low-pass condition. The Qin and Oxenham study has been widely cited (62 citations on Nov 23, 2012 according to Google Scholar), but not yet replicated in actual EAS subjects. This replication is important for several well-known caveats between actual and simulated EAS subjects. First, unlike actual EAS subjects who are all likely to have hearing loss even at low frequencies, normal-hearing subjects have “ideal residual hearing, with no hearing loss and accompanying effects, such as broadened auditory filters8.” Second, the vocoded speech likely simulates the best cochlear implant performance14. Third, simulated and actual EAS subjects likely have different durations of acoustic, electric and combined hearing experience, affecting their usage of these different cues and possible interactions between acoustic and electric stimulation15. The present study addressed these caveats and explicitly examined acoustic and electric integration efficiency in actual EAS subjects.
Results
In single-vowel recognition, the present actual EAS subjects (n = 8) produced 65%, 91%, and 94% correct scores with acoustic stimulation, electric stimulation, and EAS, respectively. These scores were similar to Qin and Oxenham's simulation scores, suggesting that electric stimulation and EAS both contained sufficient information for recognizing the synthetic single vowels, but the low-passed acoustic stimulation did not. It was important to establish that the actual EAS subjects can achieve nearly perfect performance with EAS to assure that single-vowel recognition ability would not confound interpretations of the concurrent-vowel recognition results.
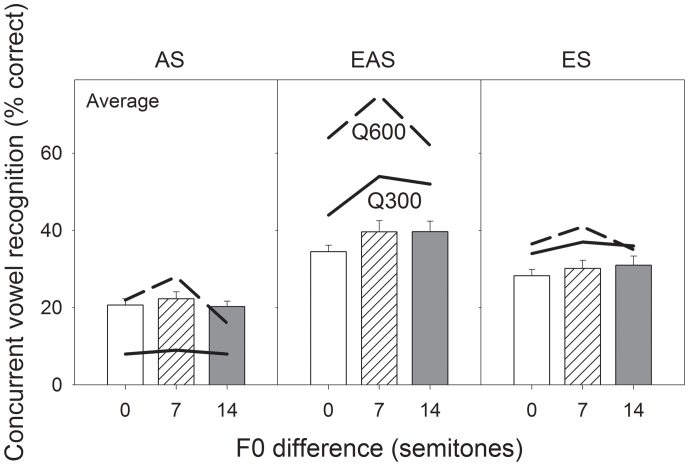
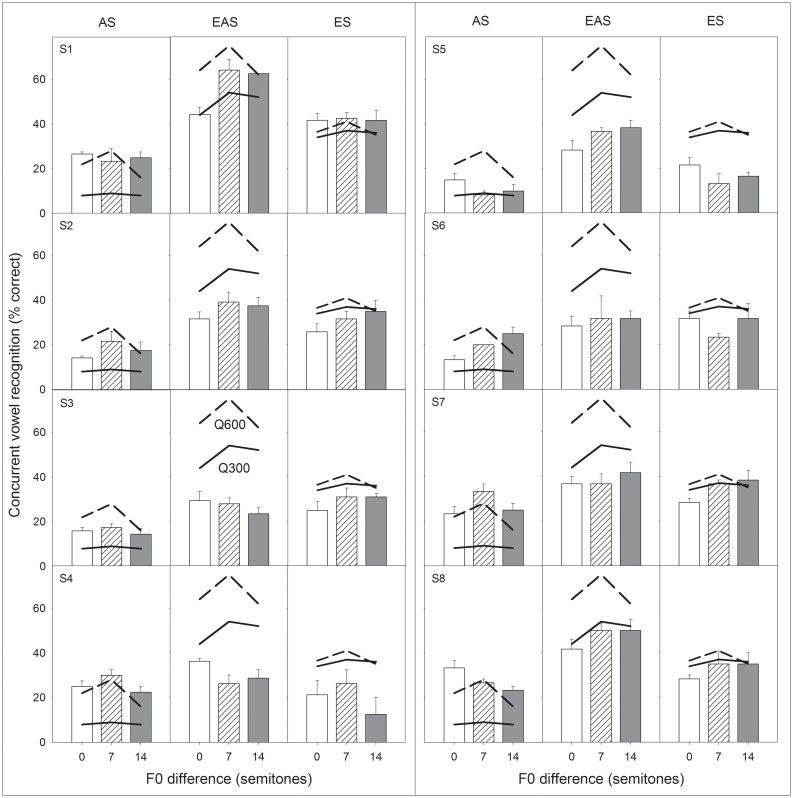
Figure 1 shows average concurrent-vowel recognition results as a function of F0 difference (bars) with acoustic stimulation (left panel), EAS (middle panel), and electric stimulation (right panel). For comparison, each panel also plots Qin and Oxenham's simulation results from 300-Hz (solid line) and 600-Hz (dashed line) low-pass conditions. Analysis of the actual EAS data shows that stimulation mode was a significant factor [F(1.89,41.69) = 51.9, p < 0.05], but F0 separation was not [F(1.91,42.05) = 3.16, p = 0.052]. Averaging across three F0 conditions and eight subjects, EAS produced significantly better performance (38%) than acoustic stimulation [vs. 21%; F(1,68) = 125.5, p < 0.05] or electric stimulation [vs. 30%; F(1,68) = 35.6, p < 0.05]. Figure 2 shows a wide range of individual concurrent-vowel recognition from much lower than normal performance by S3 and S4 to nearly normal performance by S1 and S8.
Figure 1. Average concurrent vowel recognition as a function of F0 difference with acoustic stimulation (left panel), electric-acoustic stimulation (middle panel), and electric stimulation (right panel).
The open, hatched, and filled bars represent percent correct scores with a F0 difference of 100–100 Hz, 100–158.7 Hz, and 100–224.5 Hz (or 0, 7, and 14 semitones above 100 Hz), respectively. The chance performance level is 10%. The error bars represent one standard error of mean. Comparable data from Qin and Oxenham's study (2006) are re-plotted as the solid line for the 300-Hz and the dashed line for the 600-Hz low-pass condition.
Figure 2. Individual concurrent vowel recognition as a function of F0 difference with acoustic stimulation (left column in each panel), electric-acoustic stimulation (middle column) or electric stimulation (right column).
Data presentation is the same as Fig. 1.
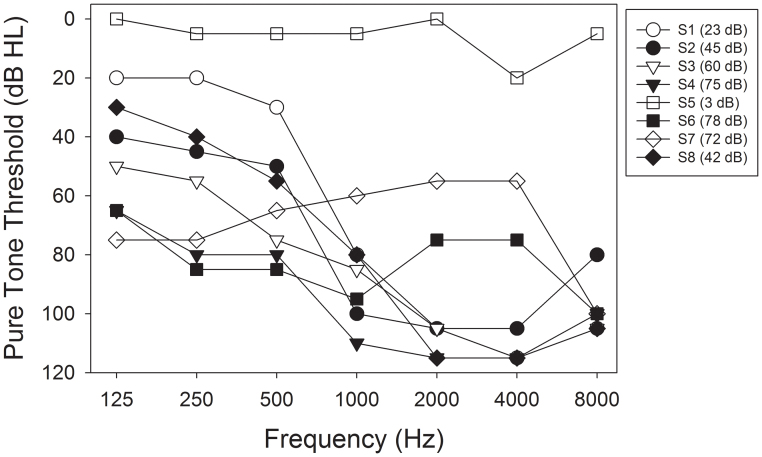
Comparison between the present actual EAS and Qin and Oxenham's simulation results revealed several interesting findings. First, actual and simulated acoustic stimulations produced similar performance (21% vs. 15%; p = 0.08). This finding was somewhat surprising because seven of the eight actual EAS subjects had hearing loss even at low frequencies (23–78 dB HL, see Fig. 3). Possibly due to a floor effect, the quality of residual acoustic hearing did not affect performance. Second, actual and simulated electric stimulations also produced similar results (30% vs. 37%; p = 0.08). This pattern was expected because numerous studies have shown that vocoded speech tends to simulate the best CI performance14. The most surprising finding was that despite similar performance in acoustic and electric stimulation, the actual EAS performance was 21 percentage points or 36% lower than the simulated EAS performance (38% vs. 59%; p < 0.05). The present result suggests that Qin and Oxenham's simulation reasonably estimated actual performance in acoustic or electric stimulation alone, but overestimated synergetic integration between acoustic and electric stimulation.
Figure 3. Audiograms of the non-implanted ear in the present EAS subjects.
The dB HL value in the parenthesis next to the subject number represents the pure-tone-average threshold over 125, 250, and 500 Hz.
Discussion
The most important finding in the present study is that actual and simulated EAS subjects receive similar amount of acoustic and electric information, but have different abilities to integrate the information16. To quantify integration efficiency, it is assumed that acoustic stimulation produces a percent correct score of Pa, and electric stimulation produces a percent correct score of Pe. If acoustic and electric stimulation are independent, then the predicted EAS score would be17:
The EAS integration efficiency (IE) is defined as:
where P'eas is the actual EAS score and Peas is the predicted EAS score.
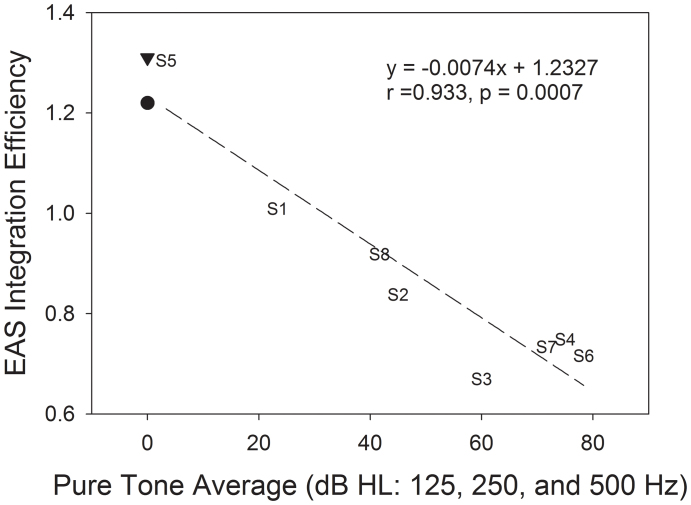
The actual EAS subjects produced integration efficiency ranging from 0.67 to 1.30, while the simulated subjects produced relatively high efficiency (1.22 for 300-Hz and 1.31 for 600-Hz low-pass condition). Figure 4 shows EAS integration efficiency as a function of the pure-tone-average threshold at 125, 250, and 500 Hz. A significant negative correlation was found between the actual EAS subjects' integration efficiency and their pure-tone-average threshold, suggesting that quality of acoustic hearing affects synergetic integration between acoustic and electric stimulation. Similar to previous studies, greater EAS benefit is associated with either a shallower audiogram slope18 or lower low-frequency thresholds19.
Figure 4. Linear regression between EAS integration efficiency (see Equations 1 and 2 in text for details) and the pure tone average threshold at 125, 250, and 500 Hz (dB HL) in the non-implanted ear.
The EAS integration efficiency from Qin and Oxenham's study (2006) is also shown as a reference but not included in the correlation analysis (filled triangle: Q600; filled circle: Q300). The legend shows the linear regression equation, correlation coefficient (r), and p-value.
The mechanisms of this synergetic integration are unclear but are certainly located in the central auditory pathway. In the present subjects who had a cochlear implant on one side and residual low-frequency hearing on the other, information must be integrated not only between ears but also between high and low frequencies. Physiological evidence suggests that such integration has to occur in the superior olivary complex or higher nuclei in the central auditory pathway20.
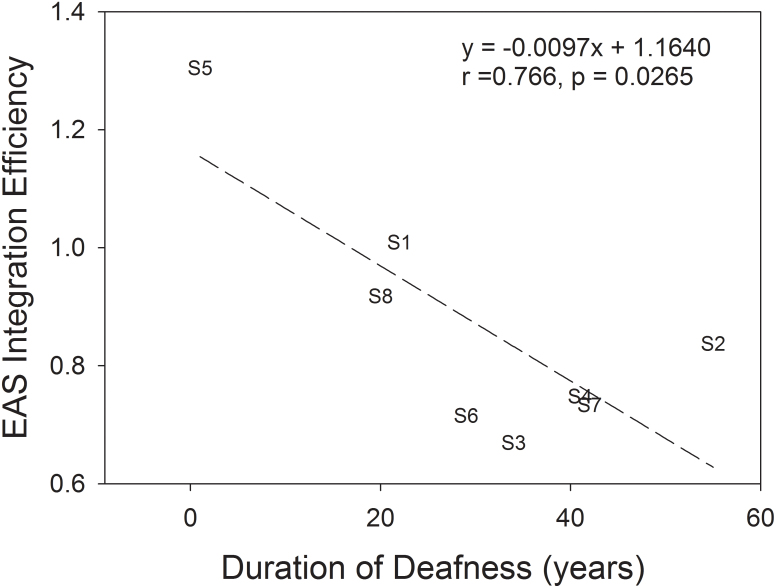
The EAS integration efficiency was also correlated to subject demographic or audiological variables (Table 1). No significant correlation was found with any variables except for the duration of deafness in the implanted ear (Fig. 5). This negative correlation reinforces not only a “use it or lose it” central mechanism21,22, but also the importance of early implantation for combined acoustic and electric stimulation23.
Table 1. Subjects' demographic and audiological information.
| Implanted ear | Non-implanted ear | HINT recognition in quiet | |||||||||||||
|---|---|---|---|---|---|---|---|---|---|---|---|---|---|---|---|
| ID | Gender | Age | Etiology | side | HL onset age (yr) | Duration of deafness (yr) | CI experience (yr) | CI processor | PTT average (dB HL) | FDL average (Hz) | HL onset age (yr) | Duration of HL (yr) | HA experience (yr) | W/CI | W/EAS |
| S1 | F | 68 | aging | R | 45 | 22 | 1 | Freedom | 23 | 2.8 | 48 | 5 | 15 | 90 | 95 |
| S2 | F | 67 | genetic | R | 5 | 55 | 7 | Freedom | 45 | N/A | 5 | 25 | 37 | 80 | 90 |
| S3 | M | 84 | genetic | L | 43 | 34 | 7 | Esprit 3G | 60 | N/A | 43 | 20 | 21 | 35 | 60 |
| S4 | F | 57 | unknown | L | 4 | 41 | 12 | S-series | 75 | 7.2 | 4 | 4 | 49 | 40 | 70 |
| S5 | M | 54 | unknown | R | 45 | 1 | 8* | HiRes90 | 3 | 5.7 | N/A | 0 | N/A | 70 | N/A |
| S6 | F | 77 | genetic | L | 47 | 29 | 1 | Nucleus 5 | 78 | 107.0 | 45 | 0 | 32 | N/A | N/A |
| S7 | M | 48 | mother had Rubella | R | 0 | 42 | 6 | Freedom | 72 | 104.7 | 0 | 1 | 47 | 50 | 80 |
| S8 | F | 44 | genetic | L | 21 | 20 | 3 | Nucleus 5 | 42 | 14.1 | 21 | 1 | 22 | 60 | 90 |
HL: Hearing Loss.
HINT: Hearing In Noise Test.
PTT average: Pure Tone Threshold average across 125, 250, and 500 Hz.
FDL average: Frequency Difference Limen average across 125, 250, and 500 Hz. Average was obtained between 250 and 500 Hz for S4.
*S5 has had the implant for 8 years but does not regularly use it.
Figure 5. Linear regression between EAS integration efficiency and duration of deafness in the implanted ear.
The legend shows the linear regression equation, correlation coefficient (r), and p-value.
Methods
Subjects
One prelingually-deafened (S7) and seven postlingually-deafened adult CI subjects (44–84 years old) with normal hearing (S5) or residual low-frequency acoustic hearing (the rest) in their non-implanted ear participated in this experiment. They were native American English speakers and had at least one year of EAS experience at the time of the experiment. Table 1 shows their demographic and audiological information. Figure 3 shows audiograms of the non-implanted ear, with a low-frequency (125, 250, and 500 Hz) pure-tone-average threshold being displayed in the parenthesis next to the subject number. All subjects signed a consent document approved by the University of California Irvine Institutional Review Board and were paid for their participation in the experiment.
Stimuli
Five single vowels (/i/, /a/, /u/, / /, and /
 /, as in /Heed/, /Hod/, /Hood/, /Heard/, and /Head/, respectively) were generated using the Klatt synthesizer provided by the Vowel Synthesis Interface (Speech Research Lab, A.I. DuPont Hospital for Children and the University of Delaware, Wilmington, Delaware, USA). To simulate natural speech, all vowels had 20-ms on-ramp, 250-ms constant-frequency formant, 200-ms formant glide (3% change in 1st, 2nd, and 3rd formants), 60-ms F0 drop (30%), and 30-ms off-ramp. Three F0s, 100.0, 158.7, and 224.5 Hz, corresponding to 0, 8, and 14 semitones above 100 Hz, were used to simulate different talkers. All vowels had the same long-term root-mean-square (RMS) amplitude.
Two of these five synthetic single vowels were randomly selected and added to generate 10 distinctive concurrent vowels. With 3 F0s, a total of 30 distinct concurrent vowels were generated. The RMS amplitude of the concurrent-vowel pair was also normalized.
In acoustic stimulation, the synthetic vowels were linearly amplified via a high-quality sound card (Creative Labs E-MU 0404 USB digital audio system, Creative Technology Ltd., Singapore) and presented through a Sennheiser HAD200 headphone (Sennheiser electronic GmbH & Co. KG, Wedemark, Germany) to the non-implanted ear at the most comfortable level. To simulate low-frequency hearing loss, 500-Hz low-passed synthetic vowels were presented to S5. In electric stimulation, the subjects used their own clinical processors to listen to the vowels through an audio cable. In the EAS condition, the subjects listened to the vowels delivered simultaneously to both the implanted and non-implanted ears.
Procedure
Before formal testing, the subjects practiced extensively for 5–17 hours over a period of 2–11 days to become familiarized with the stimuli, procedure, and computer-based testing interface. The subjects listened to the synthetic single or concurrent vowels and checked their responses with feedback as many times as they wished. During the test, they listened to a randomly selected vowel stimulus and recorded their response by clicking one of the vowel stimulus buttons on the interface without any feedback. A total of 150 single vowels (5 vowels × 3 F0s × 10 trials) and a total of 90 concurrent vowels (10 pairs × 3 F0s × 3 trials) were used for each stimulus condition. Percent correct scores were recorded for further statistic analysis.
Data analysis
Repeated measures analysis of variance among percent correct scores was carried out using SPSS 16.0 (IBM Corporation Armonk, New York, USA). Normality of data was assessed by the Shapiro-Wilk Test, which revealed a normal distribution of concurrent vowel recognition scores with acoustic stimulation and electric stimulation but not with EAS. However, the kurtosis (value = 0.27, Std. Error = 0.57) of EAS percent correct scores was near 0 and fell within the range of plus/minus two standard errors, suggesting a normal distribution of EAS percent correct scores. The Mauchly's Test was used to assess the sphericity assumption, and F-value was adjusted by a Greenhouse-Geisser correction if the assumption had been violated. A p-value less than 0.05 was deemed significant.
Correlation between the EAS integration efficiency and pure-tone-average threshold or average frequency difference limen at 125, 250, and 500 Hz were analyzed by a linear regression model with SigmaPlot 10.0 (Systat Software, Inc., Chicago, Illinois, USA).
Author Contributions
H. I. Y. designed and conducted the experiment. Both authors contributed to data analysis, interpretation, and writing of the manuscript.
Acknowledgments
The authors thank the subjects for their time and dedication and Ling-Xuan Kong for her help in data collection. This work was supported by National Institutes of Health Grants (1RO1 DC008858 and P30 DC008369) and National Science Council, Republic of China (NSC-095-SAF-I-564-054-TMS).
References
- von Ilberg C. A. et al. Electric-acoustic stimulation of the auditory system. New technology for severe hearing loss. ORL. J. Otorhinolaryngol. Relat. Spec. 161(6), 334–340 (1999). [DOI] [PubMed] [Google Scholar]
- Turner C. W., Gantz B. J., Vidal C., Behrens A. & Henry B. A. Speech recognition in noise for cochlear implant listeners: benefits of residual acoustic hearing. J. Acoust. Soc. Am. 115(4), 1729–1735 (2004). [DOI] [PubMed] [Google Scholar]
- Kong Y. Y., Stickney G. & Zeng F. G. Speech and melody recognition in binaurally combined acoustic and electric hearing. J. Acoust. Soc. Am. 117, 1351–1361 (2005). [DOI] [PubMed] [Google Scholar]
- Dorman M. F. & Gifford R. H. Combining acoustic and electric stimulation in the service of speech recognition. Int. J. Audiol. 49(12), 912–919 (2010). [DOI] [PMC free article] [PubMed] [Google Scholar]
- Von Ilberg C. A., Baumann U., Kiefer J., Tillein J. & Adunka O. F. Electric-acoustic stimulation of the auditory system: a review of the first decade. Audio. Neurootol. 16 Suppl. 2, 1–30 (2011). [DOI] [PubMed] [Google Scholar]
- Visram A. S., Azadpour M., Kluk K. & McKay C. M. Beneficial acoustic speech cues for cochlear implant users with residual acoustic hearing. J. Acoust. Soc. Am. 131(5), 4042–4050 (2012). [DOI] [PubMed] [Google Scholar]
- Zeng F. G. Trends in cochlear implants. Trends Amplif. 8(1), 1–34 (2004). [DOI] [PMC free article] [PubMed] [Google Scholar]
- Qin M. K. & Oxenham A. J. Effects of introducing unprocessed low-frequency information on the reception of envelope-vocoder processed speech. J. Acoust. Soc. Am. 119(4), 2417–2426 (2006). [DOI] [PubMed] [Google Scholar]
- Kong Y. Y. & Carlyon R. P. Improved speech recognition in noise in simulated binaurally combined acoustic and electric stimulation. J. Acoust. Soc. Am. 121(6), 3717–3727 (2007). [DOI] [PubMed] [Google Scholar]
- Brown C. A. & Bacon S. P. Low-frequency speech cues and simulated electric-acoustic hearing. J. Acoust. Soc. Am. 125(3), 1658–1665 (2009). [DOI] [PMC free article] [PubMed] [Google Scholar]
- Li N. & Loizou P. C. A glimpsing account for the benefit of simulated combined acoustic and electric hearing. J. Acoust. Soc. Am. 123(4), 2287–2294 (2008). [DOI] [PMC free article] [PubMed] [Google Scholar]
- Ching T. Y. C., Psarros C., Hill M., Dillon H. & Incerti P. Should children who use cochlear implants wear hearing aids in the opposite ear? Ear Hear. 22(5), 365–380 (2001). [DOI] [PubMed] [Google Scholar]
- Scheffers M. T. M. Shifting vowels: auditory pitch analysis and sound segregation. Doctoral dissertation, University of Groningen, the Netherlands. (1983).
- Fishman K. E., Shannon R. V. & Slattery W. H. Speech recognition as a function of the number of electrodes used in the SPEAK cochlear implant speech processor. J. Speech Lang. Hear. Res. 40(5), 1201–1215 (1997). [DOI] [PubMed] [Google Scholar]
- Lin P., Turner C. W., Gantz B. J., Djalilian H. R. & Zeng F. G. Ipsilateral masking between acoustic and electric stimulations. J. Acoust. Soc. Am. 130(2), 858–865 (2011). [DOI] [PMC free article] [PubMed] [Google Scholar]
- Kong Y. Y. & Braida L. D. Cross-frequency integration for consonant and vowel identification in bimodal hearing. J. Speech Lang. Hear. Res. 54(3), 959–980 (2011). [DOI] [PMC free article] [PubMed] [Google Scholar]
- Micheyl C. & Oxenham A. J. Comparing models of the combined-stimulation advantage for speech recognition. J. Acoust. Soc. Am. 131(5), 3970–3980 (2012). [DOI] [PMC free article] [PubMed] [Google Scholar]
- Sheffield B. & Zeng F. G. The relative phonetic contributions of a cochlear implant and residual acoustic hearing to bimodal speech perception. J. Acoust. Soc. Am. 131(1), 518–530 (2012). [DOI] [PMC free article] [PubMed] [Google Scholar]
- Mok M., Galvin K. L., Dowell R. C. & McKay C. M. Speech perception benefit for children with a cochlear implant and a hearing aid in opposite ears and children with bilateral cochlear implants. Audiol. Neurootol. 15(1), 44–56 (2010). [DOI] [PubMed] [Google Scholar]
- McPherson D. L. & Starr A. Binaural interaction in auditory evoked potentials: brainstem, middle- and long-latency components. Hear Res. 66(1), 91–98 (1993). [DOI] [PubMed] [Google Scholar]
- Kral A. Unimodal and cross-modal plasticity in the ‘deaf’ auditory cortex. Int. J Audiol. 46(9), 479–493 (2007). [DOI] [PubMed] [Google Scholar]
- Lee D. S. et al. Cross-modal plasticity and cochlear implants. Nature. 409(6817), 149–150 (2001). [DOI] [PubMed] [Google Scholar]
- Sharma A., Dorman M. F. & Kral A. The influence of a sensitive period on central auditory development in children with unilateral and bilateral cochlear implants. Hear Res. 203(1–2), 134–143 (2005). [DOI] [PubMed] [Google Scholar]


