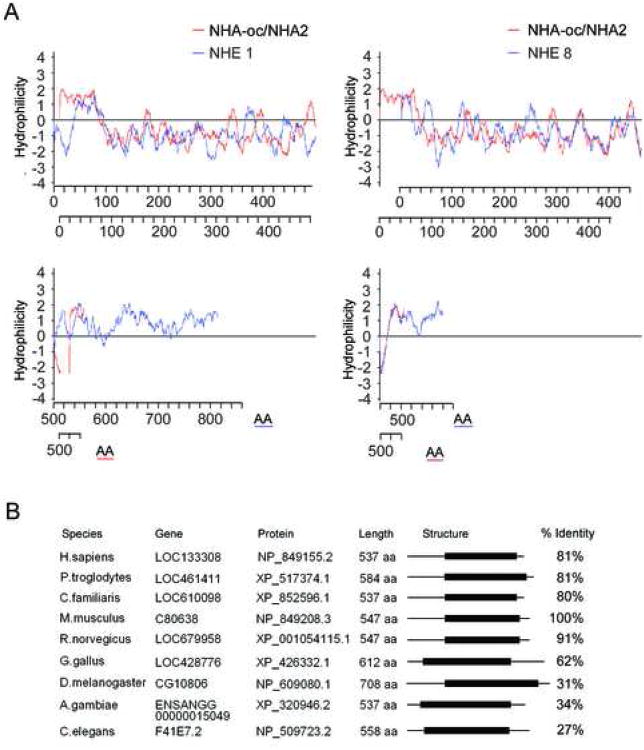
Figure 2.
(A) A comparison between the hydropathic profiles of NHA-oc/NHA2 (red line) and NHE1 (blue line, left panel) or NHE8 (blue line, right panel) shows that NHA-oc/NHA2 has similar structural features, even though there is no significant sequence homology between NHA-oc/NHA2 and either NHE.
(B) nha-oc/NHA2 metazoan orthologues. For all the genes the species, the gene, protein accession numbers, and the shared NHE domain, (shown as a black box) is indicated. The right column indicates the similarity between the mouse NHA-oc/NHA2 and the other orthologues (in percentage).

