

Abstract
Auditory stimulus representations are dynamically maintained by ascending and descending projections linking the auditory cortex (Actx), medial geniculate body (MGB), and inferior colliculus. Although the extent and topographic specificity of descending auditory corticofugal projections can equal or surpass that of ascending corticopetal projections, little is known about the molecular mechanisms that guide their development. Here, we used in utero gene electroporation to examine the role of EphA receptor signaling in the development of corticothalamic (CT) and corticocollicular connections. Early in postnatal development, CT axons were restricted to a deep dorsal zone (DDZ) within the MGB that expressed low levels of the ephrin-A ligand. By hearing onset, CT axons had innervated surrounding regions of MGB in control-electroporated mice but remained fixed within the DDZ in mice overexpressing EphA7. In vivo neurophysiological recordings demonstrated a corresponding reduction in spontaneous firing rate, but no changes in sound-evoked responsiveness within MGB regions deprived of CT innervation. Structural and functional CT disruption occurred without gross alterations in thalamocortical connectivity. These data demonstrate a potential role for EphA/ephrin-A signaling in the initial guidance of corticofugal axons and suggest that “genetic rewiring” may represent a useful functional tool to alter cortical feedback without silencing Actx.
Keywords: axon guidance, corticofugal, Eph, feedback, top-down
Introduction
Since the early descriptions of Ramon y Cajal, anatomists have recognized the massive and specific network of corticofugal projections that originate in deep layers of the cerebral cortex and innervate nearly every level of the central nervous system (Ramon y Cajal 1911). Deep layer auditory cortex (Actx) neurons project throughout the central auditory neuroaxis in addition to nonauditory nuclei in the pons, striatum, and limbic system in a highly topographic manner (for review, see Winer 2005). For instance, Actx projections are strongly biased toward extralemniscal divisions of the inferior colliculus (IC) (i.e., the external and dorsal cortex) rather than the lemniscal division (i.e., the central nucleus), and connections between discrete zones within Actx and medial geniculate body (MGB) are reciprocal (Andersen, Knight, et al. 1980; Winer and Larue 1987). Laminar differences in corticothalamic (CT) topography have also been noted, with large caliber Type I axon terminals from layer V neurons targeting a circumscribed deep dorsal zone (DDZ) near the boundary of the dorsal and ventral divisions of the MGB (MGBd and MGBv, respectively), and smaller Type II axons from layer VI neurons targeting focal patches in all subdivisions of the MGB (cat, Diamond et al. 1969; Winer and Morest 1984; Ojima 1994; Bajo et al. 1995; rat, Rouiller and Welker 1991; Bartlett et al. 2000; Hazama et al. 2004; and mouse, Llano and Sherman 2008).
Although the neuroanatomical descriptions of the auditory corticofugal system are numerous, the molecular mechanisms that shape topography in the developing thalamus and cortex have predominantly been characterized in the somatosensory and visual systems (for recent reviews, see Leamey et al. 2009; Li and Crair 2011). Studies in these systems have identified a critical role for the EphA family of receptor tyrosine kinases and their ligands, ephrin-As, in the initial establishment of thalamocortical and CT targeting (Drescher et al. 1995; Frisen et al. 1998; Vanderhaeghen et al. 2000; Sestan et al. 2001; Uziel et al. 2002; Cang et al. 2005; Torii and Levitt 2005), which complements studies on the role of Eph/ephrin signaling in the development of auditory brainstem and midbrain connectivity (Cramer et al. 2000; Huffman and Cramer 2007; Gabriele et al. 2011).
Motivated by the findings in the auditory brainstem and nonauditory areas of the cerebral cortex, we explored the possibility that the topographic patterning of auditory CT and corticocollicular (CC) projections is determined, at least in part, by EphA/ephrin-A interactions. We directly tested the role of EphA receptors in the development of corticofugal topography by elevating levels of EphA7 expression within Actx neurons using in utero gene electroporation (Cramer et al. 2004; Torii and Levitt 2005). We found EphA7 overexpression can alter CT and CC—but not thalamocortical—connectivity in infant and juvenile mice and that these modifications are associated with subtle, but significant, in vivo neurophysiological changes within the MGB. These data provide the first evidence that EphA signaling guides connectivity in the initial stages of auditory corticofugal system development. This genetics-based approach to rewire corticofugal connections provides new information about how these projections arise developmentally but may also represent a useful approach to study the functional contributions of the corticofugal systems to hearing.
Materials and Methods
Animals
All experiments using animals were in accordance with the protocols approved by Institutional Animal Care and Use Committee of Yale University and Vanderbilt University. CD-1 wild-type mice (Charles River) of either sex were used for all experiments. Noon of the day on which a vaginal plug was first observed, and the day of birth was designated as embryonic day (E) 0.5 and postnatal day (P) 0, respectively.
In Utero Electroporation
In utero electroporation-mediated gene transfer was performed as previously described (Saito and Nakatsuji 2001; Tabata and Nakajima 2001). Briefly, at E12.5, the dam was anesthetized with ketamine/xylazine (100/10 mg/kg), and the uterine horns were exposed. A pipette containing the EphA7 expression plasmid (pCAGGS-rEphA7-IRES-Venus containing full-length complementary deoxyribonucleic acid of rat EphA7, 2 mg/mL) or control plasmid (pCAGGS-IRES-EGFP, 2 mg/mL) with pCAGGS-EGFP (0.5 mg/mL) was injected into the lateral ventricle of each embryo. Electrodes were positioned on either side of the head, parallel to the sagittal plane, and an electrical current (five 50 ms pulses of 30 V with 950 ms intervals) was passed between them to drive the plasmid DNA into lateral cortical areas including the nascent Actx (Fig. 1A). The uterine horns were replaced, and the dam was allowed to recover and give birth normally. Usable mice were screened at P0 by visualizing electroporated green fluorescent protein (EGFP) expression through the scalp with a stereo fluorescence microscope and identifying the pups with EGFP around Actx. As a technical limitation for in utero electroporation, the expression pattern of exogenous genes inevitably varied across animals. For the quantitative analyses, we carefully selected the brains with EGFP expression focused on the center of Actx.
Figure 1.

Labeling of corticofugal projections by in utero electroporation. (A) EGFP expression plasmid was injected into the lateral ventricle of the embryonic brain and electroporated at E12.5. The uterine horns were replaced, and the dam was allowed to recover and give birth normally. (B–F) EGFP immunohistochemistry on the electroporated brain in juvenile (P40). (B) EGFP is expressed in the Actx neurons and their axonal projections in the corticofugal targets. Sections were counterstained with DAPI (blue). (C) EGFP+ CT projections are distributed throughout the MGB with a slight bias toward the MGBd/MGBv border (arrowhead). (D) CC projections are found in the dorsal and external cortex of the IC and far less in the central nucleus. (E and F) Sparse corticobulbar projections are also detected in the superior olivary complex in the vicinity of the lateral superior olive (E) and dorsal cochlear nucleus (F). Scale bars: 500 μm.
In Situ Hybridization and Immunohistochemistry
In situ hybridization for EphA7 (1014 bp rat partial clone) and ephrin-A5 (rat full-length clone) on cryosections was performed as described previously (Torii and Levitt 2005). For EGFP immunohistochemistry, brains were fixed with 4% paraformaldehyde (PFA) overnight, and 75 μm vibratome slices were collected. Slices were incubated with polyclonal anti-GFP antibody (1:1000; Invitrogen), followed by incubation with horseradish peroxidase-conjugated secondary antibody (1:1000; Jackson Immunoresearch) and TSA Plus Fluorescence System (PerkinElmer). For VGLUT1/EGFP double immunohistochemistry, we used Image-iT FX signal enhancer (Invitrogen) to block nonspecific binding of antibodies on myelin. VGLUT1 expression was visualized prior to EGFP immunohistochemistry, using the primary polyclonal anti-VGLUT1 antibody (1:5000; Synaptic Systems) and Alexa Fluor 568–conjugated secondary antibody (1:500; Jackson Immunoresearch). Sections were nuclear counterstained with 4′,6-diamidino-2-phenylindole (DAPI) (Invitrogen) when necessary. All images were captured using a confocal LSM 510 NLO system or an Axioplan2 microscope (Carl Zeiss) equipped with epifluorescence. Ligand-binding and receptor-binding histochemistry on cryosections were performed using recombinant human ephrin-A5-Fc and mouse EphA7-Fc chimeric protein (R&D Systems), respectively. Analysis was restricted to the hemisphere ipsilateral to the electroporation site.
Axonal Tracing
After fixation in 4% PFA, the brain was sectioned in the coronal plane from caudal to rostral until the MGB was visible. A small crystal of DiI (Molecular Probes) was inserted with a fine needle into the MGBv. After storage in fixative for about 2 weeks in the dark at 37 °C, 75 μm coronal vibratome slices were collected, followed by EGFP immunohistochemistry. Relative labeling intensities of DiI in CT and thalamocortical axons varied among brains. We selected the 2 brains out of 4 total cases with the greatest amount of thalamocortical DiI labeling. CT labeling could be clearly distinguished from thalamocortical axon labeling by the strong retrograde labeling in cell bodies (as well as apical and basal dendrites of layer VI neurons) coextensive with high EGFP levels in the electroporated domain of Actx.
In Vivo Neurophysiology
Juvenile mice (4–6 weeks) were brought to a surgical plane of anesthesia using a combination of pentobarbital sodium (50 mg/kg followed by 10–15 mg/kg supplements as needed) and chlorprothixene (0.2 mg). Following removal of the cranium and soft tissue, the cortical surface was visualized with a stereo fluorescence microscope, which enabled us to determine whether the EGFP+ domain did or did not overlap with the Actx (“‘hit” N = 3 or “miss” N = 4, respectively). Neurophysiological recordings in electroporated mice were compared with unmanipulated age-matched control mice (N = 7).
MGB multiunit responses were recorded ipsilateral to the electroporated cortex with a 16-channel silicon probe (177 μm2 contact area, 50 μm intercontact separation; Neuronexus Technologies) inserted through the Actx approximately 15° off of the horizontal plane under stereotaxic guidance. In order to avoid recording from the dorsal division of the MGB, the probe was initially inserted lateral to the auditory core fields, approximately 3.5 mm caudal to bregma. The ventral edge of the MGBv was identified by documenting the most lateral cortical insertion site that yielded sound-evoked responses. Recordings were made 0.5 mm medial to this point, a position that reliably corresponded to the center of MGBv and the medial division of the MGB, as demonstrated recently (Barkat et al. 2011; Hackett et al. 2011) and confirmed by histologic reconstruction of electrolytic lesions in a subset of mice from this study (data not shown). Sound-evoked responses in MGB were characterized by presenting frequency-modulated sweeps (2.4–75 kHz logarithmic sweeps presented at 60 dB sound pressure level, 5 ms raised onset/offset ramps in which the start and end frequency were held constant during onset and offset gating, 600 ms intertrial interval, 20 repetitions) in upward and downward directions at a variety of speeds (30, 40, 60, 80, 100, and 120 octaves/s) via an electrostatic speaker (STAX) placed 12 cm from the contralateral ear.
Quantification of Histological Data
The Actx and MGB were identified based on the cytoarchitecture and other structural landmarks in reference to the adult and developing mouse brain atlases (Paxinos and Franklin 2001; Paxinos et al. 2007). Gradients of ephrin-A5-Fc binding and EphA7 in situ hybridization labeling within the Actx were characterized by quantifying pixel intensity profiles along the medial to lateral axis through the Actx using ImageJ. Grayscale images of in situ hybridization labeling visualized with conventional chromogenic stain were inverted prior to quantification, for better comparison with fluorescently visualized ephrin-A5-Fc binding. Similarly, gradients of EphA7-Fc and ephrin-A5 situ hybridization labeling within the MGB were quantified along the mediodorsal to ventrolateral axis through the MGB. The spatial distribution of EGFP+ cortical axons in ipsilateral brain nuclei was quantified as described previously (Torii and Levitt 2005). Briefly, coronal slices were collected (control- and EphA7-electroporated brains: N = 4 and 5 [P4], 6 and 5 [P12], and 4 and 5 [P40]) and immunolabeled for EGFP. Images were collected, and the MGB was divided into 30 spatial bins that spanned the dorsomedial-to-ventrolateral axis of the nucleus (Fig. 4F). The area occupied by EGFP+ axons in each bin was measured using ImageJ and normalized to the total area occupied by EGFP+ axons in the entire MGB to obtain the relative distribution along the designated axis through the nuclei. The slides were coded so that the investigator was blind to the electroporation condition. To quantify the distribution of EGFP+ projections within the IC (N = 5 each for control- and EphA7-electroporated brains), the area occupied by EGFP+ axons in the dorsal cortex, external cortex, and central nucleus was measured using ImageJ software in DAPI-stained coronal sections. The total labeling efficiency of CT and CC innervation was quantified by measuring the mean grayscale values of EGFP immunolabeling in the MGB and IC in each brain slice using ImageJ software. The correlation between the densities of EGFP+ neurons and DiI-labeled thalamocortical axons in the layer IV was analyzed in 2 sections from each brain. The area occupied by EGFP+ neurons and DiI-labeled thalamocortical axons was measured within equivalently sized spatial bins spanning the mediolateral axis of the Actx using ImageJ (N = 147 bins from 4 brain slices).
Figure 4.

Developmental change in CT innervation pattern is arrested by overexpression of EphA7. (A–D) EGFP immunohistochemistry at P4 (A and C) and P12 (B and D) in mice that receive control (A and B) or EphA7 (C and D) electroporation. Optical density of EGFP is calculated along a dorsomedial-to-ventrolateral trajectory (E) and divided into 30 equally sized bins (F), yielding the normalized CT innervation density across the MGB (G). (H–J) Normalized CT innervation densities (mean ± standard error of the mean) are compared between control- (blue) and EphA7-electroporated (red) brains at P4 (H), P12 (I), and P40 (J). MGBv/MGBd border region is indicated by the arrowhead in each panel. Asterisk and pound sign indicate P < 0.05 and P < 0.01 with an unpaired t-test, respectively.
Quantification of Neurophysiological Data
Sweep-evoked responses were quantified by dividing the peristimulus time histogram into 5 ms bins, identifying the modal response bin, and then defining the onset and offset of the response as the first and last contiguous 5 ms bin with a spike count ≥ 2 standard deviation above the spontaneous firing rate collected during the 100-ms period prior to stimulus onset. The spontaneous rate value subtracted from the response value, yielding the evoked firing rate. Selectivity for upward or downward frequency-modulated sweeps was calculated as (Rup − Rdown/Rup + Rdown), where R is the evoked firing rate for a particular combination of sweep direction and speed. The mean value across all sweep speeds was defined as the direction selectivity index.
Results
Corticofugal Axon Patterning Revealed by In Utero Gene Electroporation
As a first step, we used in utero electroporation–mediated gene transfer to transfect mouse Actx neurons with the EGFP expression plasmid and an empty control vector. Electroporation was carried out at E12.5, a period when the layer VI neurons are being generated from neural progenitor cells (Fig. 1A). When the tissue was examined at P40, we observed EGFP+ cell bodies distributed throughout the Actx, and their axon terminals clearly visible in the ipsilateral MGB (Fig. 1B). Closer inspection reveals CT terminals throughout the dorsal, ventral, and medial subdivisions of the MGB (Fig. 1C). However, innervation density appeared greatest in the dorsal division, particularly in the area surrounding the DDZ (white arrowhead in Fig. 1C).
EGFP+ axons were also found throughout the ipsilateral IC and auditory brainstem nuclei. In the IC, corticofugal axon density was greatest in the dorsal cortex and, to a lesser extent, the external cortex but was substantially lower in the central nucleus (Fig. 1D), similar to previous reports (Andersen, Snyder, et al. 1980; Winer and Prieto 2001). Ipsilateral corticobulbar projections were far weaker than CT or CC projections. Scattered cortical axons were noted in the dorsal aspect of the superior olivary complex (Fig. 1E) and within the dorsal cochlear nucleus (Fig. 1F), as noted previously in the rodent (Feliciano et al. 1995; Doucet et al. 2003; Schofield and Coomes 2005). Given the sparseness of EGFP+ corticobulbar projections, the remainder of this report will focus on CT and CC projections.
Expression of EphAs and Ephrin-As in the Developing Auditory System
The specific patterns of corticofugal axon innervation may be shaped by attractive or repulsive interactions between Eph receptors on the cortical axon and endogenous ephrin gradients in the targeted subcortical nuclei. To test this possibility, we analyzed the expression pattern of EphAs in the Actx (including primary and association areas) and ephrin-As in MGB at P4, when corticofugal axons are extensively growing into their targets (Fig. 2). Weak expression of EphAs was detected in deep cortical layers of the Actx, from which the corticofugal projections originate, with a slight medial-high to lateral-low gradient (Fig. 2A). Among the members of EphA family, EphA7 expression represents a fraction of the total variation in EphA receptor levels across the medial to lateral extent of the Actx (Fig. 2B,E).
Figure 2.
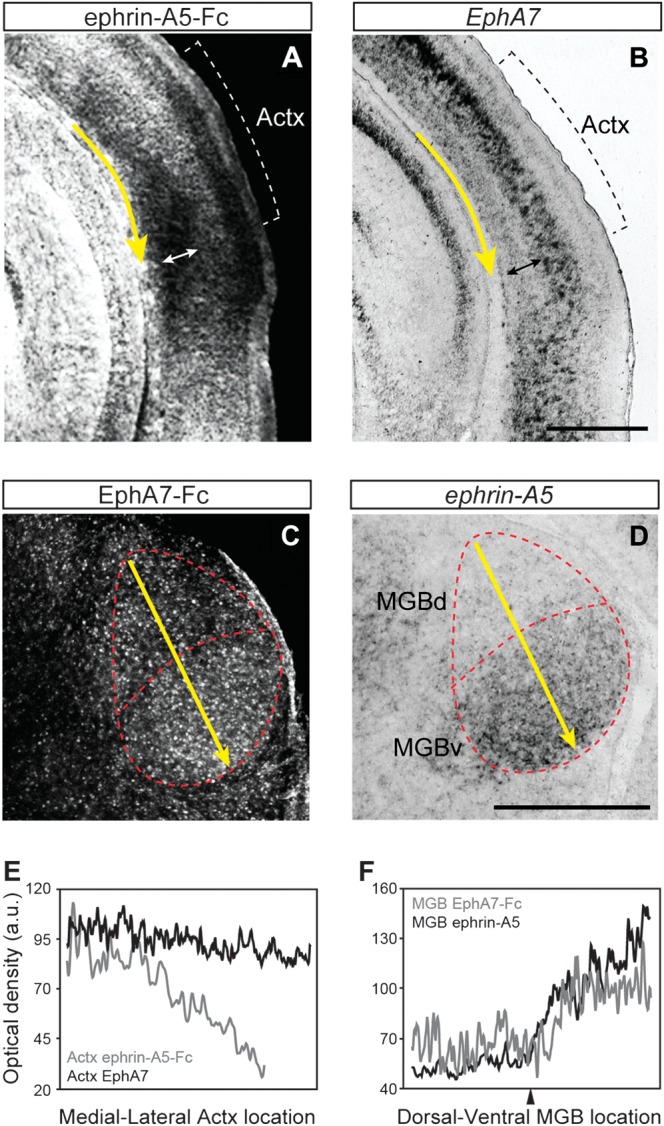
Expression of EphAs and ephrin-As in the postnatal auditory system. Protein expression of EphAs (A) and ephrin-As (C) was detected by the binding of ephrin-A5-Fc and EphA7-Fc chimeric proteins, respectively, at P4. Messenger RNA (mRNA) expression of EphA7 (B) and ephrin-A5 (D) was detected by in situ hybridization at P4. Expression of EphAs (A) and EphA7 (B) in deep layers (indicated by double-headed arrows) of the Actx is present but weaker than the surrounding cortical areas. Expression of ephrin-As (C) and ephrin-A5 (D) exhibits a dorsomedial-low to ventrolateral-high gradient in the MGB. (E and F) Gradients of grayscale values within the deep cortical layers along the medial–lateral axis in Actx (E) and dorsomedial–ventrolateral axis in MGB (F), as indicated by the yellow arrows in A–D. Note that grayscale values are inverted for mRNA expression levels (black lines in E and F). Arrowhead in F indicates a local minimums at the MGBd/MGBv border. Scale bars: 500 μm.
Expression of ephrin-As in the MGB showed a dorsomedial-to-ventrolateral low-to-high gradient (Fig. 2C), which was well represented by the expression of ephrin-A5 (Fig. 2D,F), one of the preferential ligands of EphA7 in the developing forebrain (Janis et al. 1999). Overall, the pattern of ephrin-A expression at P4 was roughly inverse to corticofugal axon densities measured at P40 (Fig. 1). CT innervation was higher in the dorsal division, particularly in the area centered on DDZ, where ephrin-A levels were lower (arrowhead, Fig. 2F). This observation agrees with prior reports from other brain areas that ephrin-As, particularly ephrin-A5, have a repulsive interaction with the EphA7 receptor (Holmberg et al. 2000; Yun et al. 2003) and further suggest that the nature of this interaction may represent a substrate for shaping corticofugal topography in the MGB.
Overexpression of EphA7 in the Actx Alters the Targeting of CT Projections
We directly tested the hypothesis that EphA-positive cortical axons are repelled by ephrin-As into correct target zones by investigating whether overexpressing EphA7 in the Actx would modify the normal patterns of CT topography. Specifically, we predicted that EphA7 overexpression would make cortical axons hypersensitive to the endogenous ephrin-A gradient, causing a surfeit of CT axons in the area surrounding the DDZ and a paucity of CT axons in more ventral areas of the MGB. These experiments were conducted identically to those described in Figure 1, except that the EphA7 expression plasmid was transferred along with the EGFP expression plasmid into the Actx at E12.5.
We first confirmed that transfecting embryonic cortical neurons with EphA7 expression plasmid dramatically increased levels of cortical EphA expression (Fig. 3A) beyond endogenous levels (Fig. 2A). Throughout the EphA7-electroporated Actx, we observed strong columnar segregation of EGFP+ and EGFP− cells (Fig. 3B compare with Fig. 1B), as reported previously (Torii et al. 2009). Neither structural abnormalities, such as altered cell packing or disrupted layer formation, nor abnormalities in proliferation, cell cycling, and cell death were observed in the Actx in association with this columnar segregation (Torii et al. 2009). As predicted, we observed an abnormally strong accumulation of EGFP+ CT axons in the area surrounding the DDZ at the expense of CT innervation at more dorsal and ventral areas within the MGB (Fig. 3B,C compare with Fig. 1B,C). Shifts in CT innervation were consistent with the contact-dependent repulsive function of EphA/ephrin-A signaling, given that the gradient of ephrin-A expression is lowest in the area around the DDZ (Fig. 2C).
Figure 3.

Overexpression of EphA7 in the Actx shifts CT projections to the MGBd/MGBv border. (A) EphA7 electroporation dramatically increases level of EphA protein expression as evidenced by binding of ephrin-A5-Fc chimeric protein within Actx at P4. (B and C) EGFP immunohistochemistry at P40 on the brains that received EphA7 electroporation in the Actx at E12.5. The section in B was counterstained with DAPI (blue). Accumulation of EphA7-overexpressing CT projections is evident around the MGD/MGV border region (arrowheads). Scale bars: 500 μm.
The CT innervation patterns in control and experimental brains were examined over the course of postnatal development to understand how each arises. We compared CT axon targeting observed at P40 with that obtained at P4, an age when patterned activity within the auditory pathways are intrinsically generated (Tritsch et al. 2010), and at P12, a time point coinciding with the onset of hearing and the beginning of a critical period for experience-dependent plasticity in auditory thalamocortical connectivity in the mouse (Barkat et al. 2011). To our surprise, we found that the innervation patterns at P4 were qualitatively similar for control- and EphA7-electroporated brains, with the majority of CT innervation restricted to the area surrounding the DDZ (Fig. 4A,C). By P12, however, the pattern of CT innervation in control cases was qualitatively changed from the pattern at P4 and similar to that observed at P40, with the bulk of CT innervation in the area surrounding the DDZ and weaker projections to MGBv (Fig. 4B). The CT innervation pattern at P12 in EphA7-electroporated brains, by contrast, did not appear different from that observed at P4 (Fig. 4D) or P40 (Fig. 3C).
We quantified CT innervation patterns by analyzing the relative distribution of EGFP+ axon densities along a dorsomedial-to-ventrolateral trajectory in the MGB (Fig. 4E). This was accomplished by dividing the MGB into 30 equally spaced bins (Fig. 4F) and then plotting the optical density within each bin, with MGBd bins on the left side of the abscissa and MGBv bins on the right (Fig. 4G). We observed statistically significant interactions between electroporation condition and CT innervation pattern at all ages (mixed design analysis of variance [ANOVA] group × location interaction term: P4, F = 2.42, P < 0.001; P12, F = 4.48, P < 0.001; P40, F = 4.3, P < 0.001). At P4, this effect amounted to a comparatively subtle reallocation of CT projections straddling the DDZ (Fig. 4H). At P12 and P40, the distribution of CT axons in EphA7-overexpressing mice was altered such that CT axons were concentrated on the area surrounding the DDZ compared with the core of MGBd (Fig. 4I) and/or MGBv (Fig. 4I,J). Differences in the total labeling efficiency of CT innervation, measured by the mean grayscale values of EGFP labeling in the MGB, were not observed between electroporation conditions (unpaired t-test, P = 0.93, 0.96, and 0.20 for P4, P12, and P40, respectively).
Functional Consequences of EphA7 Overexpression
For our next set of experiments, we wished to characterize some functional consequences of CT depletion within ventral regions of the MGB. As understanding the sign of physiological changes (i.e., enhancement or reduction of spiking activity) within the MGB depends critically upon whether or not CT axons provide direct excitatory or inhibitory input, we confirmed that control-electroporated cortical axons were glutamatergic. We compared EGFP expression with VGLUT1, which is known to be expressed at high levels within deep layers of the rodent cerebral cortex (Fremeau et al. 2001; Fujiyama et al. 2001) and has been colocalized to axon terminals that form asymmetric synapses onto thalamic neurons (Kaneko and Fujiyama 2002; Fujiyama et al. 2003). By taking advantage of specific labeling of corticofugal projections in the electroporated brains, we were able to colocalize EGFP+ CT axons with immunohistochemically identified VGLUT1 protein puncta in MGB.
Compared with the topographic distribution of CT projections in juvenile mice, VGLUT1 expression was more uniform throughout MGB (Supplementary Fig. 1A,A′). VGLUT1+ puncta appeared to be identified within most EGFP+ axons in MGBd (Supplementary Fig. 1B,B′) and MGBv (Supplementary Fig. 1C,C′). VGLUT1 immmunoreactivity found outside of EGFP+ terminals is presumably colocalized with synaptic terminals outside of the electroporation zone.
Given that CT axons are likely glutamatergic and that overexpression of EphA7 redirects cortical axons away from the ventral aspects of MGB (Fig. 4J), we predicted that spiking activity would be reduced within ventral regions of MGB in EphA7-electroporated mice. We tested this hypothesis by making in vivo multiunit recordings from ventral regions of the MGB with multichannel silicon probes as described previously (Hackett et al. 2011). We compared recordings from naïve control mice (N = 209 recording sites) to mice where EphA7 electroporation overlapped with the Actx (EphA7-hit, N = 87 recording sites) or missed it altogether, transfecting neighboring cortical regions instead (EphA7-miss, N = 95 recording sites).
Sound-evoked responses within MGB were assessed using frequency-modulated sweeps that varied according to their direction (upward sweep vs. downward sweep) and speed (30–120 octaves/s). MGB recording sites were well driven by frequency-modulated sweeps, often responding to stimuli at all directions and speeds with phasic bursts of action potentials that varied in their timing according to when the sweep crossed through their presumptive excitatory receptive field (Fig. 5A). Sweep-evoked firing rates averaged across all directions and speeds did not vary between control, EphA7-hit, and EphA7-miss recordings (ANOVA, F = 0.3, P = 0.74; Fig. 5B). MGB neurons exhibited very little preference for upward versus downward sweeps overall, and their direction preference did not vary according to control, EphA7-hit, or EphA7-miss conditions (ANOVA, F = 1.65, P = 0.19; Fig. 5C). However, we found that spontaneous firing rates were significantly lower for EphA7-hit recordings (ANOVA, F = 4.53, P < 0.05; Fig. 5D) than that observed in control (unpaired t-test, P < 0.005) or EphA7-miss (unpaired t-test, P < 0.005) recordings. Therefore, depletion of glutamatergic CT input reduces baseline activity levels within ventral regions of the MGB, while stimulus-evoked firing rates, which are likely to be dominated by bottom-up collicular inputs under anesthesia, were unaffected by changes in corticofugal innervation patterns.
Figure 5.

EphA7 overexpression is associated with reduced spontaneous multiunit activity, but not sensory-evoked responsiveness, in de-efferented regions of the MGB. Recordings were made from MGBv in controls as well as mice in which EphA7 electroporation hit or missed the Actx (indicated as EphA7-hit and EphA7-miss, respectively). (A) Rastergrams depict firing rate (FR) changes evoked by frequency-modulated sweeps that varied according to their direction (upward = positive, downward = negative) and speed. Spectrograms on the right depict an upward sweep at 80 octaves/s and a downward sweep at 40 octaves/s. (B) Actx EphA7 levels do not affect mean sweep-evoked firing rate. (C) Histograms depict the lack of direction preference overall and the absence of differences in direction preference across the sample of multiunits recorded in control (gray bars), EphA7-hit (black bars), or EphA7-mss (open bars). (D) Spontaneous firing rate was significantly lower in EphA7-hit compared with either control or EphA7-miss recordings. Asterisk indicates P < 0.005 with an unpaired t-test. Bar plots in B and D represent mean ± standard error of the mean.
Auditory Thalamocortical Projections Are Not Affected by Increased Expression of EphA7 in the Actx
As a next step, we asked whether EphA7 overexpression in the Actx also altered the gross innervation pattern of thalamocortical axons, which form a reciprocal circuit with CT projections. To test this, we injected a small crystal of DiI into the MGBv of the EphA7-electroporated brains fixed at P40 (Fig. 6A,A′). Anterograde labeling of thalamocortical axons showed their normal specific targeting into the middle and deep layers of the Actx (Fig. 6B,B′), and no apparent correlation was observed in the branching pattern of labeled thalamocortical axons and the domains of EphA7 overexpression in the Actx (Fig. 6C,D). These results are consistent with our previous report that the thalamocortical projections appear normal in the brains in which EphA7 is overexpressed despite clear topographic shifts in CT projections, although we cannot exclude the possibility of more subtle changes in thalamocortical axon targeting, which may be undetectable by DiI labeling method (Torii and Levitt 2005).
Figure 6.

EphA7 overexpression does not alter gross thalamocortical connectivity. (A and A′) The site of DiI injection to label thalamocortical projections was confirmed as a small hole in the MGBv (arrowheads) at the center of relatively darker labeled region. A′ is the grayscale image of nuclear counterstaining with DAPI (blue in A). (B and C′) Anterogradely labeled thalamocortical projections show grossly normal distribution in the layer VI (arrows) and layer IV (arrowheads) of the Actx in EphA7-electroporated brains. C and C′) are higher magnification views of the boxed area in B and B′. B′ and C′ are single channel images of the red channel in B and C. (D) Scatter plot showing the relationship between the densities of EGFP+ neurons and DiI-labeled thalamocortical axons in the layer IV of the Actx in EphA7-electroporated brains. No correlation was found between them (Pearson correlation product, R = −0.15, P = 0.08). Scale bars: 500 μm.
Overexpression of EphA7 in the Actx Alters the Targeting of CC Projections
Our initial characterization of corticofugal connections in control-electroporated mice revealed substantial Actx projections to deep zones within the dorsal cortex of the IC, moderate input to the external cortex, and comparatively weak input to the central nucleus (Fig. 1D). We addressed the possibility that elevating levels of EphA7 in the Actx might also shift CC connections by comparing the IC of control- and EphA7-electoporated mice (Fig. 7). Compared with control cases (Fig. 7A,B), EphA7 overexpression qualitatively shifted the relative distribution of cortical axons away from the dorsal cortex and toward the external cortex (Fig. 7C,D).
Figure 7.

Overexpression of EphA7 alters targeting of CC projections. (A–D) EGFP immunohistochemistry at P40 on the IC of the brains that received control (A and B) and EphA7 (C and D) electroporation in the Actx at E12.5. A–D correspond to 4 different brains. Scale bar: 500 μm. (E) Gradients of ephrin-As in the IC are revealed by staining for EphA7-Fc chimeric protein binding at P4. (F) Quantification of the relative distribution of EGFP+ axons in the dorsal cortex (blue), external cortex (red), and central nucleus (yellow). Bars represent mean ± standard error of the mean. Asterisks indicate P < 0.01 with an unpaired t-test comparing EphA7 with control.
Much like the MGB, the gradient of endogenous ephrin-A expression was roughly inverse to overall CC innervation density and predictive of where axons would shift upon EphA7 overexpression. Qualitatively, ephrin-As were observed to be lowest in the external cortex and higher levels found throughout the superficial regions of the dorsal cortex as well as the lateral boundary of the central nucleus (Fig. 7E). A quantitative comparison of the relative innervation density within each subdivision of the IC confirmed that Actx axons shifted away from the dorsal cortex, where ephrin-A expression is normally highest (control- vs. EphA7-electroporated, unpaired t-test, P < 0.01) and innervated the external cortex, where ephrin-A expression is normally lowest (control- vs. EphA7-electroporated, unpaired t-test, P < 0.01) (Fig. 7F). No difference was observed in the total labeling efficiency of CC innervation, measured by the mean grayscale values of EGFP labeling in the IC, between electroporation conditions (unpaired t-test, P = 0.70).
Discussion
These experiments provide evidence that the topographic positioning of corticofugal projections arising from neurons in deep layers of the Actx are shaped, at least in part, by EphA/ephrin-A signaling during early postnatal development. The topographic distribution of CT and CC projections observed using in utero electroporation in the mouse is roughly comparable to that observed with neuroanatomical tracer injections in well-characterized model systems, such as the rat and cat (Diamond et al. 1969; Andersen, Snyder, et al. 1980; Winer and Prieto 2001) (Diamond et al. 1969; Winer and Morest 1984; Rouiller and Welker 1991; Bajo et al. 1995; Bartlett et al. 2000; Hazama et al. 2004; Llano and Sherman 2008). In normative postnatal development, CT innervation is initially restricted to the DDZ. By the time of hearing onset, additional axons or axon collaterals have invaded regions dorsal and ventral to the DDZ, and this pattern is maintained when the mice were studied at P40. Overexpressing EphA7 in Actx forestalls the progressive developmental elaboration by preventing CT axon terminals from innervating surrounding areas of the MGBv or MGBd. EphA7 overexpression also modified CC axon targeting, again by shifting innervation away from areas with higher levels of ephrin-A expression (i.e., the central nucleus and dorsal aspect of the dorsal cortex) and toward regions with lower expression levels (i.e., the external cortex).
The altered connectivity in MGB and IC can likely be attributed to the fact that EphA7 overexpression exaggerates the repulsive interaction between EphA7 and ephrin-As, thereby rendering corticofugal fibers hypersensitive to levels of ephrin-As that would otherwise be too weak to drive away cortical axons expressing the normal complement of EphA7 receptors. Developmental changes in ephrin-A5 expression support this conclusion; at P4, the dorsal–ventral ephrin-A5 expression gradient within the MGB is far more pronounced than at P14 (Allen Development Mouse Brain Atlas, Seattle, WA: Allen Institute for Brain Science. Available from: http://developingmouse.brain-map.org, last accessed March 5, 2012). Accordingly, at P4, endogenous ephrin-A5 gradients would be sufficient to contain control- and EphA7-electroporated cortical axons within the area surrounding the DDZ (Fig. 4H). As the ephrin-A5 expression gradient within MGB begins to fade in later postnatal development, control-electroporated axons are able to expand their innervation zone to include areas surrounding the DDZ, while EphA7-electroporated Actx neurons retain sufficient repulsive sensitivity to the weakened ephrin-A5 expression levels and their CT projections remain fixed in the immature state (Fig. 4I,J).
While EphA7/eprhin-A interactions may be sufficient to explain targeting along the dorsomedial-to-ventrolateral axis in the MGB and some degree of targeting between different subdivisions of the IC, additional mechanisms for axon guidance must be invoked to explain the complete pattern of corticofugal connectivity in these nuclei. For instance, EphA7 overexpression did not appreciably alter the innervation pattern along the orthogonal axis in the MGB nor was “macroscopic” interareal targeting changed in either brain area; deep layer neurons continued to project through the subcortical telencephalon to innervate the modality-appropriate nucleus within the geniculate and colliculus. Similarly, overexpressing EphA7 in visual or somatosensory cortex was also observed to change the CT intraareal targeting while sparing the interareal targeting (Torii and Levitt 2005).
One possibility is that axon targeting specificity on other spatial scales or axes is conferred by the complementary family of Eph receptor kinases, the EphB class. EphB receptors predominantly bind to ephrin-Bs, rather than ephrin-As, although several examples of interclass interactions have been reported (Gale et al. 1996; Kullander and Klein 2002; Himanen et al. 2004). Experiments in the visual system have shown that mice-expressing mutations in ephrin-A expression exhibit altered cortical (Cang, Niell, et al. 2008) and geniculate (Cang, Wang, et al. 2008) retinotopic map topography along azimuth, but not elevation, whereas disruptions to EphB/ephrin-B expression interfere with retinogeniculate mapping along the elevation axis (Hindges et al. 2002; Mann et al. 2002). EphB/ephrin-B signaling plays a well-defined role in guiding auditory brainstem projections to the appropriate hemisphere (Cramer et al. 2002, 2006; Hsieh et al. 2010). It was recently reported that constitutive knockout of EphB2 and EphB3 was associated with delayed tone-evoked responses, broader frequency tuning, and elevated response thresholds in Actx (Intskirveli et al. 2011), although it remains to be seen how these functional changes might arise from EphB/ephrin-B-dependent changes in thalamocortical axon targeting.
Understanding the functional contributions made by the massive cortical feedback systems to brain function and behavior remains a significant challenge (George and Hawkins 2009; Sherman and Guillery 2011). In the auditory system, inactivation of Actx via photoablation (Bajo et al. 2010), pharmacological silencing (Riquimaroux et al. 1991; Zhang and Suga 1997; King et al. 2007; Bauerle et al. 2011), cooling (Ryugo and Weinberger 1976; Villa et al. 1991; Lomber and Malhotra 2008; Nakamoto et al. 2008; Antunes and Malmierca 2011), or microstimulation (Yan and Suga 1996) has been shown to rapidly, and often quite dramatically, remodel the receptive field properties of neurons in the MGB or IC and/or negatively impact auditory-dependent behaviors. Each approach introduces advantages and challenges related to the specificity and reversibility of the effect (Yamauchi et al. 2000; Liu et al. 2007; Bajo et al. 2010; Coomber et al. 2011). Our approach toward altering corticofugal innervation through in utero gene electroporation allowed us to selectively transfect Actx neurons but not afferent inputs invading the cortex. Moreover, by electroporating at E12.5 when neurons that comprise the deep layers of the cerebral cortex are being generated in the mouse, electroporated plasmid DNA will be progressively diluted in the successive waves of neural progenitor cell division and differentiation that populate more superficial layers of the cortex. Thus, overexpression will be greatest within deep layers of Actx, consistent with laminar differences we observed in EGFP expression (Figs 1B and 3B). Perhaps, most importantly, our approach allowed us to “de-efferent” restricted zones of the MGB and IC by simply shifting the position of CT innervation rather than directly interfering with the Actx.
Although previous studies have demonstrated substantive changes in MGB response properties following inactivation or electrical stimulation of Actx (Ryugo and Weinberger 1976; Villa et al. 1991; Zhang and Suga 2000; Bauerle et al. 2011; Coomber et al. 2011), the effects of de-efferenting the MGB on neurophysiological response properties with our approach were fairly subtle. Spontaneous activity was significantly reduced (Fig. 5), which may have resulted from reduced tonic excitation via glutamatergic CT inputs (Supplementary Fig. 1) or by destabilizing the balance of excitation and inhibition with the thalamic reticular nucleus (Yu et al. 2011). However, stimulus-evoked spike rates and auditory tuning specificity were not different from control mice. There may be several reasons why we did not observe any differences in sound-evoked activity from regions of the MGB that received reduced input from Actx: First, it is possible that CT input does not specifically play a role in modulating MGB stimulus representations; Second, in line with a recent finding from the mouse Actx (Trujillo et al. 2011), very few MGB recording sites in control animals revealed appreciable tuning for frequency-modulated sweep direction, which may introduce a “basement effect” for observing reductions in tuning specificity; Third, recordings were made under anesthesia, which is likely to disproportionately silence descending connections compared with ascending connections. In this case, it is likely that sweep-evoked responses in the MGB were primarily driven by bottom-up inputs from the IC; Fourth, unlike acute cortical inactivation, which may be able to rapidly silence a source of tonic modulation, mice in our study were continuously de-efferented. This raises the possibility that MGB receptive field properties normalized by the time the mice were tested as juveniles through developmental homeostatic plasticity mechanisms; Fifth, only a fraction of the Actx neurons were electroporated, thereby leaving ventral regions of the MGB innervated by an unknown number of spared CT fibers. Despite the caveats in interpreting the functional plasticity effects, these data clearly show the striking extent and specificity of CT and CC feedback connections in the mouse and identify EphA/ephrin-A signaling as a molecular mechanism responsible for defining some aspects of their topography in early development.
Supplementary Material
Supplementary material can be found at: http://www.cercor.oxfordjournals.org/
Funding
National Institutes of Health (grant DC009488 and DC009836 to D.B.P., DC04318 to T.A.H., NS014841 to P.R., and DA022785 to P.L.); NARSAD Young Investigator Award (to M.T.); and Kavli Institute for Neuroscience at Yale (to M.T. and P.R.).
Supplementary Material
Acknowledgments
We thank Barbara M. J. O’Brien, Shawna Rodriguez, and Mariamma J. Pappy for technical assistance. Conflict of Interest: None declared.
References
- Andersen RA, Knight PL, Merzenich MM. The thalamocortical and corticothalamic connections of AI, AII, and the anterior auditory field (AAF) in the cat: evidence for two largely segregated systems of connections. J Comp Neurol. 1980;194:663–701. doi: 10.1002/cne.901940312. [DOI] [PubMed] [Google Scholar]
- Andersen RA, Snyder RL, Merzenich MM. The topographic organization of corticocollicular projections from physiologically identified loci in the AI, AII, and anterior auditory cortical fields of the cat. J Comp Neurol. 1980;191:479–494. doi: 10.1002/cne.901910310. [DOI] [PubMed] [Google Scholar]
- Antunes FM, Malmierca MS. Effect of auditory cortex deactivation on stimulus-specific adaptation in the medial geniculate body. J Neurosci. 2011;31:17306–17316. doi: 10.1523/JNEUROSCI.1915-11.2011. [DOI] [PMC free article] [PubMed] [Google Scholar]
- Bajo VM, Nodal FR, Moore DR, King AJ. The descending corticocollicular pathway mediates learning-induced auditory plasticity. Nat Neurosci. 2010;13:253–260. doi: 10.1038/nn.2466. [DOI] [PMC free article] [PubMed] [Google Scholar]
- Bajo VM, Rouiller EM, Welker E, Clarke S, Villa AE, de Ribaupierre Y, de Ribaupierre F. Morphology and spatial distribution of corticothalamic terminals originating from the cat auditory cortex. Hear Res. 1995;83:161–174. doi: 10.1016/0378-5955(94)00199-z. [DOI] [PubMed] [Google Scholar]
- Barkat TR, Polley DB, Hensch TK. A critical period for auditory thalamocortical connectivity. Nat Neurosci. 2011;14:1189–1194. doi: 10.1038/nn.2882. [DOI] [PMC free article] [PubMed] [Google Scholar]
- Bartlett EL, Stark JM, Guillery RW, Smith PH. Comparison of the fine structure of cortical and collicular terminals in the rat medial geniculate body. Neuroscience. 2000;100:811–828. doi: 10.1016/s0306-4522(00)00340-7. [DOI] [PubMed] [Google Scholar]
- Bauerle P, von der Behrens W, Kossl M, Gaese BH. Stimulus-specific adaptation in the gerbil primary auditory thalamus is the result of a fast frequency-specific habituation and is regulated by the corticofugal system. J Neurosci. 2011;31:9708–9722. doi: 10.1523/JNEUROSCI.5814-10.2011. [DOI] [PMC free article] [PubMed] [Google Scholar]
- Cang J, Kaneko M, Yamada J, Woods G, Stryker MP, Feldheim DA. Ephrin-as guide the formation of functional maps in the visual cortex. Neuron. 2005;48:577–589. doi: 10.1016/j.neuron.2005.10.026. [DOI] [PMC free article] [PubMed] [Google Scholar]
- Cang J, Niell CM, Liu X, Pfeiffenberger C, Feldheim DA, Stryker MP. Selective disruption of one Cartesian axis of cortical maps and receptive fields by deficiency in ephrin-As and structured activity. Neuron. 2008;57:511–523. doi: 10.1016/j.neuron.2007.12.025. [DOI] [PMC free article] [PubMed] [Google Scholar]
- Cang J, Wang L, Stryker MP, Feldheim DA. Roles of ephrin-as and structured activity in the development of functional maps in the superior colliculus. J Neurosci. 2008;28:11015–11023. doi: 10.1523/JNEUROSCI.2478-08.2008. [DOI] [PMC free article] [PubMed] [Google Scholar]
- Coomber B, Edwards D, Jones SJ, Shackleton TM, Goldschmidt J, Wallace MN, Palmer AR. Cortical inactivation by cooling in small animals. Front Syst Neurosci. 2011;5:53. doi: 10.3389/fnsys.2011.00053. [DOI] [PMC free article] [PubMed] [Google Scholar]
- Cramer KS, Bermingham-McDonogh O, Krull CE, Rubel EW. EphA4 signaling promotes axon segregation in the developing auditory system. Dev Biol. 2004;269:26–35. doi: 10.1016/j.ydbio.2004.01.002. [DOI] [PubMed] [Google Scholar]
- Cramer KS, Cerretti DP, Siddiqui SA. EphB2 regulates axonal growth at the midline in the developing auditory brainstem. Dev Biol. 2006;295:76–89. doi: 10.1016/j.ydbio.2006.03.010. [DOI] [PubMed] [Google Scholar]
- Cramer KS, Karam SD, Bothwell M, Cerretti DP, Pasquale EB, Rubel EW. Expression of EphB receptors and EphrinB ligands in the developing chick auditory brainstem. J Comp Neurol. 2002;452:51–64. doi: 10.1002/cne.10399. [DOI] [PubMed] [Google Scholar]
- Cramer KS, Rosenberger MH, Frost DM, Cochran SL, Pasquale EB, Rubel EW. Developmental regulation of EphA4 expression in the chick auditory brainstem. J Comp Neurol. 2000;426:270–278. [PubMed] [Google Scholar]
- Diamond IT, Jones EG, Powell TP. The projection of the auditory cortex upon the diencephalon and brain stem in the cat. Brain Res. 1969;15:305–340. doi: 10.1016/0006-8993(69)90160-7. [DOI] [PubMed] [Google Scholar]
- Doucet JR, Molavi DL, Ryugo DK. The source of corticocollicular and corticobulbar projections in area Te1 of the rat. Exp Brain Res. 2003;153:461–466. doi: 10.1007/s00221-003-1604-4. [DOI] [PubMed] [Google Scholar]
- Drescher U, Kremoser C, Handwerker C, Loschinger J, Noda M, Bonhoeffer F. In vitro guidance of retinal ganglion cell axons by RAGS, a 25 kDa tectal protein related to ligands for Eph receptor tyrosine kinases. Cell. 1995;82:359–370. doi: 10.1016/0092-8674(95)90425-5. [DOI] [PubMed] [Google Scholar]
- Feliciano M, Saldana E, Mugnaini E. Direct projections from the rat primary auditory neocortex to nucleus sagulum, paralemniscal regions, superior olivary complex and cochlear nuclei. Aud Neurosci. 1995;1:287–308. [Google Scholar]
- Fremeau RT, Jr, Troyer MD, Pahner I, Nygaard GO, Tran CH, Reimer RJ, Bellocchio EE, Fortin D, Storm-Mathisen J, Edwards RH. The expression of vesicular glutamate transporters defines two classes of excitatory synapse. Neuron. 2001;31:247–260. doi: 10.1016/s0896-6273(01)00344-0. [DOI] [PubMed] [Google Scholar]
- Frisen J, Yates PA, McLaughlin T, Friedman GC, O'Leary DD, Barbacid M. Ephrin-A5 (AL-1/RAGS) is essential for proper retinal axon guidance and topographic mapping in the mammalian visual system. Neuron. 1998;20:235–243. doi: 10.1016/s0896-6273(00)80452-3. [DOI] [PubMed] [Google Scholar]
- Fujiyama F, Furuta T, Kaneko T. Immunocytochemical localization of candidates for vesicular glutamate transporters in the rat cerebral cortex. J Comp Neurol. 2001;435:379–387. doi: 10.1002/cne.1037. [DOI] [PubMed] [Google Scholar]
- Fujiyama F, Hioki H, Tomioka R, Taki K, Tamamaki N, Nomura S, Okamoto K, Kaneko T. Changes of immunocytochemical localization of vesicular glutamate transporters in the rat visual system after the retinofugal denervation. J Comp Neurol. 2003;465:234–249. doi: 10.1002/cne.10848. [DOI] [PubMed] [Google Scholar]
- Gabriele ML, Brubaker DQ, Chamberlain KA, Kross KM, Simpson NS, Kavianpour SM. EphA4 and ephrin-B2 expression patterns during inferior colliculus projection shaping prior to experience. Dev Neurobiol. 2011;71:182–199. doi: 10.1002/dneu.20842. [DOI] [PubMed] [Google Scholar]
- Gale NW, Holland SJ, Valenzuela DM, Flenniken A, Pan L, Ryan TE, Henkemeyer M, Strebhardt K, Hirai H, Wilkinson DG, et al. Eph receptors and ligands comprise two major specificity subclasses and are reciprocally compartmentalized during embryogenesis. Neuron. 1996;17:9–19. doi: 10.1016/s0896-6273(00)80276-7. [DOI] [PubMed] [Google Scholar]
- George D, Hawkins J. Towards a mathematical theory of cortical micro-circuits. PLoS Comput Biol. 2009;5:e1000532. doi: 10.1371/journal.pcbi.1000532. [DOI] [PMC free article] [PubMed] [Google Scholar]
- Hackett TA, Barkat TR, O'Brien BM, Hensch TK, Polley DB. Linking topography to tonotopy in the mouse auditory thalamocortical circuit. J Neurosci. 2011;31:2983–2995. doi: 10.1523/JNEUROSCI.5333-10.2011. [DOI] [PMC free article] [PubMed] [Google Scholar]
- Hazama M, Kimura A, Donishi T, Sakoda T, Tamai Y. Topography of corticothalamic projections from the auditory cortex of the rat. Neuroscience. 2004;124:655–667. doi: 10.1016/j.neuroscience.2003.12.027. [DOI] [PubMed] [Google Scholar]
- Himanen JP, Chumley MJ, Lackmann M, Li C, Barton WA, Jeffrey PD, Vearing C, Geleick D, Feldheim DA, Boyd AW, et al. Repelling class discrimination: ephrin-A5 binds to and activates EphB2 receptor signaling. Nat Neurosci. 2004;7:501–509. doi: 10.1038/nn1237. [DOI] [PubMed] [Google Scholar]
- Hindges R, McLaughlin T, Genoud N, Henkemeyer M, O'Leary DD. EphB forward signaling controls directional branch extension and arborization required for dorsal-ventral retinotopic mapping. Neuron. 2002;35:475–487. doi: 10.1016/s0896-6273(02)00799-7. [DOI] [PubMed] [Google Scholar]
- Holmberg J, Clarke DL, Frisen J. Regulation of repulsion versus adhesion by different splice forms of an Eph receptor. Nature. 2000;408:203–206. doi: 10.1038/35041577. [DOI] [PubMed] [Google Scholar]
- Hsieh CY, Nakamura PA, Luk SO, Miko IJ, Henkemeyer M, Cramer KS. Ephrin-B reverse signaling is required for formation of strictly contralateral auditory brainstem pathways. J Neurosci. 2010;30:9840–9849. doi: 10.1523/JNEUROSCI.0386-10.2010. [DOI] [PMC free article] [PubMed] [Google Scholar]
- Huffman KJ, Cramer KS. EphA4 misexpression alters tonotopic projections in the auditory brainstem. Dev Neurobiol. 2007;67:1655–1668. doi: 10.1002/dneu.20535. [DOI] [PubMed] [Google Scholar]
- Intskirveli I, Metherate R, Cramer KS. Null mutations in EphB receptors Decrease Sharpness of frequency tuning in primary auditory cortex. PLoS One. 2011;6:e26192. doi: 10.1371/journal.pone.0026192. [DOI] [PMC free article] [PubMed] [Google Scholar]
- Janis LS, Cassidy RM, Kromer LF. Ephrin-A binding and EphA receptor expression delineate the matrix compartment of the striatum. J Neurosci. 1999;19:4962–4971. doi: 10.1523/JNEUROSCI.19-12-04962.1999. [DOI] [PMC free article] [PubMed] [Google Scholar]
- Kaneko T, Fujiyama F. Complementary distribution of vesicular glutamate transporters in the central nervous system. Neurosci Res. 2002;42:243–250. doi: 10.1016/s0168-0102(02)00009-3. [DOI] [PubMed] [Google Scholar]
- King AJ, Bajo VM, Bizley JK, Campbell RA, Nodal FR, Schulz AL, Schnupp JW. Physiological and behavioral studies of spatial coding in the auditory cortex. Hear Res. 2007;229:106–115. doi: 10.1016/j.heares.2007.01.001. [DOI] [PMC free article] [PubMed] [Google Scholar]
- Kullander K, Klein R. Mechanisms and functions of Eph and ephrin signalling. Nat Rev Mol Cell Biol. 2002;3:475–486. doi: 10.1038/nrm856. [DOI] [PubMed] [Google Scholar]
- Leamey CA, Van Wart A, Sur M. Intrinsic patterning and experience-dependent mechanisms that generate eye-specific projections and binocular circuits in the visual pathway. Curr Opin Neurobiol. 2009;19:181–187. doi: 10.1016/j.conb.2009.05.006. [DOI] [PubMed] [Google Scholar]
- Li H, Crair MC. How do barrels form in somatosensory cortex? Ann N Y Acad Sci. 2011;1225:119–129. doi: 10.1111/j.1749-6632.2011.06024.x. [DOI] [PMC free article] [PubMed] [Google Scholar]
- Liu BH, Wu GK, Arbuckle R, Tao HW, Zhang LI. Defining cortical frequency tuning with recurrent excitatory circuitry. Nat Neurosci. 2007;10:1594–1600. doi: 10.1038/nn2012. [DOI] [PMC free article] [PubMed] [Google Scholar]
- Llano DA, Sherman SM. Evidence for nonreciprocal organization of the mouse auditory thalamocortical-corticothalamic projection systems. J Comp Neurol. 2008;507:1209–1227. doi: 10.1002/cne.21602. [DOI] [PubMed] [Google Scholar]
- Lomber SG, Malhotra S. Double dissociation of ‘what' and ‘where' processing in auditory cortex. Nat Neurosci. 2008;11:609–616. doi: 10.1038/nn.2108. [DOI] [PubMed] [Google Scholar]
- Mann F, Ray S, Harris W, Holt C. Topographic mapping in dorsoventral axis of the Xenopus retinotectal system depends on signaling through ephrin-B ligands. Neuron. 2002;35:461–473. doi: 10.1016/s0896-6273(02)00786-9. [DOI] [PubMed] [Google Scholar]
- Nakamoto KT, Jones SJ, Palmer AR. Descending projections from auditory cortex modulate sensitivity in the midbrain to cues for spatial position. J Neurophysiol. 2008;99:2347–2356. doi: 10.1152/jn.01326.2007. [DOI] [PubMed] [Google Scholar]
- Ojima H. Terminal morphology and distribution of corticothalamic fibers originating from layers 5 and 6 of cat primary auditory cortex. Cereb Cortex. 1994;4:646–663. doi: 10.1093/cercor/4.6.646. [DOI] [PubMed] [Google Scholar]
- Paxinos G, Franklin KJ. The mouse brain in stereotaxic coordinates. San Diego (CA): Academic Press; 2001. [Google Scholar]
- Paxinos G, Koutcherov Y, Wang H, Halliday GM, Watson C. Atlas of the developing mouse brain. London: Elsevier; 2007. [Google Scholar]
- Ramon y, Cajal S. Histologie du systéme nerveux de l'homme et des vertébrés. Paris (France): Maloine; 1911. [Google Scholar]
- Riquimaroux H, Gaioni SJ, Suga N. Cortical computational maps control auditory perception. Science. 1991;251:565–568. doi: 10.1126/science.1990432. [DOI] [PubMed] [Google Scholar]
- Rouiller EM, Welker E. Morphology of corticothalamic terminals arising from the auditory cortex of the rat: a Phaseolus vulgaris-leucoagglutinin (PHA-L) tracing study. Hear Res. 1991;56:179–190. doi: 10.1016/0378-5955(91)90168-9. [DOI] [PubMed] [Google Scholar]
- Ryugo DK, Weinberger NM. Corticofugal modulation of the medial geniculate body. Exp Neurol. 1976;51:377–391. doi: 10.1016/0014-4886(76)90262-4. [DOI] [PubMed] [Google Scholar]
- Saito T, Nakatsuji N. Efficient gene transfer into the embryonic mouse brain using in vivo electroporation. Dev Biol. 2001;240:237–246. doi: 10.1006/dbio.2001.0439. [DOI] [PubMed] [Google Scholar]
- Schofield BR, Coomes DL. Auditory cortical projections to the cochlear nucleus in guinea pigs. Hear Res. 2005;199:89–102. doi: 10.1016/j.heares.2004.08.003. [DOI] [PubMed] [Google Scholar]
- Sestan N, Rakic P, Donoghue MJ. Independent parcellation of the embryonic visual cortex and thalamus revealed by combinatorial Eph/ephrin gene expression. Curr Biol. 2001;11:39–43. doi: 10.1016/s0960-9822(00)00043-9. [DOI] [PubMed] [Google Scholar]
- Sherman SM, Guillery RW. Distinct functions for direct and transthalamic corticocortical connections. J Neurophysiol. 2011;106:1068–1077. doi: 10.1152/jn.00429.2011. [DOI] [PubMed] [Google Scholar]
- Tabata H, Nakajima K. Efficient in utero gene transfer system to the developing mouse brain using electroporation: visualization of neuronal migration in the developing cortex. Neuroscience. 2001;103:865–872. doi: 10.1016/s0306-4522(01)00016-1. [DOI] [PubMed] [Google Scholar]
- Torii M, Hashimoto-Torii K, Levitt P, Rakic P. Integration of neuronal clones in the radial cortical columns by EphA and ephrin-A signalling. Nature. 2009;461:524–528. doi: 10.1038/nature08362. [DOI] [PMC free article] [PubMed] [Google Scholar]
- Torii M, Levitt P. Dissociation of corticothalamic and thalamocortical axon targeting by an EphA7-mediated mechanism. Neuron. 2005;48:563–575. doi: 10.1016/j.neuron.2005.09.021. [DOI] [PubMed] [Google Scholar]
- Tritsch NX, Rodriguez-Contreras A, Crins TT, Wang HC, Borst JG, Bergles DE. Calcium action potentials in hair cells pattern auditory neuron activity before hearing onset. Nat Neurosci. 2010;13:1050–1052. doi: 10.1038/nn.2604. [DOI] [PMC free article] [PubMed] [Google Scholar]
- Trujillo M, Measor K, Carrasco MM, Razak KA. Selectivity for the rate of frequency modulated sweeps in the mouse auditory cortex. J Neurophysiol. 2011;106:2825–2837. doi: 10.1152/jn.00480.2011. [DOI] [PubMed] [Google Scholar]
- Uziel D, Muhlfriedel S, Zarbalis K, Wurst W, Levitt P, Bolz J. Miswiring of limbic thalamocortical projections in the absence of ephrin-A5. J Neurosci. 2002;22:9352–9357. doi: 10.1523/JNEUROSCI.22-21-09352.2002. [DOI] [PMC free article] [PubMed] [Google Scholar]
- Vanderhaeghen P, Lu Q, Prakash N, Frisen J, Walsh CA, Frostig RD, Flanagan JG. A mapping label required for normal scale of body representation in the cortex. Nat Neurosci. 2000;3:358–365. doi: 10.1038/73929. [DOI] [PubMed] [Google Scholar]
- Villa AE, Rouiller EM, Simm GM, Zurita P, de Ribaupierre Y, de Ribaupierre F. Corticofugal modulation of the information processing in the auditory thalamus of the cat. Exp Brain Res. 1991;86:506–517. doi: 10.1007/BF00230524. [DOI] [PubMed] [Google Scholar]
- Winer JA. Decoding the auditory corticofugal systems. Hear Res. 2005;207:1–9. doi: 10.1016/j.heares.2005.06.007. [DOI] [PubMed] [Google Scholar]
- Winer JA, Larue DT. Patterns of reciprocity in auditory thalamocortical and corticothalamic connections: study with horseradish peroxidase and autoradiographic methods in the rat medial geniculate body. J Comp Neurol. 1987;257:282–315. doi: 10.1002/cne.902570212. [DOI] [PubMed] [Google Scholar]
- Winer JA, Morest DK. Axons of the dorsal division of the medial geniculate body of the cat: a study with the rapid Golgi method. J Comp Neurol. 1984;224:344–370. doi: 10.1002/cne.902240304. [DOI] [PubMed] [Google Scholar]
- Winer JA, Prieto JJ. Layer V in cat primary auditory cortex (AI): cellular architecture and identification of projection neurons. J Comp Neurol. 2001;434:379–412. doi: 10.1002/cne.1183. [DOI] [PubMed] [Google Scholar]
- Yamauchi T, Hori T, Takahashi T. Presynaptic inhibition by muscimol through GABAB receptors. Eur J Neurosci. 2000;12:3433–3436. doi: 10.1046/j.1460-9568.2000.00248.x. [DOI] [PubMed] [Google Scholar]
- Yan J, Suga N. Corticofugal modulation of time-domain processing of biosonar information in bats. Science. 1996;273:1100–1103. doi: 10.1126/science.273.5278.1100. [DOI] [PubMed] [Google Scholar]
- Yu XJ, Meng XK, Xu XX, He J. Individual auditory thalamic reticular neurons have large and cross-modal sources of cortical and thalamic inputs. Neuroscience. 2011;193:122–131. doi: 10.1016/j.neuroscience.2011.07.040. [DOI] [PubMed] [Google Scholar]
- Yun ME, Johnson RR, Antic A, Donoghue MJ. EphA family gene expression in the developing mouse neocortex: regional patterns reveal intrinsic programs and extrinsic influence. J Comp Neurol. 2003;456:203–216. doi: 10.1002/cne.10498. [DOI] [PubMed] [Google Scholar]
- Zhang Y, Suga N. Corticofugal amplification of subcortical responses to single tone stimuli in the mustached bat. J Neurophysiol. 1997;78:3489–3492. doi: 10.1152/jn.1997.78.6.3489. [DOI] [PubMed] [Google Scholar]
- Zhang Y, Suga N. Modulation of responses and frequency tuning of thalamic and collicular neurons by cortical activation in mustached bats. J Neurophysiol. 2000;84:325–333. doi: 10.1152/jn.2000.84.1.325. [DOI] [PubMed] [Google Scholar]
Associated Data
This section collects any data citations, data availability statements, or supplementary materials included in this article.