

Abstract
Traditional models of ictal propagation involve the concept of an initiation site and a progressive outward march of activation. The process of neurovascular coupling, whereby the brain supplies oxygenated blood to metabolically active neurons presumably results in a similar outward cascade of hyperemia. However, ictal neurovascular coupling has never been assessed in vivo using simultaneous measurements of membrane potential change and hyperemia with wide spatial sampling. In an acute rat ictal model, using simultaneous intrinsic optical signal (IOS) and voltage-sensitive dye (VSD) imaging of cerebral blood volume and membrane potential changes, we demonstrate that seizures consist of multiple dynamic multidirectional waves of membrane potential change with variable onset sites that spread through a widespread network. Local blood volume evolves on a much slower spatiotemporal scale. At seizure onset, the VSD waves extend beyond the IOS signal. During evolution, spatial correlation with hemodynamic signal only exists briefly at the maximal spread of the VSD signal. At termination, the IOS signal extends spatially and temporally beyond the VSD waves. Hence, vascular reactivity evolves in a separate but parallel fashion to membrane potential changes resulting in a mechanism of neurovascular coupling and uncoupling, which is as dynamic as the seizure itself.
Keywords: cerebral blood volume, epilepsy, neurovascular coupling, optical imaging, voltage-sensitive dye
Introduction
Epilepsy is a disease process characterized by recurrent seizures or “ictal” events. In general, seizures evolve through 3 stages—initiation, propagation, and termination, each of which is governed by separate mechanisms (Timofeev and Steriade 2004; Pinto et al. 2005). Traditional models of neocortical partial seizure initiation and propagation are characterized by a “Jacksonian” march, as seizures spread from a site of initiation and cascade outward to more distant areas (Jackson 1958). In vitro slice data also demonstrate progressive seizure propagation in a saltatory “modular” pattern with various velocities and periodicities (Chervin et al. 1988; Wadman and Gutnick 1993; Trevelyan et al. 2006). Likewise, in vivo human intracranial subdural grid recordings as well as arrays of electrodes or voltage-sensitive dye (VSD) imaging of in vitro animal models exhibit radial step-by-step propagation (Albowitz et al. 1990; Spencer et al. 1992; Sutor et al. 1994; Albowitz and Kuhnt 1995; Pacia and Ebersole 1997; Yuste et al. 1997; Kutsy et al. 1999; Pinto et al. 2005).
In spite of this prevailing “propagation” model, evidence also exists for the inadequacy of this paradigm. Using calcium imaging in a low-magnesium slice model, Trevelyan et al. (2006) reported that the subthreshold activity of all sampled neurons was recruited from the earliest time point in the evolution of the event. Intracranial recordings have also revealed widespread activation as well as high-frequency activity, signal energy, and synchrony at seizure onset, far beyond the presumed ictal onset zone (Grenier et al. 2003; Wendling et al. 2003; Kramer et al. 2010). These studies imply that ictal onset may not be a focal event but may involve widespread cortical networks.
Another poorly understood mechanism in ictal evolution is the spatiotemporal dynamics of neurovascular coupling, the process of “functional hyperemia,” whereby cerebral blood vessels dilate to provide oxygenated blood to metabolically active neurons (Lauritzen and Gold 2003; Logothetis 2003). Early studies used autoradiography, inert gas clearance, or laser Doppler, which suffer from poor spatial and temporal resolution and sampling (Ingvar et al. 1984; Pinard et al. 1984; Tanaka et al. 1990; Kreisman et al. 1991; Pereira de Vasconcelos et al. 2002; Nersesyan et al. 2004; Zhao et al. 2009). Other studies have used intrinsic optical signal (IOS) mapping of cerebral blood volume (CBV) (Bahar et al. 2006; Zhao et al. 2009) or functional magnetic resonance imaging mapping of blood oxygen level–dependent (BOLD) signals derived from CBV and hemoglobin oxygenation (Salek-Haddadi et al. 2002; Kobayashi et al. 2006; Donaire et al. 2009; Tyvaert et al. 2009; Thornton et al. 2010) without adequate high sampling and mapping of the underlying electrophysiologic activity to examine neurovascular coupling.
In order to precisely characterize and understand the spatiotemporal dynamics of the coupling between neuronal activity and hemodynamic response as seizures evolve, we simultaneously recorded VSD and IOS data to measure neurovascular coupling between membrane potential changes and CBV in vivo in a rat model of partial onset neocortical ictal events using focal injection of 4-aminopyridine (4-AP), a potassium channel blocker (Szente and Baranyi 1987).
Materials and Methods
Animal Preparation
All experimental procedures were approved by the Weill Cornell Medical College Animal Care and Use Committee following National Institutes of Health guidelines. Adult male Sprague–Dawley rats (250–380 g) were anesthetized with isoflurane in 70% N2:30% O2, 4% induction, and 1.5–2% maintenance. Body temperature was maintained at 37 °C with a regulated heating blanket (Harvard Apparatus, Holliston, MA). The heart rate, pO2, and the end tail CO2 (ETCO2) were carefully monitored with a small animal Capnograph (Surgivet, Waukesha, WI) and were maintained stable throughout the experiment (heart rate: 250–300 pulse/minute, pO2 > 90%, ETCO2 ∼ 25–28 mmHg). The head was fixed in a stereotaxic frame. A cranial window of ∼5 × 8 mm was opened over the left hemisphere, between lambda and bregma, centered over somatosensory cortex. The dura was carefully removed. A temporary well was built around the craniotomy window with Vaseline oil. The VSD, RH-1691, or RH-1692 solution (1 mg/mL in 0.9% NaCl solution) was applied to the exposed cortex for ∼90 min. After staining, the cortex was washed with saline for ∼10 min to remove unbound dye, and the temporary well was removed. The exposed cortex was covered with silicon oil (12 500 centistoke) to keep the moisture of the cortex.
Ictal Model and Electrophysiology
Seizure-like discharges were induced by injecting 4-AP (Sigma, 15 mM, 0.5 μL) 300–500 μm into the cortex, through a glass microelectrode using a Nanoject II injector (Drummond Scientific, Broomall, PA). A second glass microelectrode (2–4 MΩ) filled with saline was positioned <0.5 mm from the 4-AP electrode to record the local field potential (LFP). The LFP was amplified and band-pass filtered (1–500 Hz) using a DAB-S system and digitized at 1000 Hz by a CED Power 1401. The LFP data were recorded with a PC running the Spike2 software (Cambridge Electronic Design, Cambridge, UK).
Optical Recording
We used a custom setup for simultaneous imaging of IOS and VSD signal (Fig. 1A). We performed IOS imaging at 546 nm, an isosbestic wavelength of hemoglobin to provide a measure of total hemoglobin (Hbt), which is equivalent to CBV if hematocrit remains constant and proportional to cerebral blood flow (CBF) (Sheth et al. 2004; Kennerley et al. 2005). This specific isosbestic wavelength, of which there are several, was chosen to minimize overlap with the VSD imaging. Likewise, we did not image at a wavelength sensitive to hemoglobin oxygenation since these wavelengths overlapped with the VSD signal and since interpretation of the signal at these wavelengths is controversial and are often contaminated by the CBV signal (Sirotin et al. 2009). The IOS images were captured with a monochrome video camera (Imager 3001, Optical Imaging, Rehovot, Israel), with a temporal resolution of 33 Hz, a spatial resolution of 248 × 160 pixels with each pixel sampling an area of 40 × 40 μm. The VSD images were captured with a MiCAM ULTIMA CMOS camera (SciMedia, Costa Mesa, CA). The camera has a temporal resolution of 1000 Hz and a spatial resolution of 100 × 100 pixels, with each pixel sampling an area of 50 × 50 μm. The MiCAM system has a limitation of 20 000 frames/trial, limiting our VSD recordings to 20 s/trial. In some experiments, the sampling frequency was reduced to 500 Hz to increase the recording duration to 40 s. A floating bench (Newport, Irvine, CA) was used to minimize the motion artifacts. We choose a much slower sampling frequency for the hemodynamic measurements to increase the duration of these recordings and the size of the acquired data. We have recorded the IOS signal at 1000 Hz, and the signal evolves on a much slower timescale, which does not require such fast imaging (data not shown). Both IOS and VSD data were displayed as a percent change in illumination (dI/I).
Figure 1.

Experimental setup and bleaching adjustment (A). Diagram of experimental device for simultaneous VSD and IOS imaging. Two illumination sources are used for VSD and IOS, respectively. The IOS illumination is filtered with 546 ± 10 nm filter and guided to the cortex with 2 fiber optic cables. The IOS is reflected to a camera via a 570 nm dichroic mirror. A 546 ± 10 nm filter is placed in front of the camera. The VSD illumination is filtered with a heat filter and a VSD filter (630 ± 10 nm) and reflected onto the cortex via a 650 nm dichroic mirror. The fluorescence from the stained cortex is filtered with a long-pass filter, RG-665, before being focused onto the VSD camera. (B) The top trace is a recording when no epileptiform activity is present. A strong bleaching effect and respiratory noise are seen. The middle trace shows the bleaching curve calculated with a custom-written algorithm (see Materials and Methods). When the bleaching curve was subtracted from the original data, the processed data contain only the respiratory artifact.
For each animal, multiple 200-s IOS imaging blocks were continuously recorded throughout the experiment. The VSD imaging was performed randomly during the experiment to image different phases of the ictal discharges. Since the seizures started spontaneously and were not triggered, the onset times could not be predicted. Although it would be possible to trigger the VSD onset to the initial spike of each seizure, only 70% of the seizures started this way and the delay would have missed the earliest component of seizure onset and would not have provided preictal baseline recordings. Since the VSD recording window was shorter than the duration of the seizure, the VSD data were acquired at random time points to measure all aspects of the seizure. Because of photobleaching, only 5–6 VSD recordings could be performed for each animal. For these reasons, the number of seizures and number of animals from which each section of the seizure was recorded were variable.
Data Analysis
The LFP tracing was first scanned by eye to determine the existence of each seizure, which could be easily discerned from the background tracing (Fig. 2). The precise timing of the onset of the seizure was then established objectively, based on an analysis of the power of the LFP recording. The seizures were initiated in 1 of 2 ways. Some seizures began with a large population spike, followed by low-voltage fast activity (LVFA), while others began with LVFA without the initial spike (Fig. 2A,B). Time of initiation in the former type was most reliably ascertained by visual inspection of the tracing. Time of onset in the latter type was determined using a statistical method based on the mean and standard deviation (SD) of the LFP tracing during a 10-s window ending a few seconds prior to clear electrographic seizure onset. The first increase in power >2 SD above the baseline was established as the onset of the seizure (Fig. 2B). Ictal termination was set at the moment the LFP power returned within 2 SD of baseline.
Figure 2.
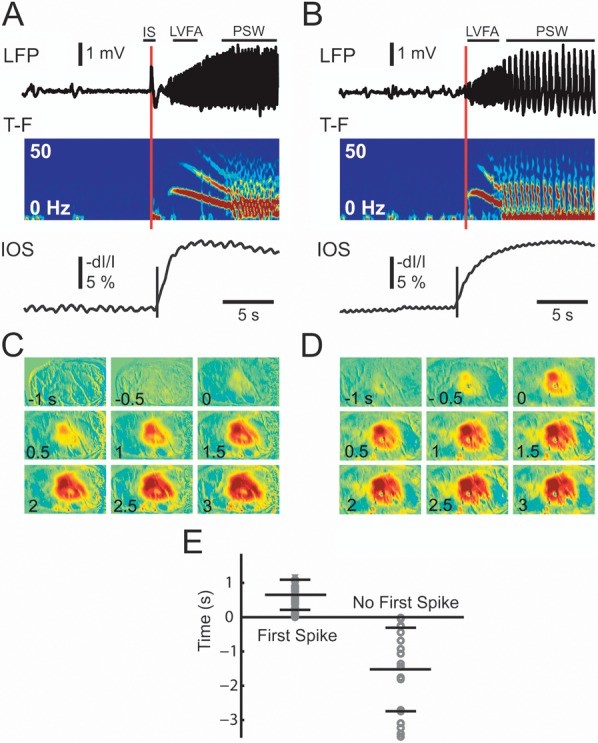
The initiation of the seizure and the IOS. (A) Seizures that began with an initial spike (IS) followed by LVFA and (B) seizures that began without an IS. Both seizure types then evolve in PSW activity . The top trace shows the LFP recording, the next time–frequency (T–F) tracing shows the instant frequency distribution of the LFP calculated with a 512 ms sliding window. Note the onset and evolution of the seizure from LVFA to PSW activity. The IOS (bottom tracing) tracing is a graph of the IOS recorded from a ROI in the same location as the LFP electrode. The red vertical line indicates the onset time of the seizure base on 2 SD increase of activity. The black vertical line in the IOS tracing indicates the onset time of the IOS signal using a similar 2 SD threshold. (C) and (D) The spatiotemporal evolution and timing of the IOS for each of the 2 types of ictal event shown in (A) and (B). Note, the IOS is apparent in the first frame of (D) just before the onset of the seizure. (E) The distribution of the delay of IOS onset for the entire data set. Each circle represents the onset of the first statistical change in the IOS with respect to the onset of the ictal event from the LFP recording for seizures that began with a first spike (left) and those that begin without a first spike (right). A positive number indicates IOS onset is later than LFP onset and a negative number indicates IOS onset is earlier than the LFP onset. The long horizontal bar indicated the mean delay and the short horizontal bar indicated the SD of the distribution of the onset times.
To calculate the fractional change of the IOS, each individual frame was divided by an average of all frames acquired during a 10-s window prior to the onset of the ictal discharges, which functioned as a baseline, as previously described (Schwartz and Bonhoeffer 2001; Suh et al. 2005). In order to increase the signal-to-noise ratio, a 2 Hz low-pass filter was performed on the resulting baseline-divided data, and spatial low-pass filtering was achieved by convolution with a Gaussian kernel (σ = 3 pixels). Since we were interested in determining if any preictal changes in IOS occurred in this model, we calculated the onset of the IOS signal in a similar way as the LFP recording. We also determined as the first increase in amplitude >2 SD above the baseline as the onset of the IOS.
To calculate the bleaching curve for each pixel, VSD data were first run through a custom-written Matlab (Natick, MA) program using a mixture of several functions, including liner, quadratic, single exponential, square root exponential, and fourth root exponential equation. The calculated bleaching curve was then subtracted from each pixel (Fig. 1B). Spatial low-pass filtering was achieved by convolution with a Gaussian kernel (σ = 3 pixels).
Although the new blue dyes have greatly reduced the heartbeat artifact (Shoham et al. 1999), pulsation artifact is still a major noise source. We used the same off-line algorithm to eliminate this artifact as our previous work (Ma et al. 2004). Briefly, an average QRS interval was obtained for each pixel in each trial. The peaks of R waves were obtained from electrocardiogram, and the maximal duration of heartbeat cycle was detected. An averaged pulsation artifact was obtained by an R wave-triggered average using the maximal duration. This averaged pulsation artifact was repeatedly subtracted from each heartbeat cycle of the original data.
To determine the spatial extent of the IOS optical signal, we thresholded the data using a percentage of the maximum pixel value, as previously described (Chen-Bee et al. 1996; Berwick et al. 2008). The threshold was set at 25% of the maximal amplitude, and all pixels above this threshold were defined as activated pixels. We chose 25% based on the signal-to-noise ratio of our actual data (Ma et al. 2009). The area of spread was then calculated by multiplying the number of thresholded pixels by the area of each pixel (IOS: 40 × 40 μm, VSD: 50 × 50 μm).
In order to examine the initiation and propagation of each population spike during the seizures, a 2–30 Hz band-pass filter was applied to the VSD data recorded from each individual pixel to remove the low-frequency wave and high-frequency noise. We use a similar method as Ma et al. (2004) to calculate the initiation site of each individual spike. In brief, we calculated the onset time of each pixel within the spatial extent of the event. The onset time was defined as the time for the signal to reach half of the peak amplitude. The pixel with the earliest onset time was defined as the initiation site. To calculate the propagation velocity from the initiation site to a given site, the distance between sites was divided by the onset time difference between 2 sites. The average propagation velocity of a given event was calculated by averaging the velocity in 4 different directions: anterior, posterior, medial, and lateral.
Results
Seizure-like discharges were induced by local injection of 4-AP and recorded with an adjacent LFP electrode to confirm the onset, duration, termination, and morphology of the seizure. Spontaneous ictal discharges began anywhere from 4 to 15 min after a single injection of 4-AP and occurred spontaneously and periodically for up to 2 h (n = 67 seizures; n = 10 rats). Each seizure lasted an average of 62 ± 19 s with an average interseizure interval of 283 ± 191 s.
Seizure Initiation
IOS Initiation
Of the 67 seizures, 47 began with an initial spike and 20 began without the initial spike. These 2 onset types are also found in human epilepsy (Bancaud and Talairach 1973; Spencer et al. 1992; de Curtis and Gnatkovsky 2009). The initial spike was clearly different than the infrequent interictal spikes that can also occur with the in vivo 4-AP model (Fig. 2A). The time–frequency (T-F) graph showed an increase power in the low-frequency band during the initial first spike (Fig. 2A). The initial spike was followed by low-amplitude fast activity that progressively increased in amplitude, evolving into, what is otherwise known in clinical epileptology as the recruiting rhythm (Bancaud and Talairach 1973; Spencer et al. 1992; de Curtis and Gnatkovsky 2009). The IOS, which at the recorded isosbestic hemoglobin wavelength represents CBV, began 0.653 ± 0.482 s after the initial population spike.
The seizures that did not begin with an initial spike initiated with an LVFA recruiting rhythm, which gradually increased in amplitude. In the T-F graph and power spectrum, one can see that interictal spikes may elicit small limited changes in power; however, at seizure onset, these increases are sustained and evolve over time. On average, for all 20 seizures, the IOS onset for this second initiation type occurred 1.525 ± 1.218 s before the first significant change in the LFP (Fig. 2E), hence the latency of neurovascular coupling can depend on the type of seizure and the electrophysiologic signature of the event. In both the cases, the IOS signal initiated from a local area and gradually propagated to distant areas marching slowly and radially along the cortex (see propagation velocity below; Fig. 2C,D).
VSD Initiation
Since the LFP measures transmembrane currents in a volume around the electrode, which depends on spatial distribution, the technique may be insensitive to membrane potential change in specific layers (Nicholson and Freeman 1975; Pettersen et al. 2006; Einevoll et al. 2007). Hence, we examined the simultaneously recorded VSD signal, which reflects mean membrane polarization, strongly weighted toward superficial cortical layers, to evaluate activity in the VSD signal that might be identified prior to any evidence of onset in the LFP. This comparison was particularly useful for those seizures that did not begin with an initiating spike compared with those that initiated with a large population spike, where onset was likely to be simultaneous with both recording modalities (Ferezou et al. 2006).
For ictal events initiated with an initial spike, the VSD signal recorded from a 250 × 250 μm region of interest (ROI) under the injection site showed a waveform closely correlating with that of the LFP recorded from the same location (Fig. 3A). From the VSD perspective, this initial spike demonstrated an increase in membrane potential change that rapidly spread to a large area, which reached its maximal area and amplitude within 300 ms, which is much earlier than the slow spatiotemporal evolution of the IOS. The membrane potential increase was followed by a decrease in membrane potential in the same area (Fig. 3A). The VSD signal change occurred simultaneously with the onset of spike recorded with the LFP electrode (Fig. 3B). Propagation speed for this initial spike was 6.7 ± 1.3 mm/s (n = 9 seizures, from 5 animals). Ictal events that began without an initial population spike, however, showed clear indications for VSD activity preceding the ictal onset, often consisting of slow (∼0.5 Hz) alternating increases and decreases in membrane potential (Fig. 3C,D). Spatially, this “preictal” activity occurred in a widespread of area, but the precise initiation site and propagation direction varied from event to event (Fig. 3C). When multiple seizures of this type are averaged together (n = 4 seizures from 3 animals), significant preictal activity is demonstrated but with large error bars, indicating that the location and direction of this activity varied between seizures (Fig. 3D). Propagation velocity of these small multidirectional waves could not be calculated since the VSD signal-to-noise was low. A similar variability in seizure onset and propagation is also shown during the evolution of the propagation phase of the seizure demonstrated with VSD imaging but with a higher signal-to-noise than at the onset (see below).
Figure 3.

The initiation of VSD signal. The initiation of VSD signal at seizure onset for events with (A) and without (B) a first spike. (Top) LFP recording and simultaneously recorded VSD data from a 0.25 × 0.25 cm ROI in the same location as LFP electrode. The red vertical bar indicates the timing of the onset of the ictal event. The black horizontal line demonstrates the timing of the images shown below. (Bottom) VSD images recorded at different time points during seizure initiation. The image in the upper left hand corner shows the period of VSD signal derived from the tracings above corresponding the horizontal bar below the tracing. The red vertical bars superimposed on the VSD signal show the timing of each subsequent VSD image. Note that there is clearly both increases and decreases in membrane potential in the VSD signal prior to the onset of the seizure in the LFP signal for the seizure without the initiating spike seen in (C). (B) and (D) Mean (SD) VSD tracing from ROI over LFP electrode at seizure onset for each seizure type. (B) For seizures that begin with an initiating spike, the VSD signal increases after seizure onset as determined by the timing of the spike on LFP shown with the red vertical line (n = 9 seizures; n = 5 animals). (D) For seizures that begin without an initiating spike, significant increases and decreases in membrane potential occur prior to seizure onset, as determined with the LFP recording (n = 4 seizures; n = 3 animals). Note, the VSD and LFP signal are not identical because the VSD reflects the membrane potential change sampled from 0 to 250 Hz and LFP reflects the current flow through the LFP electrode sampled from 1 to 500 Hz.
Seizure Propagation
LFP recordings indicate that ictal propagation was characterized by 2 different electrographic morphologies at distinct time periods of the seizure. During early evolution, LVFA increased in amplitude (i.e., recruiting rhythm) with power in the 10–20 Hz range. When the frequency became lower than ∼9.5 Hz, the ictal events evolved into periodic spike-and-wave (PSW) activity prior to termination (Figs 2, 4, and 5). With simultaneous IOS and VSD imaging, we could directly compare the spatiotemporal evolution of neurovascular coupling during seizure propagation for individual seizure events without averaging between events. We specifically addressed the question of the spatial correlation (i.e., neurovascular coupling) between the voltage and the CBV signals during LVFA compared with the PSW activity and the spatiotemporal dynamics of the spatial extent of CBV and membrane potential change during ictal propagation.
Figure 4.

Ictal propagation of the IOS demonstrates variability in the intensity of inverted signal in the surround. (A) The IOS spatially blurs the distinct changes in LFP morphology indicating that the hemodynamic signal in the focus is insensitive to seizure evolution. The top left shows the field of view and the location of the 4-AP and LFP electrode. A red box indicates a small ROI within which is located the 4-AP and LFP electrodes. The LFP and the IOS recorded from the ROI are showed. The images at different time points are showed below the LFP and IOS traces. Note that the seizure in the top trace has a small negative blood volume change recorded in the surround. The seizure on the bottom recorded from the same animal has a smaller area of spread in the focus but a much more intense negative signal change in the surround indicating a decrease in CBV. (B) The spatial distribution of the CBV change in 2 different seizures (top versus bottom) in 3 different animals. Each image is the average of 5 s of IOS data in the middle of the ictal event. The top row shows the spatial distribution when the negative surround is small. The bottom row shows the spatial distribution when the negative surround is large. Note, the area of the increase in CBV is much smaller in the bottom row when the negative signal in the surround is more developed. (C) Average change in the area of the increase in CBV in the focus depending on the presence of intense decrease in CBV in the surround (no negative surround [n = 8 animals, 41 seizures] yes negative surround [n = 7 animals, 26 seizures]).
Figure 5.

Ictal propagation is characterized by multiple small propagating waves with both conserved and variable onset and spread. (A) Image on the left shows the cortical surface with the location of the LFP and 4-AP electrodes. A black box indicates a small ROI used to derive the VSD response (right) containing the 4-AP and LFP electrodes. Note, the LFP and VSD signal are highly correlated. Two short horizontal bars indicate small temporal windows from which figures (B) and (C) are derived that correspond to LVFA and PSW activity. (B) During LVFA, each upward and deflection of the LFP tracing consists of a propagating wave whose initiation site is conserved with similar but slightly variable propagation. The red vertical bars indicate the timing of each image shown on the right. (C) During PSW activity, the first spike shows conserved initiation and more intense but similar propagation as occurred during the LVFA. However, subsequent smaller spikes show variable initiation and propagation. Note that increases and decreases in membrane potential alternate and that the initiation of increased activity is surrounding by a transient ring of relative decreased activity, indicating a dynamic interplay between excitatory and inhibitory membrane potential. Also note the scale bar of the VSD change, which is almost 10 times as large during the PSW activity. The black circles in (B) and (C) indicate the initiation site of the spikes. Note: the trace in (B) and (C) are band-pass filtered sections from (A) (see Materials and Methods).
IOS Propagation
The IOS at 546 nm is directly proportional to increases and decreases in CBV. Ictal propagation was characterized by a progressive increase in CBV in the focus, as demonstrated previously (Bahar et al. 2006; Zhao et al. 2009). As shown in previous work, IOS can be used to identify ictal onset and early propagation (Schwartz and Bonhoeffer 2001; Bahar et al. 2006; Zhao et al. 2009). However, the transition from LVFA to PSW activity was not discernible in the IOS, also consistent with prior results (Bahar et al. 2006), since the temporal resolution of the IOS is inadequate to distinguish events occurring on a subsecond timescale. Likewise, spatial blurring of the electrical events occurs since the electrical activity changes rapidly over time and space with the underlying neuronal domains, but the CBV response is constrained by vascular domains with slightly different spatial characteristics (Woolsey et al. 1996; Ma et al. 2009). Propagation velocity of the hemodynamic response at the onset of the seizure was 0.45 ± 0.12 mm/s (n = 10 animals), until the entire area of electrographic activity was covered with increased CBV, after which there was no further propagation but rather a steady increase in CBV to the entire area of cortex involved in the event (Fig. 4A). There was a slight increase in area of the IOS when comparing LFVA (8.95 ± 1.37 mm2, n = 10 animals) with PSW (10.72 ± 2.92 mm2, n = 10 animals; t-test, P = 0.0065) as the LVFA occurred earlier in the seizure evolution than the PSW activity. Hence, the IOS creates the illusion that seizures propagate in a smooth homogeneous fashion across the cortex, while in fact smooth propagation only exists in the hemodynamic response to the seizure rather than in the underlying electrical activity, as will be demonstrated with VSD imaging. However, the spatial distribution of the evolution of CBV response clearly varied from seizure to seizure within the same animal, representing a lack of uniformity in certain elements of the hemodynamic response (Fig. 4B). The most apparent difference was the presence of an intense ring of negative signal (decrease in CBV) in a subset of the seizures, which has been previously also correlated with a decrease in CBF, particularly at the onset of the seizure (Zhao et al. 2009) (Fig. 4). In the same animal, some seizures were surrounded by an intense ring of negative signal followed by seizures with little or no negative surround. No distinct electrographic pattern could be associated with the intensity of the inverted signal in the surround. Nor did the negative surround have any relevance with the timing of the seizure during the course of the experiment, that is, early versus late seizures. However, when an intense negative surround was recorded, the area of the increase in the CBV in the focus was significantly smaller (7.67 ± 1.23 mm2) than when a more mild or absent negative signal was found (12.60 ± 2.61 mm2; t-test, P < 0.001; Fig. 4). These results indicate the existence of a center-surround antagonistic phenomenon in hemodynamic response to ictal propagation, which either represents a similar dynamic in the underlying neuronal–glial activity (i.e., surround inhibition) or could be of primarily vascular etiology (i.e., shunting of blood from the surround to the focus) as was previously demonstrated during the immediate preictal period (Zhao et al. 2011).
VSD Propagation
The most striking finding about ictal propagation, when viewed using VSD imaging, is the lack of any slow progressive movement or Jacksonian “march” across the cortex from the early to middle parts of the seizure. VSD imaging of membrane potential change during ictal propagation in our data provided a dramatically different model of seizure propagation, in which multiple propagating subthreshold waves with slightly varying initiation and directionality gradually increased in intensity. However, distant horizontal propagation, far beyond the presumed ictal onset zone, occurred at the very onset of the seizure, albeit at lower amplitude and a slightly shorter distance than during later time points, with only a slight increase in propagation distance over the course of the seizure (Figs 5 and 6). In other words, seizures consist not of one propagating wave but rather multiple propagating waves, and each positive and negative deflection of the field recordings represents a unique propagating event. Even early in the seizure evolution, horizontal propagation spreads over a wide distance of the cortex nearly equivalent to the ultimate extent of propagation that occurs during later periods of seizure evolution. At the onset of each of these independent events, a transient ring of inhibition can be identified, which is rapidly overcome as the event propagates and between each event a more widespread region of inhibitory activity is identified. LVFA is characterized by conserved initiation sites (Fig. 7) and lower amplitude propagating waves with conserved propagation directionality (Figs 5 and 6). Also, the LVFA emerges from, and rides on, a large inhibitory membrane potential change. Propagation velocity of each of these waves was 147 ± 53 mm/s (n = 74 waves; n = 5 rats). PSW, on the other hand, is characterized by variable initiation sites (Fig. 7) and propagation, with higher amplitude activity (Figs 5 and 6). Propagation velocity of each of these waves was significantly slower at 78 ± 36 mm/s (n = 169 waves; n = 5 rats; P < 0.001).
Figure 6.

LVFA and PSW demonstrate conserved and variable propagation, respectively. (A) and (B) show the propagation patterns in 2 different seizures from 2 different animals using a linear ROI, which allows the presentation of continuous VSD data. Image on the left indicates the location of the ROI (red bar) with respect to the 4-AP and LFP electrodes. The red A and R stand for anterior and posterior. Horizontal bars under the LFP trace indicate 2 different sections of the data, taken from LVFA and PSW activity. The data in the ROI during the selected time periods are displayed at the bottom. The black lines indicated the onset time of each pixel. The onset curves were overlapped to the right of the figure. During the LVFA, each spike causes a rapid spread in increased membrane potential change that is conserved. The onset curves were similar during different spikes. During PSW activity, there is variability in the initiation and propagation of increased activity with more intense interspike decreased activity. The onset curves were different during different spikes. Also note that from the very onset of the seizure, the horizontal propagation covers as large an area of cortex as later in the developing seizure.
Figure 7.

Variability of initiation sites more spatially restricted during LVFA compared with PSW activity. (A) An ictal event recorded with LFP. The LFVA is in red and the PSW section is in blue. (B) The spatial distribution of the initiation sites of the waves corresponding to each positive deflection of the LFP during each section of the seizure. Dotted lines are used to connect the consecutive initiation sites. The length of the lines (shift distance) is the distance between 2 consecutive initiation sites. (C) The distribution of the shift distance during the single seizure shown in (A). LVFA mean shift distance is significantly shorter (t-test, P < 0.001) than the averaged shift distance during spike-and-wave. Mean (SD) shown with error bars. (D) The distribution of shift distances from all seizures in all 10 animals. Note that initiation sites, although extremely variable, are more conserved during the LVFA at the onset of the evolution of the seizure compared with the PSW activity at the latter half of the seizure.
In addition to differences in propagation velocity, we noted that each wave of activity initiated in a slightly different location, and the distance between the locations was more conserved during LVFA activity compared with PSW activity. Average data between animals indicate that the average distance between initiation sites of each individual propagating wave during LVFA was 0.48 ± 0.35 mm (n = 10 animals, 453 distances) compared with 1.29 ± 0.86 mm during PSW activity (n = 10 animals, 1248 distances; P < 0.001; Fig. 7). Likewise, the maximal area of propagation of each wave varied. Average maximal area of VSD propagation was 9.25 ± 1.87 mm2 during LVFA and 10.31 ± 2.17 mm2 during PSW.
We have tried to demonstrate these concepts in a series of figures that include data both from individual animals as well as population data. Since seizures are variable events, pooling data between animals and even between seizures within a single animal is challenging and blurs this variability. These data are best represented as movies which are available as Supplementary Material (http://hongtao-opticalimaging.blogspot.com/2011/11/simutaneous-voltage-sensitive-dye-and.html).
Spatial correlation between VSD and IOS signal
Since seizures are unique events with significant interseizure spatiotemporal variability, the only method to optically characterize the evolution of neurovascular coupling is to simultaneously measure neuronal activity and hemodynamic change with broad spatial sampling and high spatial resolution. Sequential measurements and averaging of data are inadequate. For this reason, we developed a method for simultaneous acquisition of VSD and IOS data (Fig. 1), which was essential to address the progressive correlation between the 2 signals. In general, we find that during all points in the evolution of the seizure, the area of CBV signal was slightly larger than the maximal spread of each membrane potential wave (Fig. 8). However, at the onset of the seizure, immediately after the initiating spike, the resulting VSD wave spread far beyond the initial slowly evolving change in CBV. Then as the seizure evolved, the 2 signals mostly overlapped at their lateral extent, although the overlap is not exact and the 2 signals spread to slightly different areas of cortex at their margins (Fig. 8A). While the IOS spreads smoothly and homogeneously, however, the VSD signal shows marked variability in the spatial spread of each wave (Fig. 8B). Averaging over 8 animals in which simultaneous data were acquired during the evolution section, the maximal VSD area was 10.07 ± 1.91 mm2, which is smaller but not statistically different than the maximal area of CBV spread (11.23 ± 2.62 mm2). The overlapped area between VSD and IOS was 7.34 ± 1.89 mm2, which represents 65% of the IOS signal and 73% of the VSD signal. However, since the VSD signal demonstrates multiple rapidly propagating waves and only the maximal extent briefly demonstrates this overlap with the IOS signal, the majority of the time the 2 events are completely uncoupled. These results indicate that the hemodynamic signal, although highly spatially correlated and related to the maximal area of membrane potential increase during the middle of the evolution of the seizure, is clearly a separate independent event with unique regulatory mechanisms.
Figure 8.

The spatial overlap between VSD and IOS. (A) An ictal events recorded with simultaneous VSD and IOS imaging. The picture on the left is the field of view of the IOS imaging. A large red box indicates the area recorded with VSD imaging. A small red box indicates an ROI in which the VSD and IOS tracings are derived. The simultaneous recorded LFP, VSD, and IOS traces are showed on the right. Two linear red rectangles indicate 2 time periods of data shown in (B). (B) The spatial distribution of IOS and VSD signal at each of the 2 time periods shown in (A). Three vertical red lines indicate the time points for the VSD images on the right. The IOS data are taken from the same time period. The spatial extent of the IOS signal is thresholded and overlaid on the VSD data as a black outline. Note, the IOS and VSD areas do not perfectly overlap, and the VSD signal is slightly smaller in area during both LVFA and PSW, but both are clearly larger in spatial extent during the later PSW period of the seizure. The spatial overlap appears closer during the PSW compared with the LVFA section of the seizure. (C) Progressive change in the area of the IOS compared with the VSD data in a single seizure. The IOS data are represented as a smooth increase in area that plateaus. The maximal area of each VSD wave is indicated with an asterisk. This asterisk represents the maximal extent of a propagating wave that begins at a point in space. At seizure onset, the initial spike elicits a VSD wave that propagates far beyond the slower CBV signal. Then, during the initial evolution of the seizure, the maximal spread of the VSD signal is smaller than the IOS area, but the overlap improves as the seizure evolves into PSW activity. However, while the IOS area increases smoothly over time, the VSD areas are extremely variable. Although the IOS data blur the spatial inhomogeneity of the VSD data, the IOS signal is a reasonable approximation of the maximal spread of the increase in membrane potential change during the later evolution of the seizure. (D) Spatial overlap of the maximal spread of the VSD and IOS data determined with thresholding in a different animal. Top left, the field of IOS recording. The red box indicates the field of the VSD recording. The averaged VSD and IOS areas during a 5-s period in the middle of an ictal event are demonstrated. The maximal area of spread of the IOS and VSD data are clearly similar, but the overlap is not precise with more spatial spread form the IOS signal. (E) Average data from all seizures in all animals showing area of maximal spread of the IOS and VSD and the area of spatial overlap. Error bar: SD.
Seizure Termination
The etiology of seizure termination is not well understood but may consist of depolarization block, changes in pH, closing of gap junctions, or glial uptake of neurotransmitters (Pinto et al. 2005). We recorded neurovascular coupling during ictal termination. Compared with the high degree of overlap during the intermediate stages of ictal evolution, ictal termination was exemplified by an uncoupling of CBV and membrane potential and little spatial overlap (Fig. 9). Averaging over all seizures, at ictal termination, the area of the IOS was 4.49 ± 0.69 mm2, the area of the VSD signal was 2.28 ± 0.50 mm2, and the overlap was 0.64 ± 0.58 mm2 (n = 19 seizures; n = 8 animals), representing 28.1% and 14.2% of the VSD and IOS signal, respectively (Fig. 9D). Additionally, although the VSD signal terminated all at once, simultaneous with the LFP termination, the hemodynamic signal persisted even after the electrographic termination of the seizure with a slow gradual decline (Fig. 9C,D). On average, of all 67 ictal events recorded from 8 animals, the IOS returned to the baseline 8.74 ± 6.15 s after the termination of the seizure as recorded with the LFP.
Figure 9.

Neurovascular uncoupling at ictal termination. (A) The LFP and IOS recording during an ictal event. A dotted box indicates 4 s of data from the middle of the event, and a solid box indicates 4 s of data at the end of the event. The data from each polyspikes and wave events are marked in different color. (B) Threshold overlap of the VSD and IOS areas during 8 polyspikes and wave events at different time points indicated in (A). The first 4 images are drawn from the data in the dotted box (middle of seizure), and the later 4 images are drawn from the data in the solid box (termination of seizure). Note that, compared with the middle of the seizure when the 2 signal display significant overlap, during ictal termination, IOS signal is much larger than the VSD signal. (C) Tracing of area of IOS and VSD signals over time. Each black dot represents the maximal area of VSD signal during 1 s of recording. The color dots correspond to the maximal area of VSD signal during the selected period shows in (A) and (B). Note that the difference between the 2 signals increases at ictal termination. (D) Average of area overlap in the middle and end of the seizure of 8 animals and 19 seizures. Ictal termination is characterized by neurovascular uncoupling. The hemodynamic signal is dramatically larger in area and persists after the electrical offset of the seizure. Error bars: SD.
Discussion
Early models of seizure initiation and propagation have remained the substrate for current theories of ictal spread and form the basis for surgical therapy. According to this theory, seizures arise from a hyperexcitable hyperconnected population of neurons, or epileptic zone, which can be as small as a single cortical column (Gabor et al. 1979; Ebersole and Chatt 1984; Silva et al. 1991). Seizures then propagate horizontally across the cortex in a nonuniform manner, at varying velocities, shaped by anisotropic long-range horizontal connections modulated by inhibitory control (Chervin et al. 1988; Wadman and Gutnick 1993; Telfian and Connors 1998; Connors et al. 2001; Trevelyan et al. 2006; Trevelyan and Yuste 2007). Removal of the epileptic zone and interruption of propagation pathways can result in effective therapy (Ojemann 1987; Hufnagel et al. 1997). In this paper, we present an updated model, which consists of a much more dynamic and widespread pattern of increases and decreases in membrane voltage. We show 4-AP elicites seizure-like ictal events consisting of multiple propagating waves of increased membrane potential with variable sites of initiation and directionality whose spatial topography changes during the course of the seizure, being more conserved during the initial recruiting rhythm and displaying more variability as the seizure evolves into spike-and-wave activity. Rather than starting at a point and slowly marching outward, as traditional models describe, these waves display widespread horizontal propagation even at the earliest time points of seizure onset and then gradually increase in amplitude as the seizure evolves (Fig. 10).
Figure 10.

Illustration of the dynamic coupling and uncoupling of membrane potential and CBV during a 4-AP seizure. The LFP, IOS, and VSD signal during the initiation, propagation (LVFA PSW), and termination are diagrammed. The spatiotemporal dynamics of IOS and VSD at 3 different time points in each section are shown. Immediately following the initiation spike, the VSD signal rapidly propagates to a widespread area (over a few hundred milliseconds), while IOS signal propagates slower (over several seconds). During ictal evolution, the maximal spatial spread of IOS and VSD signal are similar. However, the rapidly propagating waves of membrane potential during LVFA arise from a more conserved region of initiation sites and propagate along similar paths. During PSW, on the other hand, each wave initiates from various initiation sites and propagates along different pathways and in different directions. During these periods, the CBV signal remains relatively stable and constant. At ictal termination, the VSD signal dissipates more rapidly than the IOS signal.
Ictal Initiation and Preictal Activity
Whether ictal initiation is conserved in space or multifocal has been widely debated. Early models, based on scalp electroencephalography (EEG) and observations of conserved human ictal semiology, described onsets as arising from a localized zone (Brazier 1972). However, scalp EEG ictal patterns require a significantly large source area and widespread synchrony and thus are a poor measure of more subtle underlying activity (Tao et al. 2007). Variability in ictal initiation is clearly demonstrated in most in vitro laboratory studies, however, these models are generally created with either bath application or superperfusion of epileptogenic agents, sometimes coupled with focal stimulation, which creates widespread zones of epileptogenicity and artificial onsets (London et al. 1989; Albowitz and Kuhnt 1993; Demir et al. 1998; Tsau et al. 1999; Miyakawa et al. 2003; Ma et al. 2004; Pinto et al. 2005; Derchansky et al. 2006). More modern definitions of the epileptic zone describe a large network of interconnected neuronal populations with multifocal onset and propagation (Wennberg et al. 2002; Zaveri et al. 2009). Our data indicate that even seizures arising from focal injection of 4-AP do not have a single site of initiation but rather hundreds of separate initiation sites for each wave of excitatory activity. Moreover, the spatial distribution of these sites varies with time. Early in the seizure, during LVFA, the onsets are spatially more conserved. This is consistent with clinical evidence that LVFA represents a more localized pattern of electrical activity (Lieb et al. 1976; Gotman et al. 1995; Bartolomei et al. 1999) created by activation of inhibitory networks as opposed to irregular or PSW activity that represents recruitment of adjacent cortex from activation of interconnected populations of excitatory neurons (Gnatkovsky et al. 2008).
Seizures that did not begin with a large population spike exhibited VSD oscillations in membrane potential prior to clear LVFA in the LFP. These preictal events fluctuated in space and time and may represent a gradual buildup of multifocal activity consistent with either microseizures or high-frequency oscillations from small generators (Bragin et al. 2002, 2003; Schevon et al. 2008) and thus may be more correctly classified as “early” ictal. Although we were able to identify preictal increases in CBV prior to clear LFP ictal onset, these events were always accompanied by VSD fluctuations in membrane potential and were likely linked to neuronal activity, either through metabolic demand or direct synaptic control (Rossier 2009). Isolated preictal vascular reactivity was not found in the 4-AP model as identified in human events (Zhao et al. 2007).
Propagation
Traditional models of human ictal propagation derived from scalp EEG consist of a gradual recruitment of adjacent normal cortex or Jacksonian march (Jasper 1969). Human intracranial recordings, on the other hand, show that seizures can spread at widely varying speeds from <200 μm/s to >10 mm/s and jump to nonspatially contiguous regions (Kutsy et al. 1999; Blume et al. 2001). In vitro studies demonstrate that seizures can propagate rapidly (20–100 mm/s) when inhibition is decreased (Chervin et al. 1988; Chagnac-Amitai and Connors 1989; Wadman and Gutnick 1993; Albowitz and Kuhnt 1995; Pinto et al. 2005) or at slower velocities (100–300 μm/s) if inhibition is preserved as in the 0 Mg2+ model (Wong and Prince 1990; Trevelyan et al. 2006). Likewise, modular inhomogeneous, slower propagation is described using electrode arrays and calcium imaging (Chervin et al. 1988; Wadman and Gutnick 1993; Trevelyan et al. 2006, 2007) compared with smooth propagation using VSD or IOS imaging of membrane potential, light reflection, or CBV (Sutor et al. 1994; Tsau et al. 1998; Schwartz and Bonhoeffer 2001; Bahar et al. 2006; Derchansky et al. 2006).
Our in vivo data indicate that membrane potential change does not gradually march outward across the cortex from the ictal onset zone. Rather, multiple distantly propagating waves spread at ∼100 mm/s smoothly across the cortex over large cortical networks repetitively throughout the course of the seizure. This is consistent with the findings of Trevelyan et al. (2006) using calcium imaging in 0 Mg2+ slices, in which a widespread barrage of excitatory activity spread throughout the slice even in the early stages of ictal propagation but was vetoed by feedforward inhibitory activity.
The propagation of hemodynamic activity, on the other hand, was characterized by a single slow steady wave. CBV propagation speed (0.45 mm/s) was surprisingly similar to the speed of propagation of bursting cells recorded in vitro from slices bathed in 0 Mg2+ artificial cerebrospinal fluid where inhibition is preserved. This raises the intriguing possibility that the hemodynamic propagation may mirror the gradual march of suprathreshold bursting activity as opposed to subthreshold waves of excitatory and inhibitory barrages demonstrated with VSD imaging.
Neurovascular Coupling and Ictal Termination
Functional hyperemia is the process that spatially and temporally adjusts the brain’s blood supply to the energy and oxygen needs of activated neurons through a poorly understood mechanism involving interneurons, astrocytes, pyramidal cells, and chemical messengers (see reviews by Lindauer et al. 2010; Lecrux and Hamel 2011). We show that functional hyperemia spatially overlaps but overestimates the maximal extent of each wave of increase in membrane potential during ictal evolution and propagation. However, there is a dramatic blurring of the underlying complexity of the increases and decreases in membrane potential changes since the functional hyperemia moves smoothly across the cortex. Hence, the processes are spatially only partially coupled and in fact are mostly uncoupled, particularly at ictal onset and termination, the former being characterized by much wider VSD propagation and the latter by wider CBV propagation (Fig. 10). The resulting paradigm is 1 of 2 separate indirectly linked processes evolving in parallel. Recent studies of single unit responses in humans have demonstrated that seizures terminate with widespread complete cessation of activity, similar to our VSD data (Truccolo et al. 2011). The more widespread persistence of increased CBV may represent high venous compliance, persistent metabolic activity required for neurotransmitter or potassium reuptake or the second phase of the “dual phase” for the vascular response previously described for prolonged stimulation of the cortex (Buxton et al. 1998; Berwick et al. 2008). Indeed, a persistent late focal hemodynamic response has also been demonstrated in human studies following the termination of triggered after discharges and spontaneous seizures (Zhao et al. 2007; Ma et al. 2009) and is likely a real phenomenon in human clinical epilepsy. Late ictal single photon emission computed tomography injections have also demonstrated persistent increases in CBF for up to 100 s (Avery et al. 1999) postictally, although postictal BOLD decreases have been reported in a rat model of generalized seizures (DeSalvo et al. 2010). The duration of immediate postictal increases in CBF and CBV, are likely variable in length depending on either the seizure type, duration or species, which are then followed by compensatory or rebound decreases for variable lengths as well.
It has been well demonstrated that the neurovascular coupling may be altered in the diseased brain, such as occurs during aging (Farkas and Luiten 2001), stroke (del Zoppo 2010), hypertension (Girouard and Iadecola 2006), and Alzheimer’s disease (Zlokovic 2005). However, is unclear if our data represent a pathologic coupling mechanism unique to epilepsy or normal coupling mechanisms occurring during a pathologic event, although the latter is more likely since the model we employ is one that acutely elicits seizure-like events in a normal cortex.
Limitations of Our Study
We use local injection of 4-AP, an acute model to generate seizure-like activity. Clearly, acute pharmacologic ictal-like events do not perfectly recapitulate chronic spontaneous human seizures. Nevertheless, there is no other in vivo model that can reliably generate recurring stereotypical partial onset neocortical seizure-like events under anesthesia in a rodent. For this reason, the 4-AP model has been widely used as a model of partial onset neocortical seizures for therapeutic research (Gajda et al. 2005; Lees et al. 2006; Rothman 2009).
We used VSD imaging to record the neuronal activity during 4-AP induced seizures. The recorded signal represents membrane voltage change in a mixture of all cells stained with VSD including neurons, glia, and blood vessels. However, the membrane activity of glia and vessels has a very slow temporal response compared with the neuronal response. The VSD signal we recorded correlated temporally and morphologically with the LFP waveform, which in turn represents neuronal population activity. The in vivo VSD signal mainly reflects the subthreshold activities of the superficial cortical layers but can also show suprathreshold action potentials, although cannot differentiate between the 2 events (Slovin et al. 2002). Although prior brain slice experiments have shown that the 4-AP may differentially effect superficial versus deep cortical layers (Barkai et al. 1995), those experiments used a much lower dose of 4-AP than used in our experiments. Hence, we do not know if our data represent infragranular as well as supragranular activity.
Conclusion
In this paper, we have demonstrated that the paradigm of seizure propagation, which dates back to John Hughlings Jackson, whereby ictal events start at a point and spread outward, may only represent one aspect of seizure propagation and, in particular, overlooks subthreshold membrane potential activation. Using VSD imaging, we demonstrate that seizures consist of multiple dynamic multidirectional waves of membrane potential change with variability in onset that spread through a widespread network of cells at the very outset. The corresponding functional hyperemia is a parallel phenomenon, uncoupled in both space and time, which exhibit varying degrees of spatial and temporal overlap with the underlying electrical events and is likely governed by independent mechanisms.
Funding
National Institute of Neurolgical Disorders and Stroke (grant RO1 NS-49482, T.H.S.), the Epilepsy Foundation through the generous support of the American Epilepsy Society (H.M.), and the Citizens United for Research in Epilepsy (H.M.).
Acknowledgments
We thank Dr Jason Berwick, Sam Harris, and Xiangmin Xu for helpful comments on the manuscript. Conflict of Interest: None declared.
References
- Albowitz B, Kuhnt U. Spread of epileptiform potentials in the neocortical slice: recordings with voltage-sensitive dyes. Brain Res. 1993;631:329–333. doi: 10.1016/0006-8993(93)91553-5. [DOI] [PubMed] [Google Scholar]
- Albowitz B, Kuhnt U. Epileptiform activity in the guinea-pig neocortical slice spreads preferentially along supragranular layers—recordings with voltage-sensitive dyes. Eur J Neurosci. 1995;7:1273–1284. doi: 10.1111/j.1460-9568.1995.tb01117.x. [DOI] [PubMed] [Google Scholar]
- Albowitz B, Kuhnt U, Ehrenreich L. Optical recording of epileptiform voltage changes in the neocortical slice. Exp Brain Res. 1990;81:241–256. doi: 10.1007/BF00228113. [DOI] [PubMed] [Google Scholar]
- Avery RA, Spencer SS, Spanaki MV, Corsi M, Seibyl JP, Zubal IG. Effect of injection time on postictal SPET perfusion changes in medically refractory epilepsy. Eur J Nucl Med. 1999;26:830–836. doi: 10.1007/s002590050456. [DOI] [PubMed] [Google Scholar]
- Bahar S, Suh M, Zhao M, Schwartz TH. Intrinsic optical signal imaging of neocortical seizures: the “epileptic dip”. Neuroreport. 2006;17:499–503. doi: 10.1097/01.wnr.0000209010.78599.f5. [DOI] [PubMed] [Google Scholar]
- Bancaud J, Talairach J. [Methodology of stereo EEG exploration and surgical intervention in epilepsy] Rev Otoneuroophtalmol. 1973;45:315–328. [PubMed] [Google Scholar]
- Barkai E, Friedman A, Grossman Y, Gutnick MJ. Laminar pattern of synaptic inhibition during convulsive activity induced by 4-aminopyridine in neocortical slices. J Neurophysiol. 1995;73:1462–1467. doi: 10.1152/jn.1995.73.4.1462. [DOI] [PubMed] [Google Scholar]
- Bartolomei F, Wendling F, Vignal JP, Kochen S, Bellanger JJ, Badier JM, Le Bouquin-Jeannes R, Chauvel P. Seizures of temporal lobe epilepsy: identification of subtypes by coherence analysis using stereo-electro-encephalography. Clin Neurophysiol. 1999;110:1741–1754. doi: 10.1016/s1388-2457(99)00107-8. [DOI] [PubMed] [Google Scholar]
- Berwick J, Johnston D, Jones M, Martindale J, Martin C, Kennerley AJ, Redgrave P, Mayhew JE. Fine detail of neurovascular coupling revealed by spatiotemporal analysis of the hemodynamic response to single whisker stimulation in rat barrel cortex. J Neurophysiol. 2008;99:787–798. doi: 10.1152/jn.00658.2007. [DOI] [PMC free article] [PubMed] [Google Scholar]
- Blume WT, Ociepa D, Kander V. Frontal lobe seizure propagation: scalp and subdural EEG studies. Epilepsia. 2001;42:491–503. doi: 10.1046/j.1528-1157.2001.26700.x. [DOI] [PubMed] [Google Scholar]
- Bragin A, Mody I, Wilson CL, Engel J., Jr Local generation of fast ripples in epileptic brain. J Neurosci. 2002;22:2012–2021. doi: 10.1523/JNEUROSCI.22-05-02012.2002. [DOI] [PMC free article] [PubMed] [Google Scholar]
- Bragin A, Wilson CL, Engel J. Spatial stability over time of brain areas generating fast ripples in the epileptic rat. Epilepsia. 2003;44:1233–1237. doi: 10.1046/j.1528-1157.2003.18503.x. [DOI] [PubMed] [Google Scholar]
- Brazier MA. Spread of seizure discharges in epilepsy: anatomical and electrophysiological considerations. Exp Neurol. 1972;36:263–272. doi: 10.1016/0014-4886(72)90022-2. [DOI] [PubMed] [Google Scholar]
- Buxton RB, Wong EC, Frank LR. Dynamics of blood flow and oxygenation changes during brain activation: the balloon model. Magn Reson Med. 1998;39:855–864. doi: 10.1002/mrm.1910390602. [DOI] [PubMed] [Google Scholar]
- Chagnac-Amitai Y, Connors BW. Horizontal spread of synchronized activity in neocortex and its control by GABA mediated inhibition. J Neurophysiol. 1989;61:747–758. doi: 10.1152/jn.1989.61.4.747. [DOI] [PubMed] [Google Scholar]
- Chen-Bee CH, Kwon MC, Masino SA, Frostig RD. Areal extent quantification of functional representations using intrinsic signal optical imaging. J Neurosci Methods. 1996;68:27–37. [PubMed] [Google Scholar]
- Chervin RD, Pierce PA, Connors BW. Periodicity and directionality in the propagation of epileptifom discharges across neocortex. J Neurophysiol. 1988;60:1695–1713. doi: 10.1152/jn.1988.60.5.1695. [DOI] [PubMed] [Google Scholar]
- Connors BW, Pinto DJ, Telfeian AE. Local pathways of seizure propagation. Int Rev Neurobiol. 2001;45:527–546. doi: 10.1016/s0074-7742(01)45027-6. [DOI] [PubMed] [Google Scholar]
- de Curtis M, Gnatkovsky V. Reevaluating the mechanisms of focal ictogenesis: the role of low-voltage fast activity. Epilepsia. 2009;50:2514–2525. doi: 10.1111/j.1528-1167.2009.02249.x. [DOI] [PubMed] [Google Scholar]
- del Zoppo GJ. The neurovascular unit in the setting of stroke. J Intern Med. 2010;267:156–171. doi: 10.1111/j.1365-2796.2009.02199.x. [DOI] [PMC free article] [PubMed] [Google Scholar]
- Demir R, Haberly LB, Jackson MB. Voltage imaging of epileptiform activity in slices from rat piriform cortex: onset and propagation. J Neurophysiol. 1998;80:2727–2742. doi: 10.1152/jn.1998.80.5.2727. [DOI] [PubMed] [Google Scholar]
- Derchansky M, Rokni D, Rick JT, Wennberg R, Bardakjian BL, Zhang L, Yarom Y, Carlen PL. Bidirectional multisite seizure propagation in the intact isolated hippocampus: the multifocality of the seizure “focus”. Neurobiol Dis. 2006;23:312–328. doi: 10.1016/j.nbd.2006.03.014. [DOI] [PubMed] [Google Scholar]
- DeSalvo MN, Schridde U, Mishra AM, Motelow JE, Purcaro MJ, Danielson N, Bai X, Hyder F, Blumenfeld H. Focal BOLD fMRI changes in bicuculline-induced tonic-clonic seizures in the rat. Neuroimage. 2010;50:902–909. doi: 10.1016/j.neuroimage.2010.01.006. [DOI] [PMC free article] [PubMed] [Google Scholar]
- Donaire A, Falcon C, Carreno M, Bargallo N, Rumia J, Setoain J, Maestro I, Boget T, Pintor L, Agudo R, et al. Sequential analysis of fMRI images: a new approach to study human epileptic networks. Epilepsia. 2009;50:2526–2537. doi: 10.1111/j.1528-1167.2009.02152.x. [DOI] [PubMed] [Google Scholar]
- Ebersole JS, Chatt AB. Laminar interactions during neocortical epileptogenesis. Brain Res. 1984;298:253–271. doi: 10.1016/0006-8993(84)91425-2. [DOI] [PubMed] [Google Scholar]
- Einevoll GT, Pettersen KH, Devor A, Ulbert I, Halgren E, Dale AM. Laminar population analysis: estimating firing rates and evoked synaptic activity from multielectrode recordings in rat barrel cortex. J Neurophysiol. 2007;97:2174–2190. doi: 10.1152/jn.00845.2006. [DOI] [PubMed] [Google Scholar]
- Farkas E, Luiten PG. Cerebral microvascular pathology in aging and Alzheimer's disease. Prog Neurobiol. 2001;64:575–611. doi: 10.1016/s0301-0082(00)00068-x. [DOI] [PubMed] [Google Scholar]
- Ferezou I, Bolea S, Petersen CC. Visualizing the cortical representation of whisker touch: voltage-sensitive dye imaging in freely moving mice. Neuron. 2006;50:617–629. doi: 10.1016/j.neuron.2006.03.043. [DOI] [PubMed] [Google Scholar]
- Gabor AJ, Scobey RP, Wehrli CJ. Relationship of epileptogenicity to cortical organization. J Neurophysiol. 1979;42:1609–1625. doi: 10.1152/jn.1979.42.6.1609. [DOI] [PubMed] [Google Scholar]
- Gajda Z, Szupera Z, Blazso G, Szente M. Quinine, a blocker of neuronal cx36 channels, suppresses seizure activity in rat neocortex in vivo. Epilepsia. 2005;46:1581–1591. doi: 10.1111/j.1528-1167.2005.00254.x. [DOI] [PubMed] [Google Scholar]
- Girouard H, Iadecola C. Neurovascular coupling in the normal brain and in hypertension, stroke, and Alzheimer disease. J Appl Physiol. 2006;100:328–335. doi: 10.1152/japplphysiol.00966.2005. [DOI] [PubMed] [Google Scholar]
- Gnatkovsky V, Librizzi L, Trombin F, de Curtis M. Fast activity at seizure onset is mediated by inhibitory circuits in the entorhinal cortex in vitro. Ann Neurol. 2008;64:674–686. doi: 10.1002/ana.21519. [DOI] [PubMed] [Google Scholar]
- Gotman J, Levtova V, Olivier A. Frequency of the electroencephalographic discharge in seizures of focal and widespread onset in intracerebral recordings. Epilepsia. 1995;36:697–703. doi: 10.1111/j.1528-1157.1995.tb01049.x. [DOI] [PubMed] [Google Scholar]
- Grenier F, Timofeev I, Steriade M. Neocortical very fast oscillations (ripples, 80-200 Hz) during seizures: intracellular correlates. J Neurophysiol. 2003;89:841–852. doi: 10.1152/jn.00420.2002. [DOI] [PubMed] [Google Scholar]
- Hufnagel A, Zentner J, Fernandez G, Wolf HK, Schramm J, Elger CE. Multiple subpial transections for control of epileptic seizures: effectiveness and safety. Epilepsia. 1997;38:678–688. doi: 10.1111/j.1528-1157.1997.tb01237.x. [DOI] [PubMed] [Google Scholar]
- Ingvar M, Soderfeldt B, Fobergrova J, Kalimo H, Olsson Y, Siesjo BK. Metabolic, circulatory, and structural alterations in the rat brain induced by sustained pentylenetetrazole seizures. Epilepsia. 1984;25:191–204. doi: 10.1111/j.1528-1157.1984.tb04176.x. [DOI] [PubMed] [Google Scholar]
- Jackson JH. Epilepsy and epileptiform convulsions. Selected writings of John Hughlings Jackson. New York: Basic Books; 1958. [Google Scholar]
- Jasper HH. Mechanisms of propagation: extracellular studies. In: Jasper HH, Ward AA, Pope A, editors. Basic mechanisms of the epilepsies. New York: Little, Brown; 1969. [Google Scholar]
- Kennerley AJ, Berwick J, Martindale J, Johnston D, Papadakis N, Mayhew JE. Concurrent fMRI and optical measures for the investigation of the hemodynamic response function. Magn Reson Med. 2005;54:354–365. doi: 10.1002/mrm.20511. [DOI] [PubMed] [Google Scholar]
- Kobayashi E, Hawco CS, Grova C, Dubeau F, Gotman J. Widespread and intense BOLD changes during brief focal electrographic seizures. Neurology. 2006;66:1049–1055. doi: 10.1212/01.wnl.0000204232.37720.a4. [DOI] [PubMed] [Google Scholar]
- Kramer MA, Eden UT, Kolaczyk ED, Zepeda R, Eskandar EN, Cash SS. Coalescence and fragmentation of cortical networks during focal seizures. J Neurosci. 2010;30:10076–10085. doi: 10.1523/JNEUROSCI.6309-09.2010. [DOI] [PMC free article] [PubMed] [Google Scholar]
- Kreisman NR, Magee JC, Brizzee BL. Relative hypoperfusion in rat cerebral cortex during recurrent seizures. J Cereb Blood Flow Metab. 1991;11:77–87. doi: 10.1038/jcbfm.1991.9. [DOI] [PubMed] [Google Scholar]
- Kutsy RL, Farrell DF, Ojemann GA. Ictal patterns of neocortical seizures monitored with intracranial electrodes: correlation with surgical outcome. Epilepsia. 1999;30:257–266. doi: 10.1111/j.1528-1157.1999.tb00702.x. [DOI] [PubMed] [Google Scholar]
- Lauritzen M, Gold L. Brain function and neurophysiological correlates of signals used in functional neuroimaging. J Neursci. 2003;23(10):3972–3980. doi: 10.1523/JNEUROSCI.23-10-03972.2003. [DOI] [PMC free article] [PubMed] [Google Scholar]
- Lecrux C, Hamel E. The neurovascular unit in brain function and disease. Acta Physiol (Oxf) 2011 doi: 10.1111/j.1748-1716.2011.02256.x. [DOI] [PubMed] [Google Scholar]
- Lees G, Stohr T, Errington AC. Stereoselective effects of the novel anticonvulsant lacosamide against 4-AP induced epileptiform activity in rat visual cortex in vitro. Neuropharmacology. 2006;50:98–110. doi: 10.1016/j.neuropharm.2005.08.016. [DOI] [PubMed] [Google Scholar]
- Lieb JP, Walsh GO, Babb TL, Walter RD, Crandall PH. A comparison of EEG seizure patterns recorded with surface and depth electrodes in patients with temporal lobe epilepsy. Epilepsia. 1976;17:137–160. doi: 10.1111/j.1528-1157.1976.tb03392.x. [DOI] [PubMed] [Google Scholar]
- Lindauer U, Dirnagl U, Fuchtemeier M, Bottiger C, Offenhauser N, Leithner C, Royl G. Pathophysiological interference with neurovascular coupling - when imaging based on hemoglobin might go blind. Front Neuroenergetics. 2010;2 doi: 10.3389/fnene.2010.00025. [DOI] [PMC free article] [PubMed] [Google Scholar]
- Logothetis NK. The underpinnings of the BOLD functional magnetic resonance imaging signal. J Neurosci. 2003;23:3963–3971. doi: 10.1523/JNEUROSCI.23-10-03963.2003. [DOI] [PMC free article] [PubMed] [Google Scholar]
- London JA, Cohen LB, Wu JY. Optical recordings of the cortical response to whisker stimulation before and after the addition of an epileptogenic agent. J Neurosci. 1989;9:2182–2190. doi: 10.1523/JNEUROSCI.09-06-02182.1989. [DOI] [PMC free article] [PubMed] [Google Scholar]
- Ma H, Zhao M, Suh M, Schwartz TH. Hemodynamic surrogates for excitatory membrane potential change during interictal epileptiform events in rat neocortex. J Neurophysiol. 2009;101:2550–2562. doi: 10.1152/jn.90694.2008. [DOI] [PMC free article] [PubMed] [Google Scholar]
- Ma HT, Wu CH, Wu JY. Initiation of spontaneous epileptiform events in the rat neocortex in vivo. J Neurophysiol. 2004;91:934–945. doi: 10.1152/jn.00274.2003. [DOI] [PMC free article] [PubMed] [Google Scholar]
- Miyakawa N, Yazawa I, Sakaki S, Momose-Sato Y, Sato K. Optical analysis of acute spontaneous epileptifom discharges in the in vivo rat cerebral cortex. Neuroimage. 2003;18:622–632. doi: 10.1016/s1053-8119(02)00056-3. [DOI] [PubMed] [Google Scholar]
- Nersesyan H, Herman P, Erdogan E, Hyder F, Blumenfeld H. Relative changes in cerebral blood flow and neuronal activity in local microdomains during generalized seizures. J Cereb Blood Flow Metab. 2004;9:1057–1068. doi: 10.1097/01.WCB.0000131669.02027.3E. [DOI] [PubMed] [Google Scholar]
- Nicholson C, Freeman JA. Theory of current source-density analysis and determination of conductivity tensor for anuran cerebellum. J Neurophysiol. 1975;38:356–368. doi: 10.1152/jn.1975.38.2.356. [DOI] [PubMed] [Google Scholar]
- Ojemann GA. Surgical therapy for medically intractable epilepsy. J Neurosurg. 1987;66:489–499. doi: 10.3171/jns.1987.66.4.0489. [DOI] [PubMed] [Google Scholar]
- Pacia SV, Ebersole JS. Intracranial EEG substrates of scalp ictal patterns from temporal lobe foci. Epilepsia. 1997;38:642–654. doi: 10.1111/j.1528-1157.1997.tb01233.x. [DOI] [PubMed] [Google Scholar]
- Pereira de Vasconcelos A, Ferrandon A, Nehlig A. Local cerebral blood flow during lithium-pilocarpine seizures in the developing and adult rat: role of coupling between blood flow and metabolism in the genesis of neuronal damage. J Cereb Blood Flow Metab. 2002;22:196–205. doi: 10.1097/00004647-200202000-00007. [DOI] [PubMed] [Google Scholar]
- Pettersen KH, Devor A, Ulbert I, Dale AM, Einevoll GT. Current-source density estimation based on inversion of electrostatic forward solution: effects of finite extent of neuronal activity and conductivity discontinuities. J Neurosci Methods. 2006;154:116–133. doi: 10.1016/j.jneumeth.2005.12.005. [DOI] [PubMed] [Google Scholar]
- Pinard E, Tremblay E, Ben-Ari Y, Seylaz J. Blood flow compensates oxygen demand in the vulnerable CA3 region of the hippocampus during kainate-induced seizures. Neuroscience. 1984;13:1039–1049. doi: 10.1016/0306-4522(84)90287-2. [DOI] [PubMed] [Google Scholar]
- Pinto DJ, Patrick SL, Huang WC, Connors BW. Initiation, propagation, and termination of epileptiform activity in rodent neocortex in vitro involve distinct mechanisms. J Neurosci. 2005;25:8131–8140. doi: 10.1523/JNEUROSCI.2278-05.2005. [DOI] [PMC free article] [PubMed] [Google Scholar]
- Rossier J. Wiring and plumbing in the brain. Front Hum Neurosci. 2009;3:2. doi: 10.3389/neuro.09.002.2009. [DOI] [PMC free article] [PubMed] [Google Scholar]
- Rothman SM. The therapeutic potential of focal cooling for neocortical epilepsy. Neurotherapeutics. 2009;6:251–257. doi: 10.1016/j.nurt.2008.12.002. [DOI] [PMC free article] [PubMed] [Google Scholar]
- Salek-Haddadi A, Merschhemke M, Lemieux L, Fish DR. Simultaneous EEG-correlated ictal fMRI. Neuroimage. 2002;16:32–40. doi: 10.1006/nimg.2002.1073. [DOI] [PubMed] [Google Scholar]
- Schevon CA, Ng SK, Cappell J, Goodman RR, McKhann G, Jr, Waziri A, Branner A, Sosunov A, Schroeder CE, Emerson RG. Microphysiology of epileptiform activity in human neocortex. J Clin Neurophysiol. 2008;25:321–330. doi: 10.1097/WNP.0b013e31818e8010. [DOI] [PMC free article] [PubMed] [Google Scholar]
- Schwartz TH, Bonhoeffer T. In vivo optical mapping of epileptic foci and surround inhibition in ferret cerebral cortex. Nat Med. 2001;7:1063–1067. doi: 10.1038/nm0901-1063. [DOI] [PubMed] [Google Scholar]
- Sheth SA, Nemoto M, Guiou G, Walker M, Pouratian N, Toga AW. Linear and nonlinear relationships between neuronal activity, oxygen metabolism, and hemodynamic response. Neuron. 2004;42:347–355. doi: 10.1016/s0896-6273(04)00221-1. [DOI] [PubMed] [Google Scholar]
- Shoham D, Glaser DE, Arieli A, Kenet T, Wijnbergen C, Toledo Y, Hildesheim R, Grinvald A. Imaging cortical dynamics at high spatial and temporal resolution with novel blue voltage-sensitive dyes. Neuron. 1999;24:791–802. doi: 10.1016/s0896-6273(00)81027-2. [DOI] [PubMed] [Google Scholar]
- Silva LR, Amitai Y, Connors B. Intrinsic oscillation of neocortex generated by layer 5 pyramidal neurons. Science. 1991;251:432–435. doi: 10.1126/science.1824881. [DOI] [PubMed] [Google Scholar]
- Sirotin YB, Hillman EM, Bordier C, Das A. Spatiotemporal precision and hemodynamic mechanism of optical point spreads in alert primates. Proc Natl Acad Sci U S A. 2009;106:18390–18395. doi: 10.1073/pnas.0905509106. [DOI] [PMC free article] [PubMed] [Google Scholar]
- Slovin H, Arieli A, Hildesheim R, Grinvald A. Long-term voltage-sensitive dye imaging reveals cortical dynamics in behaving monkeys. J Neurophysiol. 2002;88:3421–3438. doi: 10.1152/jn.00194.2002. [DOI] [PubMed] [Google Scholar]
- Spencer SS, Guimaraes P, Kim J, Spencer DD. Morphological patterns of seizures recorded intracranially. Epilepsia. 1992;33:537–545. doi: 10.1111/j.1528-1157.1992.tb01706.x. [DOI] [PubMed] [Google Scholar]
- Suh M, Bahar S, Mehta AD, Schwartz TH. Temporal dependence in uncoupling of blood volume and oxygenation during interictal epileptiform events in rat neocortex. J Neurosci. 2005;25:68–77. doi: 10.1523/JNEUROSCI.2823-04.2005. [DOI] [PMC free article] [PubMed] [Google Scholar]
- Sutor B, Hablitz JJ, Rucker F, Bruggencate G. Spread of epileptiform activity in the immature rat neocortex studied with voltage-sensitive dyes and laser scanning microscopy. J Neurophys. 1994;4:1756–1768. doi: 10.1152/jn.1994.72.4.1756. [DOI] [PubMed] [Google Scholar]
- Szente BM, Baranyi A. Mechanism of aminopyridine-induced ictal seizure activity in the cat neocortex. Brain Res. 1987;41:386–1373. doi: 10.1016/0006-8993(87)91031-6. [DOI] [PubMed] [Google Scholar]
- Tanaka S, Sako K, Tanaka T, Nishihara I, Yonemasu Y. Uncoupling of local blood flow and metabolism in the hippocampal CA3 kainic acid-induced limbic seizure status. Neurosci. 1990;36:339–348. doi: 10.1016/0306-4522(90)90430-c. [DOI] [PubMed] [Google Scholar]
- Tao JX, Baldwin M, Hawes-Ebersole S, Ebersole JS. Cortical substrates of scalp EEG epileptiform discharges. J Clin Neurophysiol. 2007;24:96–100. doi: 10.1097/WNP.0b013e31803ecdaf. [DOI] [PubMed] [Google Scholar]
- Telfian AE, Connors BW. Layer-specific pathways for the horizontal propagation of epileptiorm discharges in neocortex. Epilepsia. 1998;39:700–708. doi: 10.1111/j.1528-1157.1998.tb01154.x. [DOI] [PubMed] [Google Scholar]
- Thornton R, Laufs H, Rodionov R, Cannadathu S, Carmichael DW, Vulliemoz S, Salek-Haddadi A, McEvoy AW, Smith SM, Lhatoo S, et al. EEG correlated functional MRI and postoperative outcome in focal epilepsy. J Neurol Neurosurg Psychiatry. 2010;81:922–927. doi: 10.1136/jnnp.2009.196253. [DOI] [PubMed] [Google Scholar]
- Timofeev I, Steriade M. Neocortical seizures: initiation, development and cessation. Neuroscience. 2004;123:299–336. doi: 10.1016/j.neuroscience.2003.08.051. [DOI] [PubMed] [Google Scholar]
- Trevelyan AJ, Sussillo D, Watson BO, Yuste R. Modular propagation of epileptiform activity: evidence for an inhibitory veto in neocortex. J Neurosci. 2006;26:12447–12455. doi: 10.1523/JNEUROSCI.2787-06.2006. [DOI] [PMC free article] [PubMed] [Google Scholar]
- Trevelyan AJ, Sussillo D, Yuste R. Feedforward inhibition contributes to the control of epileptiform propagation speed. J Neurosci. 2007;27:3383–3387. doi: 10.1523/JNEUROSCI.0145-07.2007. [DOI] [PMC free article] [PubMed] [Google Scholar]
- Trevelyan AJ, Yuste R. Feedforward inhibition contributes to control of epileptiform propagation speed. J Neurosci. 2007;27:3383–3387. doi: 10.1523/JNEUROSCI.0145-07.2007. [DOI] [PMC free article] [PubMed] [Google Scholar]
- Truccolo W, Donoghue JA, Hochberg LR, Eskandar EN, Madsen JR, Anderson WS, Brown EN, Halgren E, Cash SS. Single-neuron dynamics in human focal epilepsy. Nat Neurosci. 2011;14:635–641. doi: 10.1038/nn.2782. [DOI] [PMC free article] [PubMed] [Google Scholar]
- Tsau Y, Guan L, Wu JY. Initiation of spontaneous epileptiform activity in the neocortical slice. J Neurophysiol. 1998;80:978–982. doi: 10.1152/jn.1998.80.2.978. [DOI] [PubMed] [Google Scholar]
- Tsau Y, Guan L, Wu JY. Epileptiform activity can be initiated in various neocortical layers: an optical imaging study. J Neurophysiol. 1999;82:1965–1973. doi: 10.1152/jn.1999.82.4.1965. [DOI] [PubMed] [Google Scholar]
- Tyvaert L, Chassagnon S, Sadikot A, LeVan P, Dubeau F, Gotman J. Thalamic nuclei activity in idiopathic generalized epilepsy: an EEG-fMRI study. Neurology. 2009;73:2018–2022. doi: 10.1212/WNL.0b013e3181c55d02. [DOI] [PubMed] [Google Scholar]
- Wadman WJ, Gutnick MJ. Non-uniform propagation of epileptiform discharge in brain slices of rat neocortex. Neurosci. 1993;52:255–262. doi: 10.1016/0306-4522(93)90154-8. [DOI] [PubMed] [Google Scholar]
- Wendling F, Bartolomei F, Bellanger JJ, Bourien J, Chauvel P. Epileptic fast intracerebral EEG activity: evidence for spatial decorrelation at seizure onset. Brain. 2003;126:1449–1459. doi: 10.1093/brain/awg144. [DOI] [PMC free article] [PubMed] [Google Scholar]
- Wennberg R, Arruda F, Quesney LF, Olivier A. Preeminence of extrahippocampal structures in the generation of mesial temporal seizures: evidence from human depth electrode recordings. Epilepsia. 2002;43:716–726. doi: 10.1046/j.1528-1157.2002.31101.x. [DOI] [PubMed] [Google Scholar]
- Wong BY, Prince DA. The lateral spread of ictal discharges in neocortical brain slices. Epilepsy Res. 1990;7:29–39. doi: 10.1016/0920-1211(90)90051-v. [DOI] [PubMed] [Google Scholar]
- Woolsey TA, Rovainen CM, Cox SB, Henegar MH, Liang GE, Liu D, Moskalenko YE, Sui J, Wei L. Neuronal units linked to microvascular modules in cerebral cortex: response elements for imaging the brain. Cereb Cortex. 1996;6:647–660. doi: 10.1093/cercor/6.5.647. [DOI] [PubMed] [Google Scholar]
- Yuste R, Tank DW, Kleinfeld D. Functional study of the rat cortical microcircuitry with voltage-sensitive dye imaging of neocortical slices. Cereb Cortex. 1997;7:546–558. doi: 10.1093/cercor/7.6.546. [DOI] [PubMed] [Google Scholar]
- Zaveri HP, Pincus SM, Goncharova, Duckrow RB, Spencer DD, Spencer SS. Localization-related epilepsy exhibits significant connectivity away from the seizure-onset area. Neuroreport. 2009;20:891–895. doi: 10.1097/WNR.0b013e32832c78e0. [DOI] [PubMed] [Google Scholar]
- Zhao M, Ma H, Suh M, Schwartz TH. Spatiotemporal dynamics of perfusion and oximetry during ictal discharges in the rat neocortex. J Neurosci. 2009;29:2814–2823. doi: 10.1523/JNEUROSCI.4667-08.2009. [DOI] [PMC free article] [PubMed] [Google Scholar]
- Zhao M, Nguyen J, Ma H, Nishimura N, Schaffer CB, Schwartz TH. Preictal and ictal neurovascular and metabolic coupling surrounding a seizure focus. J Neurosci. 2011;31:13292–13300. doi: 10.1523/JNEUROSCI.2597-11.2011. [DOI] [PMC free article] [PubMed] [Google Scholar]
- Zhao M, Suh M, Ma H, Perry C, Geneslaw A, Schwartz TH. Focal increases in perfusion and decreases in hemoglobin oxygenation precede seizure onset in spontaneous human epilepsy. Epilepsia. 2007;48:2059–2067. doi: 10.1111/j.1528-1167.2007.01229.x. [DOI] [PubMed] [Google Scholar]
- Zlokovic BV. Neurovascular mechanisms of Alzheimer's neurodegeneration. Trends Neurosci. 2005;28:202–208. doi: 10.1016/j.tins.2005.02.001. [DOI] [PubMed] [Google Scholar]