

Abstract
Although the left posterior occipitotemporal sulcus (pOTS) has been called a visual word form area, debate persists over the selectivity of this region for reading relative to general nonorthographic visual object processing. We used high-resolution functional magnetic resonance imaging to study left pOTS responses to combinatorial orthographic and object shape information. Participants performed naming and visual discrimination tasks designed to encourage or suppress phonological encoding. During the naming task, all participants showed subregions within left pOTS that were more sensitive to combinatorial orthographic information than to object information. This difference disappeared, however, when phonological processing demands were removed. Responses were stronger to pseudowords than to words, but this effect also disappeared when phonological processing demands were removed. Subregions within the left pOTS are preferentially activated when visual input must be mapped to a phonological representation (i.e., a name) and particularly when component parts of the visual input must be mapped to corresponding phonological elements (consonant or vowel phonemes). Results indicate a specialized role for subregions within the left pOTS in the isomorphic mapping of familiar combinatorial visual patterns to phonological forms. This process distinguishes reading from picture naming and accounts for a wide range of previously reported stimulus and task effects in left pOTS.
Keywords: fMRI, object perception, orthography, phonology, visual word form area
Introduction
Evidence has accumulated in recent decades suggesting a critical role for the left occipitotemporal cortex in reading. Damage to this region causes a relatively isolated visual word recognition deficit (Binder and Mohr 1992; Sakurai et al. 2000; Leff et al. 2001; Cohen et al. 2003), suggesting a critical role for this brain region in rapid and efficient visual recognition of letters and letter combinations (Warrington and Shallice 1980; Fiset et al. 2005; Starrfelt et al. 2009). This view is supported by functional neuroimaging evidence for a region in the left ventrolateral occipitotemporal cortex that is especially responsive to visually presented words (Cohen et al. 2000,; 2002; Polk and Farah 2002). This region is centered in or near the left posterior occipitotemporal sulcus (pOTS) separating the fusiform and inferior temporal gyri. It responds more strongly to words and word-like letter strings (pseudowords) than to random letter strings and unfamiliar characters, suggesting a role in recognizing familiar orthographic forms. This convergence of neuropsychological and functional neuroimaging evidence thus led to the designation of this region as the “visual word form area” (VWFA).
Central to this claim of functional specialization is the fact that written languages exhibit combinatorial structure. All orthographies make use of a limited inventory of graphemic units, as in the Latin alphabet or Japanese Kana syllabary, which are combined to form a much larger vocabulary of words. Constraints on how the elements combine create varying degrees of perceptual familiarity and redundancy. In alphabetic orthographies, for example, some letter combinations (e.g., final “tion” in English) are frequent and perceptually familiar, while others (“rgdk”) never occur. The use of this information in reading is demonstrated by phenomena such as the word superiority effect (Reicher 1969), in which letters embedded in words (such as S in the English word FLASH) or in word-like letter strings (S in FRISH) are more efficiently recognized than letters embedded in unfamiliar letter strings (S in RFHSL). Thus, skilled readers possess extensive knowledge of the statistical properties of their orthography and depend on this combinatorial orthographic information for rapid and efficient visual word recognition.
The relatively recent introduction of written language to human culture, and the fact that reading is an acquired skill not universally practiced, makes it very unlikely that the left pOTS is genetically specified to support reading. Proponents of the VWFA specialization model argue instead that this region of high-level visual cortex attains expertise in processing familiar letter sequences through frequent exposure and perceptual “tuning” (Dehaene et al. 2005; Binder et al. 2006). According to this theory, the area evolved in response to other visual perceptual problems similar to those posed by orthographic stimuli—perhaps involving specific aspects of foveated shape recognition (Hasson et al. 2002; Starrfelt and Gerlach 2007)—and becomes further specialized in literate individuals through extensive experience with written text.
The VWFA concept has been a focus of considerable debate, however (for recent discussions, see Dehaene and Cohen 2011; Price and Devlin 2011). Some authors have rejected the notion of a specific role for this area in reading, citing numerous functional imaging studies in which activation in the left pOTS was at least as strong to pictured objects as to words (Sevastianov et al. 2002; Price and Devlin 2003; Price et al. 2006; Wright et al. 2008). These authors proposed an alternative model in which the left pOTS serves a more general role in linking visual information with phonological and semantic codes (Price and Devlin 2003; Sandak et al. 2004; Devlin et al. 2006). Rather than being a visual perceptual area driven mainly by bottom-up sensory input, this area is thought to be highly sensitive to task demands and is engaged whenever a visual percept must be named. Proponents of the VWFA specialization view counter that the equivalent responses to words and pictures in these studies could be an artifact of poor spatial resolution. Given the morphological and functional variability that exists between individual brains, spatial smoothing, and standard registration techniques used in creating group activation maps could result in merging of adjacent functionally distinct activations (Cohen and Dehaene 2004; Schwarzlose et al. 2005). Indeed, other studies have shown small foci in or near the usual VWFA coordinates with stronger responses to words than to pictures (Hasson et al. 2002; Reinholz and Pollmann 2005; Baker et al. 2007; Ben-Shachar et al. 2007; Szwed et al. 2011). Wright et al. (2008) present a critique of some of these latter findings, however, questioning whether their location truly matches the VWFA, and citing potential confounds arising from differences in processing strategies (phonological vs. visual) for words and pictures. Thus, the question of whether any part of the left pOTS responds more to words than to pictures remains unresolved.
Also unresolved is the related question of whether left pOTS activation is modulated mainly by stimulus characteristics or by task demands. According to the standard VWFA model, the left pOTS is a visual region modulated mainly by characteristics of the visual input, whereas an opposing view posits that the left pOTS serves to link visual input with higher linguistic codes and is modulated by linguistic demands of the task. A third possibility is that both stimulus type and task demands have an influence because the task of naming orthographic input (i.e., oral reading) is substantially different from the task of naming pictures. In the case of oral reading, there is a regular or quasi-regular correspondence between component visual and phonological elements, which is not the case with picture naming.
We obtained firm evidence on these issues using a controlled comparison of orthographic and nonorthographic picture stimuli under 2 very different task conditions. The orthographic and picture stimuli were each compared with visual control conditions to remove any effects due to differences in low-level stimulus properties (Szwed et al. 2011). Orthographic stimuli consisted of words and pronounceable pseudowords, all of which contain familiar letter sequences to which the VWFA is purported to be sensitive. Consonant strings provide an ideal visual control for these stimuli, isolating the combinatorial orthographic processes of interest. Nonorthographic stimuli consisted of line drawings of objects and unrecognizable “scrambled” versions of these drawings (Fig. 1A). Although such scrambled pictures have often been used as a visual control in object perception studies, the visual similarity between pictures and scrambled pictures is not as great as the visual similarity between words and consonant strings. The stimulus materials thus allow for a strong test of the orthographic specialization hypothesis: For this hypothesis to be supported, subregions within the left pOTS must show a stronger response to combinatorial orthographic input (words and pseudowords > consonant strings) than to object input (pictures > scrambled pictures) even though the former contrast is more tightly controlled in terms of physical stimulus attributes. The inclusion of within-category visual controls is critical. A direct contrast between words/pseudowords and pictures does not specifically identify the cognitive process of interest (combinatorial orthographic processing). Activation from such a contrast could be due to combinatorial orthographic processing or to a preference for low-level visual features of letters, in which case consonant strings would be equally effective (see Baker et al. 2007). The question addressed here, however, is whether the left pOTS is engaged more during the processing of combinatorial orthographic information compared with the processing of object-specific information. The difference between these 2 specific processes cannot, in theory, be captured by a word/pseudoword versus picture contrast. Including within-category visual controls (i.e., consonants, scrambled pictures) is critical for isolating these higher level processes.
Figure 1.

(A) Examples of intact and scrambled pictures. (B) Examples of the Brightness task stimuli.
To minimize the chances that regional specialization would be obscured by intravoxel averaging, spatial smoothing, and individual variability, we used high-resolution imaging techniques and confined the analyses to the individual participant level without spatial smoothing or group averaging. Although such methods can suffer from insufficient signal relative to noise, we compensated for this by scanning participants twice to increase power at the single-subject level and by constraining the analysis to individual cortical surfaces.
Manipulation of task demands is critical for understanding the processing role of the left pOTS. Although several previous VWFA studies included task manipulations (Dehaene et al. 2001; Reinholz and Pollmann 2005; Baker et al. 2007; Starrfelt and Gerlach 2007; Wright et al. 2008), none has provided a strong manipulation of phonological processing demands. The present study included a standard Naming task, which requires mapping from a visual input to a phonological representation, and a difficult visual discrimination task, which we reasoned would suppress phonological mapping by monopolizing attentional resources. In the visual discrimination (Brightness) task, participants had to discriminate between standard “bright” and “not bright” versions of the stimuli, the latter selected from a perceptual continuum (Fig. 1B) using an adaptive algorithm that maintained accuracy near 75%. If the left pOTS is a high-level sensory area tuned to particular types of visual input, its response pattern should be similar across both tasks. If, on the other hand, the role of the left pOTS is to link visual with high-level linguistic codes, it should be strongly modulated by task demands and not by stimulus category.
Finally, the study included both words and pseudowords to clarify how orthographic information is represented in this region. Stronger activation of the left pOTS during naming of pseudowords compared with words has been reported in several previous studies and interpreted as evidence for processing of whole-word visual codes (Kronbichler et al. 2004; Kronbichler et al. 2007; Bruno et al. 2008; Schurz et al. 2010). Because these codes are visual, this model predicts little or no modulation of the pseudoword–word difference across tasks. Suppression of this lexicality effect during the visual discrimination task would suggest that the effect is arising at a higher level, reflecting essential differences in the phonological processing of words and pseudowords.
Materials and Methods
Participants
Participants were 8 healthy literate adults (3 females), age 22–36 years, with no history of neurological or psychiatric disease. All were right handed (handedness quotient ≥ 70) on the Edinburgh handedness inventory (Oldfield 1971), spoke English as a first language, and had normal or corrected-to-normal vision. Years of education ranged from 16 to 20 (M = 17.5). IQ estimates from the Shipley Institute of Living Scale (Paulson and Lin 1970) ranged from 99 to 107 (M = 104). Participants provided written informed consent and were paid an hourly stipend. The protocols were approved by institutional review boards of the University of Wisconsin—Milwaukee and the Medical College of Wisconsin.
Stimuli
The stimuli included English words, pseudowords, consonant letter strings, object pictures, and scrambled object pictures. There were 160 items in each stimulus category. Words were concrete nouns ranging in length from 3 to 6 letters (e.g., car, bird, house, jacket) selected from the names of objects in the Snodgrass–Vanderwart standardized picture set (Snodgrass and Vanderwart 1980). These represented various semantic categories, including animals, fruits, vegetables, vehicles, musical instruments, tools, and clothing. Pseudowords were generated using MCWord (Medler and Binder 2005), an online tool for orthographic analysis and letter string generation. The algorithm used a Markov chain procedure based on position-specific English trigram statistics from the CELEX database (Baayen et al. 1995). Chaining based on trigram statistics guarantees that the pseudowords have word-like orthographic characteristics (e.g., dar, kife, nence, glouse). The pseudoword set matched the word set on length, orthographic neighborhood size, and position-constrained bigram and trigram frequencies (Table 1). Consonant strings were randomly generated using MCWord, with no frequency or positional weighting, and were orthographically illegal and unpronounceable (e.g., klj, zvfw, dcmdb, sbmhjp). A custom sans serif font for stimulus display was created using FontForge (http://fontforge.sourceforge.net/), which enabled precise control over letter size and spacing. Alphabetic stimuli were presented in white lowercase font on a black background and subtended a mean visual angle of 1.98° wide × 1.30° high in the scanner.
Table 1.
Mean (SD) statistics for the alphabetic stimuli
| WRD | PSD | CON | |
| #Letters | 4.6 (1.0) | 4.6 (1.0) | 4.5 (1.0) |
| #Syllables | 1.3 (0.5) | 1.3 (0.6) | n/a |
| Frequency | 49 (108) | n/a | n/a |
| ON | 6.8 (6.1) | 6.3 (5.4) | 0.2 (0.9) |
| BGF | 1538 (1560) | 1448 (919) | 1 (5) |
| TGF | 204 (276) | 220 (294) | 0 (0) |
Note: WRD = word, PSD = pseudoword, CON = consonant strings, n/a = not applicable. All statistics are based on the CELEX database of English orthography (Baayen et al. 1995). Frequency indicates the orthographic frequency of the string per million words of text. ON indicates the number of orthographic neighbors of the string based on Coltheart's N statistic (Coltheart et al. 1977). BGF indicates mean position-constrained frequency (per million) of the bigrams in the string. TGF indicates mean position-constrained trigram frequency. All differences (other than Frequency) between words and pseudowords are nonsignificant (P > 0.1).
Picture stimuli were digitized grayscale line drawings from the Snodgrass and Vanderwart (1980) set that corresponded to the items in the word set. Using pictures and their corresponding names ensured that these conditions were matched on associated phonological and lexical–semantic content. The width in pixels of the pictures was adjusted to match the mean and standard deviation (SD) of the alphabetic stimuli (picture: M = 96, SD = 26; alphabetic stimuli: M = 95, SD = 23). Scrambled versions of each picture were generated with a custom MATLAB script that divided each image into 7 × 7 tiles and, for each tile, collectively rotated all pixels in the tile that were not white by a random amount about the center of the tile (Fig. 1A). This process preserves the dimensions and coarse shape of the object but disrupts feature and contour lines and renders the object unrecognizable. Grayscale values of the pictures and scrambled pictures were inverted, resulting in white lines on a black background. Presentation in the scanner resulted in mean visual angle dimensions of 1.97° wide × 1.97° high. Stimulus presentation was controlled using E-Prime (Psychology Software Tools, Inc., Pittsburgh, PA). Stimuli were projected on a screen behind the participant's head and viewed using a tilting mirror located approximately 10 cm from the eyes. Lights in the scanner room were extinguished throughout the session.
Tasks
Naming Task
Participants performed 2 tasks: overt naming and brightness judgment. In the Naming task, participants read words and pseudowords aloud and named picture stimuli aloud as quickly and accurately as possible. For the control items (consonant strings, scrambled pictures), participants said “junk” to control for motor and auditory processes engaged by naming. An asterisk was present in the center of the display between experimental trials, which participants were asked to fixate. Each trial began with a 250-ms blank screen, followed by presentation of an experimental stimulus for 500 ms, followed by another 250-ms blank screen. A fixation asterisk was then presented in the center of the display during an interstimulus interval that varied randomly from 3 to 15 s (mean 5 s). Vocal responses were digitally recorded using an MRI-compatible microphone. Tones marking the onset of each stimulus (not audible to the participant) were recorded in a separate audio channel. The vocal recording was filtered off-line using an algorithm that subtracts a moving window average of the scanner noise (www.mrc-cbu.cam.ac.uk/∼rhodri/scannernoisecancellation/). Responses were phonetically transcribed and scored for accuracy. Vocal RTs were estimated by manually measuring the time interval between stimulus onset and onset of the response.
Brightness Task
The brightness judgment (Brightness) task was designed to focus participants' attention on a nonlinguistic characteristic of the stimuli and thereby minimize linguistic processing. Participants were informed that half of the stimuli would be “bright” and were asked to decide whether each stimulus was “bright” or “not bright”. Brightness was manipulated using a global scaling factor applied to the image grayscale values (Fig. 1B), and the difficulty of the task was adjusted in real time using a staircase procedure (see below). Participants indicated their decision using a 2-key response device operated with the right hand. The keys used for “bright” and “not bright” were counterbalanced across participants and across scanning sessions for each participant.
Subjective brightness of a grayscale image can be affected not only by overall luminance but also by retinal size, line thickness, image complexity, and other factors. We therefore conducted a norming study to obtain standardized brightness values for each of the 800 stimuli. Participants (n = 12), none of whom were in the functional magnetic resonance imaging (fMRI) study, viewed a reference image (a 3 × 3 grid of contiguous squares) composed of pixels with a grayscale value of 180 (0 = black, 255 = white). On each trial, presentation of this reference image for 500 ms alternated every 2 s with presentation of a test stimulus for 500 ms. Participants were tasked with repeatedly adjusting the grayscale value of the test image—using a slider bar located at the bottom of the screen—until it matched the perceived brightness of the reference image. Adjusted grayscale values were acquired for each stimulus, then averaged across participants to obtain a new standardized grayscale value for each stimulus. Standardized values for individual stimuli ranged from 102 to 174.
The standardized grayscale value for each stimulus (matched in brightness to the reference grid) defined the “bright” grayscale value for that stimulus in the fMRI experiment. Half of the stimuli in each category were presented using these values, while the other half were presented at 1 of 10 possible fractions of this value, ranging from 95% to 50% in 5% steps. For example, a word with a “bright” grayscale value of 140 had “not bright” versions with values of 133, 126, 119, 112, and so on. A staircase algorithm maintained accuracy levels near 75% by evaluating the participant's performance during the task every 4 trials and adjusting the stimuli selected for the not bright condition accordingly. For example, if the participant's accuracy was less than 75%, then the difference in brightness between “bright” and “not bright” items was increased by 5%. A pilot study using these stimuli and the staircase algorithm in 10 participants tested outside the scanner (none of whom were in the fMRI study) showed mean accuracy across all conditions of 73%, with no effect of condition on accuracy (F4,6 = 2.19, P = 0.186) or RT (F4,6 = 1.18, P = 0.407).
MRI Acquisition
MRI data were acquired using a GE Excite 3-T scanner with an 8-channel head coil. T2*-weighted functional imaging used a gradient echo echo-planar imaging (EPI) sequence (time echo [TE] = 25 ms, time repetition [TR] = 2000 ms, flip angle = 77°, field of view = 192 mm, pixel matrix = 96 × 96). Volumes were composed of 24 axially oriented, contiguous slices of 2 mm thickness (voxel size = 2.0 × 2.0 × 2.0 mm). The field of view extended 48 mm in the z direction and was positioned to cover bilateral basal occipitotemporal cortex, including the entire depth of the collateral and occipitotemporal sulci, as well as the superior temporal lobe, portions of the inferior parietal lobe, and the inferior frontal lobe. Anatomical images of the whole brain were obtained using a T1-weighted spoiled-gradient echo sequence (SPGR; TE = 3.9, TR = 9500 ms, flip angle = 12°, number of excitations [NEX] = 1, voxel size = 0.81 × 0.81 × 1.0 mm).
Participants were scanned in 2 separate sessions, each lasting approximately 2 h. We assumed that detection of target effects would be difficult because of the large number of stimulus conditions, limited number of data points per condition, and expected small effect sizes. Thus, the purpose of scanning over 2 sessions was to increase statistical power (Huettel and McCarthy 2001) rather than to assess test–retest reliability, as we assumed a priori that statistical power would be low for a single session. To assess the improvement in detection obtained by averaging over the 2 sessions, we calculated the proportion of activated nodes in the pOTS for each major contrast (described below), separately for each session and for the 2 sessions combined. Self-reported alertness ratings (scaled “1–10”: 1 = sleepy, 10 = fully awake) were acquired after each functional run to ensure participant wakefulness. A minimum of 45 days passed between scanning sessions to attenuate practice effects. Both experimental tasks (Naming and Brightness) were administered in each scanning session, with order counterbalanced within and between subjects. Each task was presented as a series of 4 functional runs, with 216 image volumes collected per run. Each functional run presented a total of 100 stimuli (20 from each of the 5 stimulus categories), totaling 400 stimuli across 4 functional runs (80 from each of the 5 stimulus categories). Of the 160 stimuli in each stimulus category, half were presented in the Naming task and half in the Brightness task at each session, and no stimulus was presented twice in the same scanning session. The order in which a given stimulus first appeared as a picture or as a word and in the Naming task or the Brightness task was counterbalanced across participants.
fMRI Data Analysis
Image preprocessing included slice-timing correction, rigid body registration of the EPI time series, registration of the EPI time series to the T1 anatomy, and third-order polynomial detrending, all done with AFNI (http://afni.nimh.nih.gov/afni). EPI data from both scanning sessions were registered to the anatomical image acquired in the first session using align_epi_anat.py (Saad et al. 2009).
All EPI data for each task were concatenated (864 volumes × 2 scanning sessions = 1728 volumes per task) and treated to within-subject fixed-effects analyses using voxelwise multiple linear regression in AFNI. The data were modeled using an event-related design. Translation and rotation movement parameters estimated during image registration were included to remove variance associated with motion-related signal changes. Hemodynamic regressors were created by convolving impulse functions representing each trial onset with a canonical hemodynamic response function and its temporal derivative. Regressors of interest coded the events in each of the 5 stimulus conditions (Word, Pseudoword, Consonants, Picture, Scrambled Picture). Error trials in the Naming task were coded as such and treated as a separate condition of no interest. A global RT regressor was created by convolving the mean-centered RT for each trial with the canonical hemodynamic response function. This approach removes variation both within and between conditions that can be explained by a linear function of RT (Binder et al. 2006; Graves et al. 2010). Including RT in the model allows for a more conservative interpretation of stimulus-specific activation, in that activation that remains after removing variance due to RT is less likely to be due to domain-general task performance processes (e.g., effort, attention, time on task).
Effects of interest were examined using general linear tests in each participant. Combinatorial orthographic processing was modeled as the difference between orthographically legal and illegal strings: [Word + Pseudoword] − [2 * Consonants]. Collapsing the Word and Pseudoword conditions tests for an average effect of orthographic structure independent of lexical or semantic processing (Polk and Farah 2002; Mechelli et al. 2003). Separate contrasts for Word − Consonants and Pseudoword − Consonants were also performed. The lexicality effect was modeled as Pseudoword − Word. Activity associated with high-level object perception was modeled as Picture − Scrambled Picture. The difference between combinatorial orthographic and object perception processes was modeled as [(Word + Pseudoword) − (2 * Consonants)] − [Picture − Scrambled Picture]. As discussed above, this last model directly assesses for differences in processing combinatorial orthographic information compared with processing nonorthographic object information.
Surface Mapping and Statistical Thresholds
Surface models of each individual brain were created from the T1 anatomical volumes using FreeSurfer (http://surfer.nmr.mgh.harvard.edu/). A cortical patch covering the lateral and ventral temporal and occipital lobes and the posterior inferior parietal lobe was cut for each hemisphere in each participant (Fig. 2A–C). Three major sulci were identified on the unfolded patches to assist with anatomical localization. These included the superior temporal sulcus (STS), the OTS, and the collateral sulcus, all of which were consistently identified on sulcal depth maps (Fig. 2D,E) (Lohmann et al. 2008).
Figure 2.
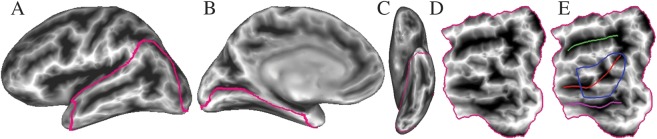
Cortical patch and anatomical landmarks. (A–C) Lateral, medial, and ventral views of an inflated surface from 1 participant, with sulcal depth coded at each surface node. The posterior cortical ROI is outlined. (D) Flattened patch view of the ROI. (E) Anatomical landmarks: green = STS, red = OTS, magenta = collateral sulcus, blue = pOTS ROI.
Given our a priori focus on the left pOTS, a surface-based region of interest (ROI) was defined around the posterior two-thirds of the left pOTS in each participant (Fig. 2E). The ventromedial boundary of this ROI followed the crest of the fusiform gyrus and the dorsolateral boundary followed the inferior temporal sulcus. For those participants with bifurcated fusiform gyri, the ventromedial boundary followed the most medial crest. This ROI served 2 purposes. First, it allowed the relative spatial extent of left pOTS activation to be calculated for each contrast, in each task, and in each participant by computing the proportion of surface nodes activated above the statistical threshold. These values were used to test for task effects, wherein activation extent in the ROI for a given contrast is hypothesized to be reliably larger in 1 task. Activation extent was selected as the dependent variable because the 2 tasks were performed in different imaging runs and required very different cognitive sets. These differences could lead to differences in the underlying state or “baseline” that would invalidate direct voxelwise comparisons. Second, the ROI allowed a less severe correction for familywise error to be used in the “orthography–object perception” contrast, for which our a priori hypothesis concerned only the left pOTS. All sulcal identification and ROI tracing were performed blind to the activation maps.
Individual z-score maps from the general linear contrast analyses were then projected onto the surfaces using SUMA (http://afni.nimh.nih.gov/afni/suma). To correct for multiple comparisons on a 2D surface, a custom MATLAB script was used to estimate the chance probability of spatially contiguous clusters of nodes surviving a threshold of P < 0.05 based on Monte Carlo simulations. Separate simulations were performed for the whole cortical patch and left pOTS ROI. Based on these simulations, a cluster size threshold of 149.9 mm2 for the whole cortical patch and 23.5 mm2 for the ROI resulted in a corrected 2-tailed probability threshold of P < 0.05. Stereotaxic coordinates of activation peaks were obtained using SUMA's 3dSurf2Vol algorithm after transforming each participant's structural and functional volumes to standard space (Talairach and Tournoux 1988).
Results
Task Performance
Accuracy and RT were analyzed separately for each experimental task (Table 2). In the Brightness task, participants pressed 1 of 2 keys to indicate whether a stimulus was bright or not bright. Repeated measures analysis of variance [ANOVA] revealed no stimulus condition effect on accuracy (F4,4 = 0.91, P = 0.53) or RT (F4,4 = 5.65, P = 0.06).
Table 2.
Mean (SD) statistics for behavioral performance
| Condition | % Correct | RT |
| Brightness task | ||
| Words | 74 (2.3) | 730 (98) |
| Pseudowords | 74 (2.2) | 742 (97) |
| Consonant strings | 74 (2.3) | 721 (85) |
| Pictures | 72 (2.5) | 710 (90) |
| Scrambled pictures | 74 (3.1) | 726 (90) |
| Naming task | ||
| Words | 99 (0.8) | 723 (145) |
| Pseudowords | 96 (2.6) | 827 (145) |
| Consonant strings | 99 (0.7) | 860 (147) |
| Pictures | 95 (2.6) | 950 (102) |
| Scrambled pictures | 99 (0.5) | 823 (162) |
Note: Data are collapsed across both scanning sessions. Incorrect Naming trials were excluded from general linear tests in the fMRI analysis. There were no significant condition effects in the Brightness task. For a description of condition effects in the Naming task, see Results.
In the Naming task, participants named words, pseudowords, and pictures aloud and said junk in response to consonant strings and scrambled pictures. Repeated measures ANOVA revealed expected effects of stimulus condition on accuracy (F4,4 = 7.08, P = 0.04) and vocal RT (F4,35 = 52.60, P < 0.001). Post hoc paired t-tests revealed the following accuracy differences: Word > Pseudoword (t7 = 2.65, P = 0.03); Consonants > Pseudoword (t7 = 2.65, P = 0.03); Scrambled Picture > Picture (t7 = 4.91, P = 0.002); and Word > Picture (t7 = 3.78, P = 0.007). Post hoc paired t-tests revealed the following RT differences: Pseudoword > Word (t7 = 7.60, P < 0.001); Consonants > Word (t7 = 18.57, P < 0.001); Consonants > Pseudoword (t7 = 2.44, P = 0.045); Picture > Scrambled Picture (t7 = 3.64, P = 0.008); Picture > Word (t7 = 7.78, P < 0.001); and Picture > Pseudoword (t7 = 4.82, P = 0.002). Note that error trials in the Naming task, which constituted only about 2% of the events, were treated as a separate condition of no interest in the fMRI analysis and that a trial-specific RT regressor was included in the regression to model effects of RT on brain activation.
FMRI Results
Image analyses were confined to a posterior cortical surface region in each individual, as illustrated in Figure 2. Surface-based analysis improves sensitivity by limiting the number of voxels examined and provides an unambiguous visualization of the activation topology relative to gyral/sulcal landmarks.
Combinatorial Orthographic Processing—Left Hemisphere
As shown in Figure 3A, naming words compared with saying junk in response to consonant strings (WRD > CON) activated the left pOTS or adjacent fusiform gyrus in 6 of the 8 participants. Additional activation was observed in the posterior middle temporal gyrus (pMTG) in 4 participants, extending into the superior temporal gyrus (STG) in 2. In contrast to the Naming task, words produced very little activation compared with consonant strings during the Brightness task (Fig. 3B).
Figure 3.

Individual participant maps showing left hemisphere activation in the contrasts between orthographic stimuli (yellow–red) and consonant stimuli. Each column represents a single participant. Task and contrast used to generate the map are indicated above each row. Yellow–red colors indicate word and pseudoword selective foci in A–D. In E and F, yellow–red colors indicate pseudoword > word activation and blue–cyan colors indicate word > pseudoword activation. Green lines indicate the 3 major temporal lobe sulci. CON = consonant strings, PSD = pseudowords, WRD = words.
Pseudowords produced more robust activation. As shown in Figure 3C, naming pseudowords compared with consonant strings (PSD > CON) activated the pOTS in all 8 participants. Additional activation involved the pMTG in 5 participants and the STG in 6. As with words, pseudowords produced very little activation compared with consonant strings during the Brightness task, though pOTS activation occurred in 2 participants (Fig. 3D).
To quantify these effects in the left pOTS, the percentage of activated nodes in the left pOTS ROI of each participant was computed for each contrast (Fig. 4). A 2 (task: Naming, Brightness) × 2 (contrast: WRD > CON, PSD > CON) repeated measures ANOVA showed main effects of task (F1,7 = 37.77, P < 0.001) and contrast (F1,7 = 23.02, P = 0.002) as well as an interaction (F1,7 = 12.44, P = 0.01). The Naming task produced significantly more activated nodes for both contrasts than the Brightness task. The main effect of contrast was due to a greater area of activation for the PSD > CON contrast compared with the WRD > CON contrast. The interaction was due to a significant difference between contrasts during the Naming task (F1,14 = 6.189, P = 0.02) but not during the Brightness task (F1,14 = 1.34, P = 0.26).
Figure 4.

Extent of activation in the left pOTS ROI for orthographic contrasts during each task as well as the contrast between pseudowords and words during each task. The bracket indicates difference between WRD > CON and PSD > CON contrasts in the Naming task. **P ≤ 0.001, *P ≤ 0.05.
Combinatorial Orthographic Processing—Right Hemisphere
Right hemisphere pOTS/fusiform activation during the Naming task was minimal for the WRD > CON and PSD > CON contrasts, occurring in only 2 participants for each contrast (Supplementary Fig. 1A,C). Activation of the right STG/STS was more consistent, occurring in 5 participants for the WRD > CON contrast and 6 participants for the PSD > CON contrast. In contrast to the Naming task, neither words nor pseudowords activated the right hemisphere during the Brightness task, except for a small activation in the fusiform gyrus in 1 participant (Supplementary Fig. 1B,D).
Combining the word and pseudoword conditions and contrasting this combined condition with the consonant strings produced activation patterns that were virtually identical in both hemispheres to the PSD > CON activations (Supplementary Fig. 2).
Lexicality Effects
As seen in Figure 3E, overt naming of pseudowords relative to words activated the left pOTS in all 8 participants, confirming a robust effect of lexicality. Additional pseudoword-selective areas were observed in the left STG/STS in 5 participants and in the pMTG in 2. Relative to pseudowords, words produced left hemisphere activation in 4 participants (blue areas in Fig. 3E). The locations of these word foci were highly variable, however, including the pMTG, middle occipital gyrus, pOTS, posterior fusiform and lingual gyri, and anterior STG/STS. In contrast to the Naming task, lexicality effects were minimal during the Brightness task, with PSD > WRD activation observed in only 1 participant and no WRD > PSD responses (Fig. 3F). To quantify these effects in the left pOTS, the percentage of nodes activated by the PSD > WRD contrast for each task (Naming, Brightness) was computed for each participant (Fig. 4). A repeated measures ANOVA showed that the Naming task produced significantly more pseudoword-selective activations than the Brightness task (F1,7 = 5.917, P = 0.04).
Lexicality effects were minimal in the right hemisphere (Supplementary Fig. 1E,F). Naming pseudowords relative to words activated the right STG in 2 participants, one of whom also showed activation in the right pOTS. Naming words relative to pseudowords activated right hemisphere areas in 4 participants, mainly in the MTG. Lexicality effects were negligible in the right hemisphere during the Brightness task.
Nonorthographic Visual Form Processing
As shown in Figure 5A, overt naming of pictured objects compared with saying junk to scrambled pictures (PIC > SCR) activated the left pOTS in a pattern very similar to the PSD > CON contrast (Fig. 3C). Activation also involved the left STG/STS in 4 participants and the left pMTG in 4. PIC > SCR activation was greatly reduced during the Brightness task (Fig. 5B), though not as completely as with the orthographic contrasts. PIC > SCR activation during the Brightness task involved the left pOTS or adjacent fusiform gyrus in 6 participants. To quantify these effects in the left pOTS ROI, the percentage of activated nodes by the PIC > SCR contrast for each task (Naming, Brightness) was computed for each participant (Supplementary Fig. 3). A repeated measures ANOVA showed that the Naming task produced significantly more activated nodes than the Brightness task (F1,7 = 7.216, P = 0.03).
Figure 5.

Individual participant maps showing activation in both hemispheres for the contrast between pictures and scrambled pictures in both tasks. Yellow-red activations indicate picture-selective foci in the left hemisphere (A,B) and right hemisphere (C,D). PIC = pictures, SCR = scrambled pictures.
Unlike the orthographic stimuli, pictures produced substantial activation in the right pOTS and adjacent fusiform gyrus, with activation observed in 7 participants during the Naming task and 5 during the Brightness task (Fig. 5C,D). Activation during Naming involved the STS in 3 participants. Compared with the orthographic contrasts, activation by pictures tended to involve the fusiform gyrus to a greater degree, especially in the right hemisphere.
Orthographic versus Nonorthographic Visual Form Processing in the Left pOTS
Selectivity of the left pOTS for combinatorial orthographic input was assessed by a contrast between combinatorial orthographic processing ([words + pseudowords] − 2 * consonants) and nonorthographic form processing (pictures – scrambled pictures). Areas with relative selectivity for combinatorial orthographic processing during the Naming task (i.e., oral reading) were observed in the left pOTS in all 8 participants (Fig. 6). The exact location of these activation clusters varied across participants. They were more often located on the lateral bank of the OTS (12 activation peaks) compared with the medial bank (3 peaks). Peak stereotaxic coordinates and surface area measurements were obtained for each cluster (Supplementary Table 1), yielding an average peak coordinate of −47, −53, −15 and an average surface area of 66.2 mm2. These coordinates correspond well with VWFA coordinates reported previously (e.g., Cohen et al. 2002: −39, −57, −9; Cohen et al. 2004: −43, −57, −12; Dehaene et al. 2004: −48, −56, −8; Binder et al. 2006: −44, −60, −12). In 5 participants, there were also clusters in or near the pOTS that showed the reverse effect, that is, stronger activation for nonorthographic visual form processing (i.e., object naming). These clusters had an average peak coordinate of −44, −57, −19 and an average surface area of 79.4 mm2. They were more numerous on the medial bank of the OTS (10 activation peaks) compared with the lateral bank (3 peaks), but in some cases interdigitated with orthography-selective foci. Selectivity for combinatorial orthographic versus nonorthographic input was much weaker during the Brightness task, with orthography-selective foci observed in only 3 participants and picture-selective foci in 5 (Supplementary Fig. 4). To quantify these effects in the left pOTS, the spatial extent of the orthography-selective activation (percentage of left pOTS ROI nodes activated) for each task was computed for each participant (Fig. 7). A 2 (Task: Naming, Brightness) × 2 (Foci-selectivity: orthographic foci, nonorthographic foci) repeated measures ANOVA showed that the Naming task identified significantly more orthography-selective nodes than the Brightness task (F1,7 = 5.33, P = 0.05), whereas task did not have a significant effect on the spatial extent of picture-selective activation (F1,7 = 0.666, P = 0.44).
Figure 6.
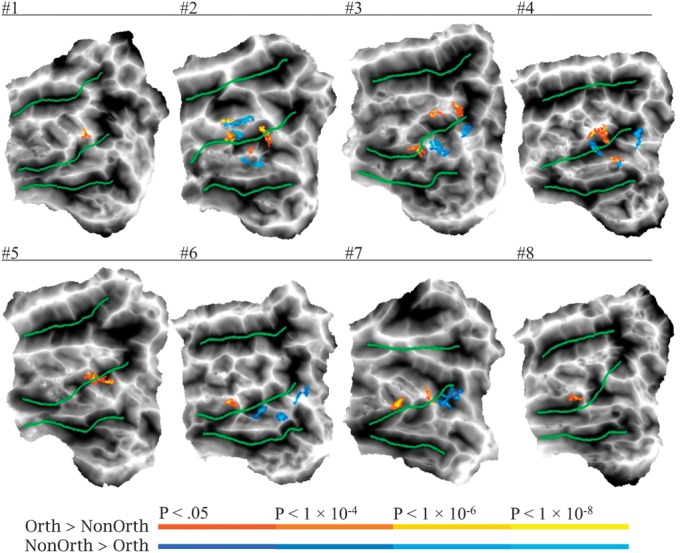
Individual maps showing the contrast between combinatorial orthographic [(Word + Pseudoword) − (2 * Consonant)] and nonorthographic [Picture − Scrambled] processing in the left pOTS ROI during the Naming task. Yellow–red activations indicate orthography-selective foci and blue–cyan activations indicate picture-selective foci.
Figure 7.

Percentage of left pOTS ROI activation by orthography-selective and picture-selective foci across Naming and Brightness tasks, identified by the contrast between combinatorial orthographic [(Word + Pseudoword) − (2 * Consonant)] and nonorthographic [Picture − Scrambled] processing. *P ≤ 0.05.
Within the orthography-selective foci, mean z-scores were obtained for each condition (relative to fixation) for each task to clarify the source of stimulus and task effects (Supplementary Table 1). As shown in Figure 8, absolute differences in activation between words and pictures were small during both tasks, consistent with many previous studies (Price and Devlin 2003; Price et al. 2006; Wright et al. 2008). The selectivity for combinatorial orthographic processing during the Naming task arose because the difference in activation between pronounceable orthographic stimuli (words and pseudowords) and consonant strings was much larger than the difference between pictures and scrambled pictures. This effect disappeared during the Brightness task because of a relative reduction in activation for words and pseudowords. Figure 8 also shows that the source of the effect is not attributable to deactivations of within-category control conditions (i.e., consonant strings, scrambled pictures). Notably, levels of activation for pictures and scrambled pictures were intermediate between words/pseudowords and consonants in the Naming task.
Figure 8.

Average z-scores obtained from orthography-selective foci in the left pOTS during the Naming task, identified by the following contrast: [(Word + Pseudoword) − (2 * Consonant)] > [Picture − Scrambled]. Levels of activation within these foci were measured across stimulus and task conditions. WRD = word, PSD = pseudoword, CON = consonant, PIC = picture, SCR = scrambled picture.
Effects of Intersession Averaging on Left pOTS Activation
The use of a 2-session design raises questions about possible repetition suppression effects and about the degree to which detection was improved by intersession averaging. To address these issues, the percentage of activated nodes in the left pOTS ROI was computed for each contrast in each participant, for each session and for the average of the sessions (Supplementary Fig. 5). We focused only on data from the Naming task given the more consistent activation in this task relative to the Brightness task. A 2 (Session: session 1, session 2) × 5 (Contrast: WRD > CON, PSD > CON, PSD > WRD, PIC > SCR, orthographic > nonorthographic) repeated measures ANOVA showed no main effect of session (F1,7 = 0.282, P = 0.61) nor was there a significant interaction between session and contrast (F1,7 = 1.079, P = 0.47). These results indicate an equivalent spatial extent of activation across the 2 sessions. A second 2 (Number of Sessions: session 1 only, average of both sessions) × 5 (Contrast: WRD > CON, PSD > CON, PSD > WRD, PIC > SCR, orthographic > nonorthographic) repeated measures ANOVA assessed the effect of averaging across sessions. This revealed a main effect of number of sessions (F1,7 = 25.987, P = 0.001), with no significant interaction between sessions and contrast (F1,7 = 4.963, P = 0.07). Averaged across contrasts and participants, averaging 2 sessions of data increased the spatial extent of detected activation by a factor of 3.1 relative to the first session alone. Notably, orthography-specific foci were apparent only after merging the data across both sessions.
Motion Effects and Task
Relative to blocked-trial analysis, event-related analysis (as used here) is less affected by speech-related movement because motion-induced signal changes from speech occur prior to neuronal activation-induced signal changes (Birn et al. 1999). However, overt speech could cause secondary head movements that might result in false negative or false positive errors. As an index of gross head motion, SDs for the 6 motion parameter vectors were calculated for each participant for each task (Supplementary Table 2). A 2 (Task: Naming, Brightness) × 6 (Motion Vector: Roll, Pitch, Yaw, dS, dL, dP) repeated measures ANOVA showed no main effects of task (F1,7 = 2.36, P = 0.16) or motion parameter (F1,7 = 7.851, P = 0.06) nor was there an interaction (F1,7 = 0.442, P= 0.80).
Discussion
We observed a robust effect of combinatorial orthographic processing on activation in the left pOTS using contrasts between familiar orthographic stimuli (words or pseudowords) and consonant strings. Critically, we demonstrate for the first time that subregions within the left pOTS show stronger activation in response to combinatorial orthographic processing than to nonorthographic object processing. These effects, however, were strongly moderated by task demands, such that the activation for words and pseudowords over consonant strings was observed in a task requiring orthographic–phonological mapping (overt naming) and was essentially absent in a nonlinguistic visual task (brightness judgment). Left pOTS responses were stronger to pseudowords compared with words, though this effect was also observed only with the Naming task. In the discussion that follows, we describe a mechanism that accounts for these observations and reconciles several major issues concerning the role of the left pOTS in reading.
Words versus Pictures in the Left pOTS
Much debate regarding the VWFA/pOTS centers on whether this region is selectively sensitive to words relative to nameable object pictures (Price and Devlin 2003; Cohen and Dehaene 2004; Wright et al. 2008; Szwed et al. 2011). In our view, however, the emphasis on direct word–picture comparisons represents an oversimplification of the orthographic expertise hypothesis outlined in the introduction. The hypothesis states that perceptual expertise for orthographic forms is acquired through reading experience rather than being genetically determined. Rather than being a dedicated “module” used only for reading, the left pOTS supports visual mechanisms that are particularly necessary for efficient perception of familiar letter strings (Cohen et al. 2002; Dehaene et al. 2005; Binder et al. 2006). The very same mechanisms, however, may also play a role in visual object perception more generally. Object pictures are typically more visually complex and contain less structural redundancy than written words and therefore might be expected to require more extensive perceptual processing. Thus, it is likely that object pictures will tend to activate high-level visual areas at least as much as words. This prediction is supported by several prior studies showing that left pOTS responses to pictured objects tend to be either greater than or equivalent to words (Sevastianov et al. 2002; Price and Devlin 2003; Price et al. 2006; Wright et al. 2008). A high metabolic demand by pictures for processing resources, however, does not exclude the possibility that some of these processing resources underlie orthographic perceptual expertise. The fact that a network of neurons has become particularly critical for processing in one stimulus domain (i.e., orthography) does not dictate that this network cannot participate in processing of other types of stimuli (i.e., object pictures).
A more specific prediction of the orthographic expertise hypothesis is that there exist areas in the left pOTS that are engaged more by combinatorial orthographic processing than by nonorthographic object perception (i.e., perception of objects that are not letter strings). This hypothesis concerns the higher order processes carried out by the pOTS rather than general differences between stimulus categories. We defined combinatorial orthographic processing operationally using a contrast between familiar (words or pseudowords) and unfamiliar (random consonant) letter strings. This contrast provides tight controls for low-level stimulus properties and high-level feature analysis at the single letter level. Any additional activation produced by the orthographically familiar stimuli can thus be attributed either to processing of combinatorial orthographic information or to accessing higher level (phonological or semantic) codes. Nonorthographic object recognition engages a number of specific mechanisms, such as contour and shape analysis, configural processing and binding, and 3D model formation (Biederman 1987; Edelman 1997). Consistent with previous research, we operationally defined this set of processes using a contrast between recognizable pictures and unrecognizable (spatially scrambled) pictures (e.g., Grill-Spector et al. 1998). Note that the scrambling process disrupts a range of stimulus features (e.g., low-frequency, contour, boundary, configural, and shape information). The comparison between orthographic and picture processing is therefore a conservative stringent test of the orthographic expertise hypothesis given that the orthographic stimuli are contrasted against a more visually similar baseline condition. For this hypothesis to be supported, the left pOTS must show a stronger orthographic effect (words and pseudowords > consonant strings) than a picture recognition effect (pictures > scrambled pictures) even though the former contrast is more tightly controlled in terms of physical stimulus attributes. This is precisely what we observed in all of our participants.
Several previous studies documented orthography-selective activation in the left pOTS region based on direct comparisons between words and pictures (Hasson et al. 2002; Reinholz and Pollmann 2005; Baker et al. 2007; Ben-Shachar et al. 2007). Because letter strings and object pictures have very different visual attributes, however, it is unclear whether the reported activation differences were due to combinatorial orthographic processing or to processing of visual features at the letter level. In one study, the area showing stronger activation to words relative to pictures showed no difference between words and consonant strings, suggesting that it was “better characterized as being selective for letters or letter strings than for words per se” (Baker et al. 2007). Strong evidence for letter-specific activation in multiple areas of the left ventral visual stream comes from a recent study by Szwed et al. (2011). These authors compared words with visually scrambled words and object pictures to scrambled objects. Words and pictures were also carefully matched on a number of visual factors such as luminance, contour length, and number of vertex features. The results showed orthography-specific effects (stronger word > scrambled word activation compared with picture > scrambled picture activation) in multiple visual areas, including early visual regions bilaterally. Given the careful controls for low-level visual features, these data suggest perceptual tuning to letter shapes at multiple levels of the ventral visual stream. None of the previous studies comparing words and objects, however, examined activation specific to combinatorial orthographic processing by using a consonant string control. The present study is thus the first to demonstrate selective effects of combinatorial orthographic structure (compared with object processing) in the left pOTS.
As pointed out elsewhere (Wright et al. 2008), prior studies comparing words and pictures may also have been confounded by covert differences in processing strategy. Several studies used a 1-back matching task (Hasson et al. 2002; Baker et al. 2007; Szwed et al. 2011), which likely encourages phonological encoding in the case of words and visual encoding in the case of pictures. Similarly, because automatic phonological processing is more likely in the case of words than pictures (Carr et al. 1982; Glaser 1992), implicit processing and passive viewing tasks may also encourage stronger phonological processing of words compared with pictures (Reinholz and Pollmann 2005; Baker et al. 2007; Ben-Shachar et al. 2007). In contrast, naming requires explicit phonological processing and therefore should engage similar strategies for words and pictures (Wright et al. 2008). Prior studies comparing word and picture naming, however, showed no differences in left pOTS activation (Price and Devlin 2003; Price et al. 2006; Wright et al. 2008; Kherif et al. 2011). The present study is the first, therefore, to demonstrate selective effects of combinatorial orthographic processing on left pOTS activation in the context of a Naming task, in which phonological processing demands were equated for words and pictures.
The location of orthography-specific foci in the left pOTS varied across the participants, especially along the anterior–posterior axis. For example, most participants showed a focus in the posterior lateral bank of the pOTS, while participants #6 and #8 showed activation only in a more anterior location on the lateral bank and participants #2, #3, and #7 showed activation in both anterior and posterior sites. The range of these locations overlapped with foci showing the opposite activation pattern (i.e., stronger activation during object processing). In such a situation, averaging of results across participants is unlikely to yield detectable activation at the group level, even with perfect alignment of anatomical structures. Anticipating this problem, we optimized detection of orthography-specific foci in individual participants by using high-resolution imaging without spatial smoothing and extensive trial averaging to increase statistical power. Although the exact location of the foci varied, the general finding of orthography-specific activation along the lateral bank of the pOTS was observed in all 8 participants.
Task Effects
A novel aspect of the current study was the comparison afforded by using 2 tasks with very different processing demands. The Brightness task required a purely perceptual discrimination, which was maintained at a difficult level using an adaptive staircase technique. Unlike with the Naming task, there were no condition effects on accuracy or RT in the Brightness task, suggesting that the strong visual perceptual demands of the task minimized additional linguistic processing. The results showed striking differences between the tasks in the pattern of left pOTS activation, with large condition effects observed in the Naming task that were strongly moderated or disappeared altogether in the Brightness task. Notably, this moderation of condition differences was not due simply to a lower overall level of activity in the latter task.
These results provide strong evidence that activation in the left pOTS is not solely determined by bottom-up stimulus processing. In addition to any stimulus effects that may be present, the requirement to map the visual input to a linguistic representation exerts a clear interaction effect, whereby stimuli that can be mapped (words, pseudowords, pictures) produce a stronger left pOTS response than stimuli that cannot be (consonant strings, scrambled pictures). These results provide strong support for the view that the left pOTS functions as an intermediary “hub” linking visual and higher linguistic representations (Price and Devlin 2003, 2011; Sandak et al. 2004; Devlin et al. 2006). Given that the task effects were at least as strong for pseudowords as for words and pictures, the main function of the left pOTS appears to be to connect visual with phonological representations (see Units of Orthographic Representation).
At the same time, the present data show that the left pOTS is not an undifferentiated region that functions identically for all nameable visual inputs. If it were, the task of linking these visual inputs with their names would modulate the left pOTS equivalently for all such stimuli. Instead, some subregions within the left pOTS were modulated to a greater degree when the task involved naming orthographic stimuli compared with naming picture stimuli. This difference provides important clues as to the specific mechanisms supported by these subregions. Orthographic structures (letters and letter combinations) are correlated with phonology in alphabetic writing systems. Skilled readers develop statistical knowledge of the mappings between orthography and phonology, which involves units of varying size ranging from letters to whole words (Seidenberg and McClelland 1989). In contrast, object pictures lack components that correspond to phonology. The relationship between a picture and its name is arbitrary, thus a picture must first be identified as a whole before it can be named. This difference between words and pictures accounts for a wide variety of behavioral data, such as the robust naming latency advantage for words and asymmetric phonological and semantic priming effects by words and pictures (Potter and Faulconer 1975; Carr et al. 1982; Glaser 1992). We propose that one essential function of the left pOTS in experienced readers is to detect familiar visual forms—such as letters and familiar letter combinations—that are predictive of and map directly to phonological forms. The strong task effects observed in the present study suggest that this direct orthography–phonology recoding process is not entirely automatic but depends in part on a top-down signal that engages the recoding process.
Units of Orthographic Representation
Pseudowords consistently produced stronger activation than words in some areas of the left pOTS during the Naming task. Similar effects were observed in the left STG/STS in most participants. These effects were highly task dependent and mostly disappeared during the Brightness task. Several previous studies showed stronger activation of the left pOTS to pseudowords and low-frequency words compared with high-frequency words (Kronbichler et al. 2004, 2007; Bruno et al. 2008; Schurz et al. 2010). These effects are often interpreted as evidence for whole-word representations (i.e., an orthographic lexicon) in the VWFA (Kronbichler et al. 2004; Bruno et al. 2008; Glezer et al. 2009). Several models of word recognition incorporate this whole-word assumption (e.g., Forster 1976; Coltheart et al. 2001). If the word recognition system contains word-level representations, it will treat words differently than pseudowords. The lexical entries could encode frequency in a variety of ways (e.g., the entries could be searched in order of frequency or more common words could become activated more rapidly). These models reflect a strong intuition that word-level effects indicate word-level representations.
Other data, however, present challenges for accounts based on word-level representations. The explanation often given for frequency and lexicality effects in previous imaging studies is that less familiar stimuli (lower frequency words compared with higher frequency words; pseudowords compared with words) are more difficult to process and therefore require greater activation. However, consonant strings, which are highly unfamiliar orthographic patterns, produce a weaker left pOTS response than words, not stronger. Models that assume lexical-level representations also have difficulty explaining effects of sublexical orthographic familiarity (Binder et al. 2006; Vinckier et al. 2007). Left pOTS activation increases as a function of the average probability of occurrence of constituent bigrams and trigrams in nonwords, and this activation increase is mirrored by a parallel improvement in masked letter perception (Binder et al. 2006). These results suggest that at least some of the processing in the left pOTS also involves units smaller than entire words.
Our proposal that some areas in the left pOTS support a direct mapping between familiar orthographic and phonological forms provides a means of reconciling these observations. Consonant strings lack familiar orthographic forms and thus do not activate the left pOTS neural assemblies that are tuned to these forms. Pseudowords do contain familiar forms, and pronunciation of pseudowords depends almost entirely on statistical knowledge of subword orthographic–phonologic correspondences. Words also contain familiar forms but also activate semantic representations that can assist in phonological retrieval by an indirect orthography–semantics–phonology pathway (Plaut et al. 1996; Harm and Seidenberg 2004). Thus, the stronger activation of left pOTS by pseudowords compared with words is entirely consistent with the proposed role of this region in detecting combinatorial orthographic forms that can be mapped directly to corresponding phonological forms, a process required to a greater degree for pseudowords than for words. Because this process is more critical for pronunciation of pseudowords, it would likely be engaged for a longer period of time or receive more top-down enhancement in the case of pseudowords than words, especially under task conditions that require phonological mapping. Word frequency effects are explained by the same mechanism because the size of the semantic contribution tends to be greater for more frequent words. Previous computational models employing distributed representations of orthography, phonology, and semantics lend support to these intuitions (Seidenberg and McClelland 1989; Plaut et al. 1996; Harm and Seidenberg 2004). Although these models do not incorporate word-level representations, they exhibit both the frequency and the lexicality effects often taken as evidence for such representations.
Stronger evidence for word-level units in the left pOTS comes from a study by Glezer et al. (2009), who used a priming procedure to measure repetition suppression of the BOLD response as a function of prime–target orthographic overlap. Pseudoword prime–target pairs differing by one letter showed significant repetition suppression (relative to pairs differing in all letters), whereas little or no suppression occurred with word prime–target pairs differing by one letter. This pattern suggests a higher degree of similarity between the pseudoword pairs compared with the word pairs, in turn suggesting that neural representations for words in the pOTS are more highly tuned (and therefore more distinct) than in the case of pseudowords. These results provide compelling evidence for whole word representations in some areas of the left pOTS, but they do not negate other evidence for sublexical processing. Together, the available data suggest that the left pOTS contains subnetworks that are tuned to familiar letter combinations across a range of string lengths, including whole words. Far from being mutually exclusive, both word and subword effects could arise from a single distributed representation that produces attractor dynamics at different levels. According to this conception, statistical properties of the orthography manifest at the neural level as increasingly distinct attractor states for increasingly longer letter sequences (e.g., _TION has a stronger attractor than _ON). Whole word attractors are the most distinct because of their greater average frequency of occurrence relative to orthographic neighbors of the same length (e.g., none of the hypothetical orthographic neighbors of the letter string LENGTH occur as real words).
A Visual Form-to-Phonology Network
Activation during the Naming task also frequently involved the left STS and STG—areas often implicated in phonological access and phonological short-term memory (Wise et al. 2001; Indefrey and Levelt 2004; Graves et al. 2008; Acheson et al. 2010). In several participants, the activated regions in left pOTS and STS were connected by a band of activation spanning the posterior aspect of the inferior and middle temporal gyri (approximately lateral Brodmann area 37), creating a “horseshoe” appearance to the activated regions on the flattened maps. We suggest that these regions constitute a network connecting high-level visual form recognition systems in the pOTS with phonological representations in the posterior superior temporal cortex. This suggestion is supported by a recent meta-analysis of hypoactive regions reported in imaging studies of developmental dyslexia (Richlan et al. 2009). The most consistent regions of abnormal activation in the meta-analysis formed a band in the posterior left hemisphere extending from the lateral occipitotemporal junction across the posterior inferior and middle temporal gyri to the posterior STG, a pattern strikingly similar to the activation pattern observed during the Naming task in the present study. Impaired phonological representation and grapheme–phoneme mapping are believed to be core processing deficits in developmental dyslexia (Wagner and Torgesen 1987; Shaywitz 1998), providing a conceptual link between the dyslexia imaging data and the visual–phonology pathway evident in the present study. Many dyslexics also show impairment in rapid picture naming (Denckla and Rudel 1976), consistent with the finding that naming object pictures activated many of the same regions in pOTS and STG/STS that are activated by reading words and pseudowords (McCrory et al. 2005).
The coactivation of left pOTS and superior temporal regions suggests that they interact closely during visual naming, though the function of these regions is unlikely to be identical. Their respective anatomical locations suggest a closer role for the pOTS in high-level visual form recognition and a complementary role for the STG/STS in sound-based form processing. Lesions of the left posterior superior temporal region cause severe impairment on auditory phonological tasks, such as speech repetition, typically manifesting as phonological storage and sequencing errors (Kohn 1992; Caplan et al. 1995; Axer et al. 2001), whereas lesions in the left ventral occipitotemporal region produce no such impairment at the phonological level. In the current study, activation observed in the STG/STS during picture naming disappeared completely during the Brightness task, whereas activation occurred in the pOTS during both tasks, again suggesting a closer association of the pOTS with visual form processing.
Conclusions
The data provide evidence for subregions within the left pOTS with a relatively specialized role in direct mapping of familiar visual forms (letters and letter combinations) to phonological forms. While the left pOTS is responsive to both orthographic and nonorthographic visual stimuli, areas within this region are engaged more during naming pronounceable letter strings than during naming of object pictures. This difference cannot be explained by lower level visual confounds, as the consonant strings used as a baseline for orthographic processing provided, if anything, a tighter visual control than did the scrambled pictures used as a baseline for picture processing. Rather, we propose that subregions within the left pOTS become tuned to familiar orthographic visual patterns as a result of extensive reading experience and support the mapping between these visual patterns and isomorphic phonological representations, a process that distinguishes word naming from picture naming. Orthography-selective activation in these areas is suppressed when task demands inhibit phonological processing, indicating that a top-down signal is required to engage the orthography–phonology recoding process. The observation that pseudowords elicit stronger activation than words in these regions is consistent with their postulated role in direct orthography–phonology mapping, as pseudoword naming makes stronger demands on this process than word naming.
Supplementary Material
Supplementary material can be found at: http://www.cercor.oxfordjournals.org/
Funding
This work was supported by the National Institutes of Health (grant number NS033576 to J.R.B.). Writing of this manuscript was partly supported by the Office of Academic Affiliations, Advanced Fellowship Program in Mental Illness Research and Clinical Center (MIRECC), Department of Veterans Affairs (to Q.R.M.).
Supplementary Material
Acknowledgments
Thanks to David Medler for technical assistance. Conflict of Interest: None declared.
References
- Acheson DJ, Hamidi M, Binder JR, Postle BR. A common neural substrate for language production and verbal working memory. J Cogn Neurosci. 2010;23:1358–1367. doi: 10.1162/jocn.2010.21519. [DOI] [PMC free article] [PubMed] [Google Scholar]
- Axer H, Keyserlingk AG, Berks G, Keyserlingk DF. Supra- and infrasylvian conduction aphasia. Brain Lang. 2001;76:317–331. doi: 10.1006/brln.2000.2425. [DOI] [PubMed] [Google Scholar]
- Baayen RH, Piepenbrock R, Gulikers L. The CELEX lexical database (CD-ROM) 2.5 ed. Philadelphia (PA): Linguistic Data Consortium, University of Pennsylvania; 1995. [Google Scholar]
- Baker CI, Liu J, Wald LL, Kwong K, Benner T, Kanwisher N. Visual word processing and experimental origins of functional selectivity in human extrastriate cortex. Proc Natl Acad Sci U S A. 2007;104:9087–9092. doi: 10.1073/pnas.0703300104. [DOI] [PMC free article] [PubMed] [Google Scholar]
- Ben-Shachar M, Dougherty RF, Deutsch GK, Wandell BA. Differential sensitivity to words and shapes in ventral occipito-temporal cortex. Cereb Cortex. 2007;17:1604–1611. doi: 10.1093/cercor/bhl071. [DOI] [PubMed] [Google Scholar]
- Biederman I. Recognition-by-components: a theory of human image understanding. Psychol Rev. 1987;94:115–147. doi: 10.1037/0033-295X.94.2.115. [DOI] [PubMed] [Google Scholar]
- Binder JR, Medler DA, Westbury CF, Liebenthal E, Buchanan L. Tuning of the human left fusiform gyrus to sublexical orthographic structure. Neuroimage. 2006;33:739–748. doi: 10.1016/j.neuroimage.2006.06.053. [DOI] [PMC free article] [PubMed] [Google Scholar]
- Binder JR, Mohr JP. The topography of callosal reading pathways: a case-control analysis. Brain. 1992;115:1807–1826. doi: 10.1093/brain/115.6.1807. [DOI] [PubMed] [Google Scholar]
- Birn RM, Bandettini PA, Cox RW, Shaker R. Event-related fMRI of tasks involving brief motion. Hum Brain Mapp. 1999;7:106–114. doi: 10.1002/(SICI)1097-0193(1999)7:2<106::AID-HBM4>3.0.CO;2-O. [DOI] [PMC free article] [PubMed] [Google Scholar]
- Bruno JL, Zumberge A, Manis FR, Lu Z-L, Goldman JG. Sensitivity to orthographic familiarity in the occipito-temporal region. Neuroimage. 2008;39:1988–2001. doi: 10.1016/j.neuroimage.2007.10.044. [DOI] [PMC free article] [PubMed] [Google Scholar]
- Caplan D, Gow D, Makris N. Analysis of lesions by MRI in stroke patients with acoustic-phonetic processing deficits. Neurology. 1995;45:293–298. doi: 10.1212/wnl.45.2.293. [DOI] [PubMed] [Google Scholar]
- Carr TH, McCauley C, Sperber RD, Parmalee CM. Words, pictures, and priming: on semantic activation, conscious identification, and the automaticity of information processing. J Exp Psychol Hum Percept Perform. 1982;8:757–777. doi: 10.1037//0096-1523.8.6.757. [DOI] [PubMed] [Google Scholar]
- Cohen L, Dehaene S. Specialization within the ventral stream: the case for the visual word form area. Neuroimage. 2004;22:466–476. doi: 10.1016/j.neuroimage.2003.12.049. [DOI] [PubMed] [Google Scholar]
- Cohen L, Dehaene S, Naccache L, Lehéricy S, Dehaene-Lambertz G, Hénaff M-A, Michel F. The visual word form area. Spatial and temporal characterization of an initial stage of reading in normal subjects and posterior split-brain patients. Brain. 2000;123:291–307. doi: 10.1093/brain/123.2.291. [DOI] [PubMed] [Google Scholar]
- Cohen L, Jobert A, Le Bihan D, Dehaene S. Distinct unimodal and multimodal regions for word processing in the left temporal cortex. Neuroimage. 2004;23:1256–1270. doi: 10.1016/j.neuroimage.2004.07.052. [DOI] [PubMed] [Google Scholar]
- Cohen L, Lehéricy S, Chochon F, Lemer C, Rivaud S, Dehaene S. Language-specific tuning of visual cortex? Functional properties of the visual word form area. Brain. 2002;125:1054–1069. doi: 10.1093/brain/awf094. [DOI] [PubMed] [Google Scholar]
- Cohen L, Martinaud O, Lemer C, Lehericy S, Samson Y, Obadia M, Slachevsky A, Dehaene S. Visual word recognition in the left and right hemispheres: anatomical and functional correlates of peripheral alexias. Cereb Cortex. 2003;13:1313–1333. doi: 10.1093/cercor/bhg079. [DOI] [PubMed] [Google Scholar]
- Coltheart M, Davelaar E, Jonasson JT, Besner D. Access to the internal lexicon. In: Dornic S, editor. Attention and performance VI: The psychology of reading. London: Academic Press; 1997. [Google Scholar]
- Coltheart M, Rastle K, Perry C, Langdon R, Ziegler J. DRC: a dual route cascaded model of visual word recognition and reading aloud. Psychol Rev. 2001;108:204–256. doi: 10.1037/0033-295x.108.1.204. [DOI] [PubMed] [Google Scholar]
- Dehaene S, Cohen L. The unique role of the visual word form area. Trends Cogn Sci. 2011;15(6):254–262. doi: 10.1016/j.tics.2011.04.003. [DOI] [PubMed] [Google Scholar]
- Dehaene S, Cohen L, Sigman M, Vinckier F. The neural code for written words: a proposal. Trends Cogn Sci. 2005;9:335–341. doi: 10.1016/j.tics.2005.05.004. [DOI] [PubMed] [Google Scholar]
- Dehaene S, Jobert A, Naccache L, Ciuciu P, Poline J-B, Le Bihan D, Cohen L. Letter binding and invariant recognition of masked words: behavioral and neuroimaging evidence. Psychol Sci. 2004;15:307–313. doi: 10.1111/j.0956-7976.2004.00674.x. [DOI] [PubMed] [Google Scholar]
- Dehaene S, Naccache L, Cohen L, Bihan DL, Mangin JF, Poline J-B, Riviere D. Cerebral mechanisms of word masking and unconscious repetition priming. Nat Neurosci. 2001;4:752–758. doi: 10.1038/89551. [DOI] [PubMed] [Google Scholar]
- Denckla MB, Rudel RG. Rapid ‘automatized’ naming (R.A.N.): dyslexia differentiated from other learning disabilities. Neuropsychologia. 1976;14:471–479. doi: 10.1016/0028-3932(76)90075-0. [DOI] [PubMed] [Google Scholar]
- Devlin JT, Jamison HL, Gonnerman LM, Matthews PM. The role of the posterior fusiform gyrus in reading. J Cogn Neurosci. 2006;18:911–922. doi: 10.1162/jocn.2006.18.6.911. [DOI] [PMC free article] [PubMed] [Google Scholar]
- Edelman S. Computational theories of object recognition. Trends Cogn Sci. 1997;1:296–304. doi: 10.1016/S1364-6613(97)01090-5. [DOI] [PubMed] [Google Scholar]
- Fiset D, Arguin M, Bub D, Humphreys GW, Riddoch MJ. How to make the word-length effect disappear in letter-by-letter dyslexia: implications for an account of the disorder. Psychol Sci. 2005;16(7):535–541. doi: 10.1111/j.0956-7976.2005.01571.x. [DOI] [PubMed] [Google Scholar]
- Forster KI. Accessing the mental lexicon. In: Wales RJ, Walker ECT, editors. New approaches to language mechanisms. Amsterdam (the Netherlands): North Holland; 1976. pp. 257–287. [Google Scholar]
- Glaser WR. Picture naming. Cognition. 1992;42:61–105. doi: 10.1016/0010-0277(92)90040-o. [DOI] [PubMed] [Google Scholar]
- Glezer LS, Jiang X, Riesenhuber M. Evidence for highly selective neuronal tuning of whole words in the “visual word form area”. Neuron. 2009;62:199–204. doi: 10.1016/j.neuron.2009.03.017. [DOI] [PMC free article] [PubMed] [Google Scholar]
- Graves WW, Desai R, Humphries C, Seidenberg MS, Binder JR. Neural systems for reading aloud: a multiparametric approach. Cereb Cortex. 2010;20:1799–1815. doi: 10.1093/cercor/bhp245. [DOI] [PMC free article] [PubMed] [Google Scholar]
- Graves WW, Grabowski TJ, Mehta S, Gupta P. The left posterior superior temporal gyrus participates specifically in accessing lexical phonology. J Cogn Neurosci. 2008;20:1698–1710. doi: 10.1162/jocn.2008.20113. [DOI] [PMC free article] [PubMed] [Google Scholar]
- Grill-Spector K, Kushnir T, Hendler T, Edelman S, Itzchak Y, Malach R. A sequence of object-processing stages revealed by fMRI in the human occipital lobe. Hum Brain Mapp. 1998;6:316–328. doi: 10.1002/(SICI)1097-0193(1998)6:4<316::AID-HBM9>3.0.CO;2-6. [DOI] [PMC free article] [PubMed] [Google Scholar]
- Harm MW, Seidenberg MS. Computing the meanings of words in reading: cooperative division of labor between visual and phonological processes. Psychol Rev. 2004;111:662–720. doi: 10.1037/0033-295X.111.3.662. [DOI] [PubMed] [Google Scholar]
- Hasson U, Levy I, Behrmann M, Hendler T, Malach R. Eccentricity bias as an organizing principle for human high-order object areas. Neuron. 2002;34:490–497. doi: 10.1016/s0896-6273(02)00662-1. [DOI] [PubMed] [Google Scholar]
- Huettel SA, McCarthy G. The effects of single-trial averaging upon the spatial extent of fMRI activation. Neuroreport. 2001;12:2411–2416. doi: 10.1097/00001756-200108080-00025. [DOI] [PubMed] [Google Scholar]
- Indefrey P, Levelt WJM. The spatial and temporal signatures of word production components. Cognition. 2004;92:101–144. doi: 10.1016/j.cognition.2002.06.001. [DOI] [PubMed] [Google Scholar]
- Kherif F, Josse G, Price CJ. Automatic top-down processing explains common left occipito-temporal responses to visual words and objects. Cereb Cortex. 2011;21:103–114. doi: 10.1093/cercor/bhq063. [DOI] [PMC free article] [PubMed] [Google Scholar]
- Kohn SE, editor. Conduction aphasia. Hillsdale (NJ): Lawrence Erlbaum; 1992. [Google Scholar]
- Kronbichler M, Bergmann J, Hutzler F, Staffen W, Mair A, Ladurner G. Taxi vs. Taksi: orthographic word recognition in the left ventral occipitotemporal cortex. J Cogn Neurosci. 2007;19:1584–1594. doi: 10.1162/jocn.2007.19.10.1584. [DOI] [PMC free article] [PubMed] [Google Scholar]
- Kronbichler M, Hutzler F, Wimmer H, Mair A, Staffen W, Ladurner G. The visual word form area and the frequency with which words are encountered: evidence from a parametric fMRI study. Neuroimage. 2004;21:946–953. doi: 10.1016/j.neuroimage.2003.10.021. [DOI] [PubMed] [Google Scholar]
- Leff AP, Crewes H, Plant GT, Scott SK, Kennard C, Wise RJS. The functional anatomy of single-word reading in patients with hemianopic and pure alexia. Brain. 2001;124:510–521. doi: 10.1093/brain/124.3.510. [DOI] [PubMed] [Google Scholar]
- Lohmann G, von Cramon DY, Colchester ACF. Deep sulcal landmarks provide an organizing framework for human cortical folding. Cereb Cortex. 2008;18:1415–1420. doi: 10.1093/cercor/bhm174. [DOI] [PubMed] [Google Scholar]
- McCrory EJ, Mechelli A, Frith U, Price CJ. More than words: a common neural basis for reading and naming deficits in developmental dyslexia? Brain. 2005;128:261–267. doi: 10.1093/brain/awh340. [DOI] [PubMed] [Google Scholar]
- Mechelli A, Gorno-Tempini ML, Price CJ. Neuroimaging studies of word and pseudoword reading: consistencies, inconsistencies, and limitations. J Cogn Neurosci. 2003;15:260–271. doi: 10.1162/089892903321208196. [DOI] [PubMed] [Google Scholar]
- Medler DA, Binder JR. MCWord: an on-line orthographic database of the English language [Internet] 2005. Available from: http://www.neuro.mcw.edu/mcword/ [Google Scholar]
- Oldfield RC. The assessment and analysis of handedness: the Edinburgh inventory. Neuropsychologia. 1971;9:97–113. doi: 10.1016/0028-3932(71)90067-4. [DOI] [PubMed] [Google Scholar]
- Paulson MJ, Lin T. Predicting WAIS IQ from Shipley-Hartford scores. J Clin Psychol. 1970;26:453–461. doi: 10.1002/1097-4679(197010)26:4<453::aid-jclp2270260415>3.0.co;2-v. [DOI] [PubMed] [Google Scholar]
- Plaut DC, McClelland JL, Seidenberg MS, Patterson K. Understanding normal and impaired word reading: computational principles in quasi-regular domains. Psychol Rev. 1996;103:45–115. doi: 10.1037/0033-295x.103.1.56. [DOI] [PubMed] [Google Scholar]
- Polk TA, Farah MJ. Functional MRI evidence for an abstract, not perceptual, word-form area. J Exp Psychol Gen. 2002;131:65–72. doi: 10.1037//0096-3445.131.1.65. [DOI] [PubMed] [Google Scholar]
- Potter MC, Faulconer B. Time to understand pictures and words. Nature. 1975;253:437–438. doi: 10.1038/253437a0. [DOI] [PubMed] [Google Scholar]
- Price CJ, Devlin JT. The myth of the visual word form area. Neuroimage. 2003;19:473–481. doi: 10.1016/s1053-8119(03)00084-3. [DOI] [PubMed] [Google Scholar]
- Price CJ, Devlin JT. The Interactive Account of ventral occipitotemporal contributions to reading. Trends Cogn Sci. 2011;15(6):246–253. doi: 10.1016/j.tics.2011.04.001. [DOI] [PMC free article] [PubMed] [Google Scholar]
- Price CJ, McCrory E, Noppeney U, Mechelli A, Moore CJ, Biggio N, Devlin JT. How reading differs from object naming at the neuronal level. Neuroimage. 2006;29:643–648. doi: 10.1016/j.neuroimage.2005.07.044. [DOI] [PubMed] [Google Scholar]
- Reicher GM. Perceptual recognition as a function of meaningfulness of stimulus material. J Exp Psychol. 1969;81:274–280. doi: 10.1037/h0027768. [DOI] [PubMed] [Google Scholar]
- Reinholz J, Pollmann S. Differential activation of object-selective visual areas by passive viewing of pictures and words. Brain Res Cogn Brain Res. 2005;24:702–714. doi: 10.1016/j.cogbrainres.2005.04.009. [DOI] [PubMed] [Google Scholar]
- Richlan F, Kronbichler M, Wimmer H. Functional abnormalities in the dyslexic brain: a quantitative meta-analysis of neuroimaging studies. Hum Brain Mapp. 2009;30:3299–3308. doi: 10.1002/hbm.20752. [DOI] [PMC free article] [PubMed] [Google Scholar]
- Saad ZS, Glen DR, Chen G, Beauchamp MS, Desai R, Cox RW. A new method for improving functional-to-structural MRI alignment using local Pearson correlation. Neuroimage. 2009;44:839–848. doi: 10.1016/j.neuroimage.2008.09.037. [DOI] [PMC free article] [PubMed] [Google Scholar]
- Sakurai Y, Takeuchi S, Takada T, Horiuchi E, Nakase H, Sakuta M. Alexia caused by a fusiform or posterior inferior temporal lesion. J Neurol Sci. 2000;178:42–51. doi: 10.1016/s0022-510x(00)00363-4. [DOI] [PubMed] [Google Scholar]
- Sandak R, Mencl WE, Frost SJ, Rueckl JG, Katzl L, Moore DL, Mason SA, Fulbright RK, Constable RT, Pugh KR. The neurobiology of adaptive learning in reading: a contrast of different training conditions. Cogn Affect Behav Neurosci. 2004;4:67–88. doi: 10.3758/cabn.4.1.67. [DOI] [PubMed] [Google Scholar]
- Schurz M, Sturm D, Richlan F, Kronbichler M, Ladurner G, Wimmer H. A dual-route perspective on brain activation in response to visual words: evidence for a length by lexicality interaction in the visual word form area (VWFA) Neuroimage. 2010;49:2649–2661. doi: 10.1016/j.neuroimage.2009.10.082. [DOI] [PMC free article] [PubMed] [Google Scholar]
- Schwarzlose RF, Baker CI, Kanwisher N. Separate face and body selectivity on the fusiform gyrus. J Neurosci. 2005;25:11055–11059. doi: 10.1523/JNEUROSCI.2621-05.2005. [DOI] [PMC free article] [PubMed] [Google Scholar]
- Seidenberg MS, McClelland JL. A distributed, developmental model of word recognition and naming. Psychol Rev. 1989;96:523–568. doi: 10.1037/0033-295x.96.4.523. [DOI] [PubMed] [Google Scholar]
- Sevastianov A, Horwitz B, Nechaev V, Williams R, Fromm S, Braun AR. fMRI study comparing names versus pictures of objects. Hum Brain Mapp. 2002;16:168–175. doi: 10.1002/hbm.10037. [DOI] [PMC free article] [PubMed] [Google Scholar]
- Shaywitz SE. Dyslexia. N Engl J Med. 1998;338:307–312. doi: 10.1056/NEJM199801293380507. [DOI] [PubMed] [Google Scholar]
- Snodgrass JG, Vanderwart M. A standardized set of 260 pictures: norms for name agreement, image agreement, familiarity, and visual complexity. J Exp Psychol Hum Learn Mem. 1980;6:174–215. doi: 10.1037//0278-7393.6.2.174. [DOI] [PubMed] [Google Scholar]
- Starrfelt R, Gerlach C. The visual what for area: words and pictures in the left fusiform gyrus. Neuroimage. 2007;35:334–342. doi: 10.1016/j.neuroimage.2006.12.003. [DOI] [PubMed] [Google Scholar]
- Starrfelt R, Habekost T, Leff AP. Too little, too late: reduced visual span and speed characterize pure alexia. Cereb Cortex. 2009;19:2880–2890. doi: 10.1093/cercor/bhp059. [DOI] [PMC free article] [PubMed] [Google Scholar]
- Szwed M, Dehaene S, Kleinschmidt A, Eger E, Valabrègue R, Amadon A, Cohen L. Specialization for written words over objects in the visual cortex. Neuroimage. 2011;56(1):330–344. doi: 10.1016/j.neuroimage.2011.01.073. [DOI] [PubMed] [Google Scholar]
- Talairach J, Tournoux P. Co-planar stereotaxic atlas of the human brain. New York: Thieme Medical Publishers; 1988. [Google Scholar]
- Vinckier F, Dehaene S, Jobert A, Dubus J, Sigman M, Cohen L. Hierarchical coding of letter strings in the ventral stream: dissecting the inner organization of the visual word-form system. Neuron. 2007;55:143–156. doi: 10.1016/j.neuron.2007.05.031. [DOI] [PubMed] [Google Scholar]
- Wagner RK, Torgesen JK. The nature of phonological processing and its causal role in the acquisition of reading skills. Psychol Bull. 1987;101:192–212. [Google Scholar]
- Warrington EK, Shallice T. Word-form dyslexia. Brain. 1980;103:99–112. doi: 10.1093/brain/103.1.99. [DOI] [PubMed] [Google Scholar]
- Wise RSJ, Scott SK, Blank SC, Mummery CJ, Murphy K, Warburton EA. Separate neural subsystems within ‘Wernicke's area’. Brain. 2001;124:83–95. doi: 10.1093/brain/124.1.83. [DOI] [PubMed] [Google Scholar]
- Wright N, Mechelli A, Noppeney U, Veltman DJ, Rombouts S, Glensman J, Haynes J-D, Price CJ. Selective activation around the left occipito-temporal sulcus for words relative to pictures: individual variability or false positives? Hum Brain Mapp. 2008;29:986–1000. doi: 10.1002/hbm.20443. [DOI] [PMC free article] [PubMed] [Google Scholar]
Associated Data
This section collects any data citations, data availability statements, or supplementary materials included in this article.