

Abstract
Background
The reasons for the reportedly high use of TV watching among older adults despite its potential negative health consequences are not known.
Purpose
To investigate age differences in time use and affective experience in TV use in a nationally representative sample
Methods
Using an innovative assessment of affective experience in a nationally representative sample, several putative reasons were examined for age-related increases in TV use. A sample of 3982 Americans aged 15–98 years who were assessed using a variant of the Day Reconstruction Method, a survey method for measuring how people experience their lives, was analyzed. To understand age increases in TV use, analyses examined whether older people (1) enjoy TV more, (2) watch TV because it is less stressful than alternatives, or whether (3) TV use related to age differences in demographics, being alone, or life satisfaction. Data were collected in 2006 and analyzed in 2008–2009.
Results
Adults aged >65 years spent threefold more waking time watching TV than young adults. Despite this trend, older people enjoyed TV less, in contrast to stable enjoyment with other leisure activities. Older adults did not seem to experience the same stress buffering effects of watching TV as did young and middle-aged adults. This negative age-associated trend in how TV was experienced was not accounted for by demographic factors or in time spent alone. Greater TV use, but not time spent in other leisure activities, was related to lower life satisfaction.
Conclusions
Older adults watch more TV but enjoy it less than younger people. Awareness of this discrepancy could be useful for those developing interventions to promote reduced sedentary behaviors in older adults.
INTRODUCTION
An average American spends 4.5 hours watching TV per day,1 representing an increase of 1 hour over the past decade2 Public health efforts to measure and alter TV use have focused on children and adolescents.3-5 Yet, time use surveys indicate that older adults watch more TV than do younger and middle-aged adults. In the American Time Use Survey, TV watching accounted for 25%–30% of waking time and half of leisure activity among adults aged >65 years,6 with an earlier time budget study estimating that 15%–23% of older adults’ time was spent watching TV.7
TV use is a common sedentary activity, and more time spent in sedentary activity predicts negative age-associated changes in many aspects of health, as seen in indicators of cardiovascular (e.g., lipid profiles), musculoskeletal (e.g., bone health), and cellular function.8,9 TV use in particular has been linked with greater risk for obesity and type 2 diabetes,10 lower life satisfaction11, less frequent engagement in social and physical recreation,12,13 and increased risk for dementia14. The mechanisms of TV use on poor health are unclear, perhaps a combination of reduced energy expenditure, increased caloric intake,15 reduction in time spent in cognitively and/or physically challenging activities,16 and/or negative influence of TV content on health-related attitudes.17
One might assume that people watch TV because they enjoy it, despite the associated negative consequences. However, heavy TV watchers tend to report greater dissatisfaction with life.11 It is unclear whether watching TV makes its users unhappy, or if TV is a “refuge” for less happy people18. Despite watching more TV, older adults report similar or higher levels of positive affect, lower levels of negative affect, and greater life satisfaction compared to younger and middle-aged adults19-21. Therefore, the findings that TV watching predicts reduced life satisfaction across age groups and that TV use increases dramatically with age conflict with overall positive age-associated change in subjective well being.
Why do older people watch so much TV if it could harm their health? One possibility is that older adults may enjoy TV more than younger adults because they have fewer alternative demands of their time (e.g., working).11 Another possibility is that older adults may use TV to regulate negative emotions. In one study that used experience sampling across a 7-day period, older adults reported lower levels of both positive and negative affect while watching TV compared to other activities22. In light of the negative health associations with TV use in older adults, understanding the affective and social contextual experience of TV use in older people will aid in directing efforts to alter TV use.
This study is the first involving a nationally representative sample to examine interactions among age, time allocated to TV watching, and affective experience. The data were collected using a variant of the Day Reconstruction Method (DRM23), a diary-based survey measure of time use and affect, which enables the measurement of affective experience in daily life in large representative samples. Based on prior studies, it was hypothesized that older adults would allocate more time to TV watching than younger people, and older adults would have more favorable ratings of experienced affect regardless of activity. Data were used on affective experience during TV, other leisure, and nonleisure activities to examine whether TV is more pleasurable to older people than younger people and/or, as in previous study, is associated with reduced negative affect relative to alternative activities.
METHODS
Sample Population
Participants completed the Princeton Affect and Time Survey (PATS), a telephone survey which integrated the American Time Use Survey (ATUS)24 and a variant of the DRM.23 More details about the PATS study methods are available elsewhere.25, 26 Briefly, the purpose of PATS was to characterize affective experiences and time allocation in a wide range of activities of a large representative sample of adolescent and adult Americans. Data were obtained from random-digit-dialing of people aged >15 years in the continental U.S., with every residential telephone number having an equal probability of being called. One participant per household was selected, based on the proximity in time to the closest birthday. Participants were told that they could withdraw from the study at any time and refuse to answer any question. Interviews were conducted in English and Spanish, according to the selected respondents’ preference.
Data Collected
The questionnaire was programmed for Computer Assisted Telephone Interviewing with software used by the Bureau of Labor Statistics for data collection employed in the ATUS program. The survey was administered by the Gallup Organization in 2006 and analyses were conducted in 2008–2009.
Participants were asked to detail the previous day, from 4 am to the succeeding 4 am. As in prior studies using the DRM23, participants were first asked to divide the day into successive “episodes”, describing the sequence of their day. Next, participants were asked to rate episodes on contextual and affective questions. Only three episodes were randomly selected for rating, in order to shorten the phone survey protocol. Two types of activities were excluded from ratings: sleeping and grooming. The remainder of the day was divided into 15-minute intervals superimposed on the episodes, with each interval equally likely to be selected.
For each of the three activities, respondents were asked about the extent to which they experienced six different feelings (happy, interested, sad, stressed, in pain, and tired), on a Likert scale from 0 (not at all) to 6 (very strong). These feelings were presented in random order across participants. The present analysis was focused on the three affect ratings (happy, sad, and stressed) given the focus on positive and negative affect. Age effects on the experience of pain26 and feeling tired have been previously reported23. Participants also described who they were with during that episode (e.g., alone, with friends) and where they were (e.g., at home). Activities were coded in the ATUS lexicon 24. For this paper, the activities of interest were (1) watching TV, (2) all other activities in the category “Socializing, Relaxing, and Leisure” (e.g., reading, socializing), and (3) all other nonleisure activities.
Participants were also asked to provide demographic information (e.g., age, gender, racial category) as well a standard rating of overall life satisfaction (“in general, how satisfied are you with your life?”) on a scale from 1 (not at all satisfied) to 4 (very satisfied).
Statistical Analysis
Survey response rates were calculated using guidelines from the American Association for Public Opinion Research27. Sample weights were computed by the Gallup Organization based on estimates from the Current Population Survey in an attempt to make the sample representative of the U.S. population. Weights were adjusted for age, gender, ethnic origin, and geographic region within the U.S. Fourteen participants had missing data on age and were excluded. Multiple imputation was used to address missing data on demographic variables other than age. First, unadjusted data from describing activity participation and affect ratings were examined. To assess the significance of age effects on time use, generalized estimating equations were used to calculate the linear relationship between age and activity participation (e.g., TV use, leisure activities) with a random factor representing intra-individual correlation for the three episodes collected per participant. The following covariates were adjusted for, estimating the effect of age on activity patterns: gender, race/ethnicity, educational attainment, income, worked in past week, and living alone. Next, age effects on happiness, stress, and sadness ratings were tested using linear mixed-effects models, again with subjects as a random effect and the same additional variables as above to adjust for effects as above. Binary activity codes (e.g., TV watching versus other activities) were entered, as well as an interaction term with age and activity codes. In regressions, it was ensured that predictor sets produced variance inflation factor <5 to mitigate against multicollinearity. Due to the large sample size, the study alpha was set to 0.01 to mitigate against the risk of Type 1 errors.
RESULTS
Sample Characteristics
A total of 3968 people completed the survey, yielding a total of 11,733 episodes. The AAPOR response rate was 37%, and the cooperation rate was 75%. Before sample weighting, the mean age was 51.4 years (SD=18.0; range 15–98 years). The sample was 61% female; 85% white, non-Hispanic; 7% African-American, non-Hispanic; 1% Asian non-Hispanic; and 7% Hispanic. Median education was “some college, no degree”, and annual household income was in the category $50,000–$74,000. A total of 55% were married, 16% lived alone, and 54% worked in past week. After applying sample weights for U.S. population figures, the mean age of the sample was younger (mean age 45.1 years), less likely to be female (53%) and less likely to be white, non-Hispanic (82%) than the unweighted figures.
Frequency of Television Watching and Other Leisure Activities with Age
There were a total of 1,858 episodes spent watching TV, representing 16% of all episodes. Within the broader ATUS category of “Socializing, Relaxing and Leisure”, which included reading, socializing, hobbies, and many other activities, TV watching was the single most common activity within each of the age groups (52% of category episodes overall).
In regard to age and TV use (Figure 1), the frequency of episodes devoted to TV and proportion of hours spent watching TV increased linearly after age 35 years. Generalized estimating equations revealed that age was a significant predictor of TV use (B=0.01, SD=0.0018, Wald chi-square=28.4,p<0.001) after adjusting for other variables. Not working in the past week, male gender, lower household income, lower education, and living alone were also significant predictors, whereas race/ethnicity was not. In contrast, age was not a significant predictor of non-TV leisure activity (B=0.001, SD=0.020,Wald Chi-square=0.25,p=0.613) (Not working and living with others were significant predictors).
Figure 1.
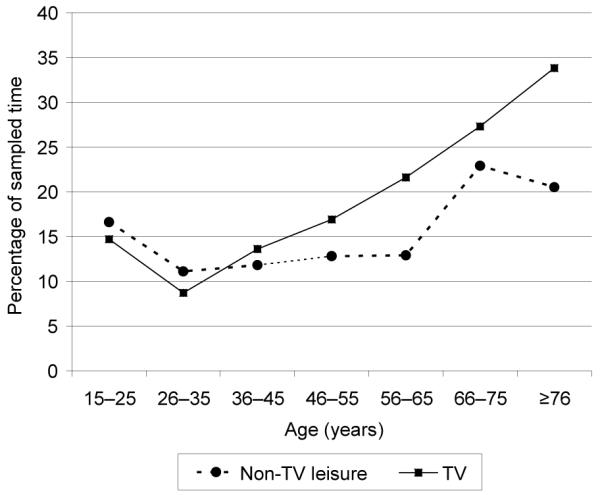
Percentage of sampled time engaged in TV and non-TV leisure activities by age
Note: Values are sample weighted. Percentage of sampled time (excluding sleeping and grooming) was calculated as duration engaged in the activity divided by summed duration of all sampled activities within each age strata.
Relationship of Age to Affect and Activity Participation
Consistent with previous study, mixed models revealed that age was positively associated with happiness ratings (estimate=0.006, SD=0.001,p<0.001), and the effect of TV on happiness was negative (estimate=−0.27, SD=0.048,p<0.001). The interaction term (age-by-TV) on happiness was significant (p<0.001), indicating that the experience of TV watching was related to less happiness with age. In contrast, a positive main effect for non-TV leisure activity was found (estimate=0.37, SD=0.05,p<0.001) and the age interaction term was not significant.
Mixed models revealed that older age was negatively associated with ratings of perceived stress (estimate= −0.009, SD=0.001,p<0.001) and positively related to sadness (estimate=0.003, SD=0.001,p<0.001). The addition of TV watching and TV-by-age interaction resulted in a main effect for TV watching indicating lower levels of stress during TV episodes (estimate=0.373, SD=0.06,p<0.001), but also a significant age-by-TV interaction indicating an attenuation of stress with age (p<0.001). Non-TV leisure activity was associated with a positive main effect indicating less stress relative to other activities (estimate= −0.395, SD=0.06,p<0.001); however, there was no significant interaction effect for age by non-TV use (p=0.171). Finally, there was a significant main effect of TV with greater experienced sadness (estimate= −0.121, SD=0.04,p=0.003), and a significant interaction with greater sadness during TV watching with age (p<0.001). However, there was no main effect in sadness for non-TV leisure activities (estimate=0.009, SD=0.04,p=0.832) and no interaction with age (p=0.974). Thus, TV watching was significantly associated with worse happiness and sadness ratings, with greater effects seen at older ages. TV watching was associated with less stress overall, but this effect was attenuated with age. In contrast, non-TV leisure activities were associated with greater happiness and lower ratings of perceived stress, which were not related to age.
The possibility that older adults do not like TV because they are more likely to watch it while alone was explored and revealed older age was indeed associated with increased overall time spent alone (estimate=0.010, SD=0.0023; p<0.001). However, watching while alone did not appear to be the reason that older adults liked TV less, as the age-by-alone interaction was not significant for TV episodes (estimate=0.001, SD=0.0031,p=0.812). Finally, whether life satisfaction ratings followed the same pattern as the momentary affect ratings was examined. The sample was split into participants reporting lower life satisfaction (“not at all satisfied”, “not satisfied”, “or “satisfied”, n=2182) in comparison to those with higher life satisfaction (“very satisfied”,n=1718). In GEE analyses, TV watching was more common among participants with low life satisfaction, yet age did not significantly interact with TV use. In contrast, the proportion of time devoted to non-TV leisure activities was similar between high and low life-satisfaction groups.
DISCUSSION
This nationally representative study of Americans who completed a diary-based measure of activity and experienced affect indicated that older adults watched more TV than younger people, but enjoyed it less. Age-associated increases in TV watching were greater than those associated with other leisure activities, as in previous studies.24,28 The age-associated negative experience with TV watching contrasted general increases in experienced happiness and decreases in perceived stress associated with age. Other leisure activities such as reading, socializing, and relaxing, did not show these same age effects. Thus improvements in well being associated with older age seemed to have occurred in this sample despite the increasingly negative experience of watching TV.
Why would older people watch so much TV if it is associated with reduced happiness? One previously reported hypothesis, that TV is useful for regulating negative emotions22, finds no support in these data. Younger people reported lower negative affect while watching TV, but older people did not. The attenuated effect of TV on experienced stress appeared to be due to the lower stress ratings among older compared to younger adults, and alternative activities were not as stressful in older age. These findings were not better accounted for by demographic or social contextual issues related to age. In addition, there were age-related increases in TV watching in older adults with lower and higher life satisfaction, suggesting that TV is not simply a “refuge” for less happy older adults. There are some practical reasons why older adults may watch more TV than younger people. Older adults have more leisure time due to retirement. Watching TV is an easy leisure activity11, and the barriers to participating in other leisure activities often increase with age, particularly for more active leisure activities such as exercise29. Another possibility discussed elsewhere is lifespan TV use pattern may follow the typical course of addiction 30 in that greater consumption occurs even though pleasure derived from TV declines; alternatively the content of TV may be more directed toward and thus more pleasurable to younger people. Nevertheless, at the population level, encouraging alternatives to TV use may have its greatest impact in older adults.
There are several limitations to this study. A total of 37% of sampled individuals responded to the survey. Potential sample bias in representing the U.S. population was addressed by use of sample weights derived from the Current Population Survey. Even after sample weighting, the percentage of participants who were white, non-Hispanic was higher than that in the U.S. population. Previous work found that the allocation of time across activities in PATS and in the American Time Use Survey was quite similar26 and the proportion of time spent watching TV is similar to previous study6, 28. Nevertheless, it is certainly possible that other omitted variables related to study participation may have influenced TV use propensity, affective experiencing, or both. These data are cross-sectional and thus longitudinal data would be needed to better understand whether TV is a cause or consequence of unhappiness. In addition, future research should investigate the degree to which disabilities and other health limitations contribute to the increasing propensity to watch TV with age.
In summary, greater TV watching with age occurs despite the fact that older adults enjoy TV less than younger people, and do not receive the benefits of stress reduction, as younger adults do when they watch TV. Older adults may not be aware of the negative effects of TV. Studies in behavioral economics, including those that used the DRM, suggest that beliefs about what makes people happy do not always match their experienced happiness31, 32. Providing support for engaging activities can reduce TV use in older people,33 or adapting TV to be more interactive may also be beneficial34. Increasing public awareness of alternatives to TV watching could help to diminish the potential for associated negative health effects in older adults.
Figure 2.
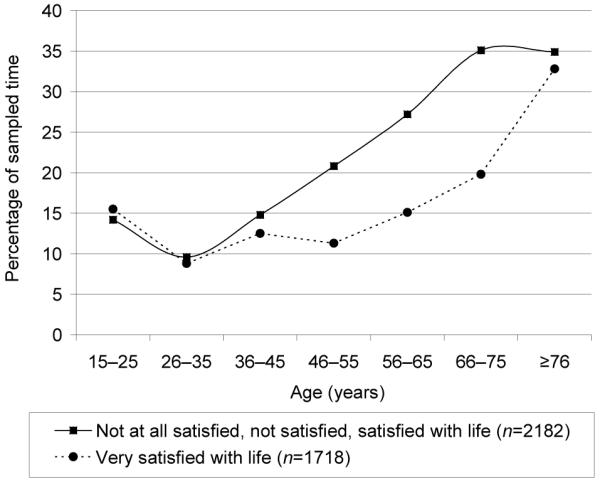
Percentage of sampled time TV watching by age and life satisfaction
Note: Values are sample weighted. Percentage of sampled time watching TV (excluding sleeping and grooming) was calculated as duration engaged in the activity divided by summed duration of all sampled activities within each age strata. Low life satisfaction (Not at all satisfied, not satisfied, satisfied; n= 2189); High Life Satisfaction (Very Satisfied; n=1729)
Acknowledgements
This work was supported, in part, by National Institute of Mental Health grants K23MH077225 and P30MH066248, by the Sam and Rose Stein Institute for Research on Aging. We thank Alan Krueger and his colleagues for permission to use the PATS data for this study. The PATS survey was funded by the National Institute of Aging (P30 AG024928), Hewlett Foundation and Princeton University.
Footnotes
Publisher's Disclaimer: This is a PDF file of an unedited manuscript that has been accepted for publication. As a service to our customers we are providing this early version of the manuscript. The manuscript will undergo copyediting, typesetting, and review of the resulting proof before it is published in its final citable form. Please note that during the production process errors may be discovered which could affect the content, and all legal disclaimers that apply to the journal pertain.
No financial disclosures were reported by the authors of this paper.
REFERENCES
- 1.Holmes G. Nielsen Media Research Reports Televisions Popularity Is Still Growing. 2006. http://www.nielsenmedia.com/nc/portal/site/Public/menuitem.55dc65b4a7d5adff3f65936147a062a0/?vgnextoid=4156527aacccd010VgnVCM100000ac0a260aRCRD.
- 2.Media N. Television audience. 2008. http://blog.nielsen.com/nielsenwire/wp-content/uploads/2009/07/tva_2008_071709.pdf.
- 3.Epstein LH, Paluch RA, Gordy CC, Dorn J. Decreasing sedentary behaviors in treating pediatric obesity. Arch Pediatr Adolesc Med. 2000;154(3):220–226. doi: 10.1001/archpedi.154.3.220. [DOI] [PubMed] [Google Scholar]
- 4.Epstein LH, Roemmich JN, Robinson JL, et al. A Randomized trial of the effects of reducing television viewing and computer use on body mass index in young children. Arch Pediatr Adolesc Med. 2008;162(3):239–245. doi: 10.1001/archpediatrics.2007.45. [DOI] [PMC free article] [PubMed] [Google Scholar]
- 5.Robinson TN. Reducing children’s television viewing to prevent obesity: a randomized controlled trial. JAMA. 1999;282(16):1561–1567. doi: 10.1001/jama.282.16.1561. [DOI] [PubMed] [Google Scholar]
- 6.Krants-Kent R, Stewart J. How do older Americans spend their time? Monthly Labor Review Online. 2007;130(5):8–26. [Google Scholar]
- 7.Moss MS, Lawton MP. Time budgets of older people: a window on four lifestyles. J Gerontol. 1982;37(1):115–123. doi: 10.1093/geronj/37.1.115. [DOI] [PubMed] [Google Scholar]
- 8.Cherkas LF, Hunkin JL, Kato BS, et al. The association between physical activity in leisure time and leukocyte telomere length. Arch Intern Med. 2008;168(2):154–158. doi: 10.1001/archinternmed.2007.39. [DOI] [PubMed] [Google Scholar]
- 9.Hamilton M, Healy G, Dunstan D, Zderic T, Owen N. Too little exercise and too much sitting: Inactivity physiology and the need for new recommendations on sedentary behavior. Current Cardiovascular Risk Reports. 2008;2(4):292. doi: 10.1007/s12170-008-0054-8. [DOI] [PMC free article] [PubMed] [Google Scholar]
- 10.Williams DM, Raynor HA, Ciccolo JT. A review of TV viewing and its association with health outcomes in adults. Am J Lifestyle Med. 2008;2(3):250–259. [Google Scholar]
- 11.Frey BS, Benesch CN, Stutzer A. Does watching TV make us happy? SSRN. 2005 [Google Scholar]
- 12.Bruni L, Stanca L. Watching alone: relational goods, television and happiness. Journal of Economic Behavior & Organization. 2008;65(3–4):506. [Google Scholar]
- 13.Hu FB, Li TY, Colditz GA, Willett WC, Manson JE. Television watching and other sedentary behaviors in relation to risk of obesity and type 2 diabetes mellitus in women. JAMA. 2003;289(14):1785–1791. doi: 10.1001/jama.289.14.1785. [DOI] [PubMed] [Google Scholar]
- 14.Rundek T, Bennett DA. Cognitive leisure activities, but not watching TV, for future brain benefits. Neurology. 2006;66(6):794–795. doi: 10.1212/01.wnl.0000209497.38834.d7. [DOI] [PubMed] [Google Scholar]
- 15.Ahuja S, Mohammed-Baksh S, Parkinson M. Effects of television watching on total food consumed: an experimental study. J Am Diet Assoc. 2008;108(9Suppl1):A39. [Google Scholar]
- 16.Matthews CE, Chen KY, Freedson PS, et al. Amount of time spent in sedentary behaviors in the U.S., 2003–2004. Am. J. Epidemiol. 2008;167(7):875–81. doi: 10.1093/aje/kwm390. [DOI] [PMC free article] [PubMed] [Google Scholar]
- 17.Levy BR. mind matters: cognitive and physical effects of aging self-stereotypes. J Gerontol B Psychol Sci Soc Sci. 2003;58(4):P203–211. doi: 10.1093/geronb/58.4.p203. [DOI] [PubMed] [Google Scholar]
- 18.Robinson J, Martin S. What do happy people do? Soc Indic Res. 2008;89(3):565–571. [Google Scholar]
- 19.Charles ST, Reynolds CA, Gatz M. Age-related differences and change in positive and negative affect over 23 years. J Pers Soc Psychol. 2001;80(1):136–51. [PubMed] [Google Scholar]
- 20.Mroczek DK., III Change in life satisfaction during adulthood: findings from the veterans affairs normative aging study. J Pers Soc Psychol. 2005;88(1):189–202. doi: 10.1037/0022-3514.88.1.189. AS. [DOI] [PubMed] [Google Scholar]
- 21.Mroczek DK, Kolarz CM. The effect of age on positive and negative affect: a developmental perspective on happiness. J Pers Soc Psychol. 1998;75(5):1333–49. doi: 10.1037//0022-3514.75.5.1333. [DOI] [PubMed] [Google Scholar]
- 22.Goodwin PE, Intrieri RC, Papini DR. Older adults affect while watching television. Activities, Adaptation & Aging. 2005;29(2):55–72. [Google Scholar]
- 23.Kahneman D, Krueger AB, Schkade DA, Schwarz N, Stone AA. A survey method for characterizing daily life experience: The Day Reconstruction Method. Science. 2004;306(5702):1776–1780. doi: 10.1126/science.1103572. [DOI] [PubMed] [Google Scholar]
- 24.Horrigan M, Herz D. A study in the process of planning, designing, and executing a survey program: The BLS American Time-Use Survey.A. North Holland; Amsterdam: 2005. [Google Scholar]
- 25.Krueger AB, Kahneman D, Schkade D, Schwarz N, Stone A, editors. National Time Accounting: The Currency of Life. University of Chicago Press; Chicago: 2009. [Google Scholar]
- 26.Krueger AB, Stone AA. Assessment of pain: a community-based diary survey in the USA. The Lancet. 2008;371(9623):1519. doi: 10.1016/S0140-6736(08)60656-X. [DOI] [PubMed] [Google Scholar]
- 27.Research TAAfPO . standard definitions: final dispositions of case codes and outcome rates for surveys. 4th edition AAPOR; Lenexa,Kansas: 2006. [Google Scholar]
- 28.Gauthier AH, Smeeding TM. Time use at older ages: cross-national differences. Res Aging. 2003;25(3):247–274. [Google Scholar]
- 29.Manini TM, Everhart JE, Patel KV, Schoeller DA, Colbert LH, Visser M, et al. Daily activity energy expenditure and mortality among older adults. JAMA. 2006;296(2):171–179. doi: 10.1001/jama.296.2.171. [DOI] [PubMed] [Google Scholar]
- 30.Kubey R, Csikszentmihalyi M. Television addiction is no mere metaphor. Sci Am. 2002;286(2):74–80. doi: 10.1038/scientificamerican0202-74. [DOI] [PubMed] [Google Scholar]
- 31.Kahneman D, Krueger AB, Schkade D, Schwarz N, Stone AA. Would you be happier if you were richer? A focusing illusion. Science. 2006;312(5782):1908–10. doi: 10.1126/science.1129688. [DOI] [PubMed] [Google Scholar]
- 32.Schkade DA, Kahneman D. Does living in California make people happy? A focusing illusion in judgments of life satisfaction. Psychol Sci. 1998;9(5):340–346. [Google Scholar]
- 33.Studenski S, Carlson MC, Fillit H, Greenough WT, Kramer A, Rebok GW. from bedside to bench: does mental and physical activity promote cognitive vitality in late life? Sci. Aging Knowl. Environ. 2006;2006(10):pe21. doi: 10.1126/sageke.2006.10.pe21. [DOI] [PubMed] [Google Scholar]
- 34.Rosenberg D, Depp C, Reichstadt J, et al. Exergames for subsyndromal depression in older adults: a pilot study of a novel intervention. Am J Geriatr Psychiatry. 2010;18(3):221–6. doi: 10.1097/JGP.0b013e3181c534b5. [DOI] [PMC free article] [PubMed] [Google Scholar]