INTRODUCTION
Tumor imaging in veterinary medicine is focused primarily on assessing morphologic features. Radiography, sonography, computed tomography (CT) and magnetic resonance imaging (MRI) are applied regularly to identify and stage solid tumors. This information is used primarily for treatment planning, but some specific tumor characteristics extracted from morphologic images, such as location1, 2 and volume2, 3, have prognostic significance as well.
The identification of factors that enable prediction of treatment outcome is important with regard to selection of the optimal therapy. Tumors known to be less responsive can be directed to alternate or investigational therapies. Unfortunately, the amount of prognostic information that can be obtained from morphologic images is limited. On a broader scale, as tumor biology became understood at the molecular level, various markers of the tumor microenvironment that could be quantified in biopsy specimens and were related to outcome were identified. These include the enzyme cyclooxygenase-2 4, 5, the vascular endothelial growth factor signal protein6, 7 and the proliferation marker Ki-678, 9, to name only a few. And, as the canine genome became characterized10, prognosis based on the gene signature of a tumor is now possible.11-13 However, sampling error is a significant problem associated with these tissue-based invasive measures of the tumor microenvironment. That is, the quantitative results from limited sampling may not be representative of what is occurring on a broader, clinically significant, scale within the tumor. The exact number and location of biopsies to acquire are important and often overlooked factors14, 15. This could lead to a misrepresentation of the biologic character of the tumor being assessed. There is a need for clinically significant noninvasive volumetric measures of the tumor microenvironment.
Imaging techniques aimed at assessing dynamic physiologic properties of the tumor tissue rather than strictly assessing tumor morphology fall under the category of functional imaging. The goals of functional imaging are to improve the diagnosis and staging of cancer, thus improving treatment choices, and to portray the effectiveness of treatment earlier and more accurately, thus reducing mortality and improving the likelihood of a cure.16. Importantly, functional imaging techniques are noninvasive and can be used to quantify the parameter of interest throughout the entirety of the tumor, eliminating the problem of sampling error. Functional parameters linked to tissue physiologic properties can also be quantified sequentially over time. The last decade has seen interest develop in human tumor functional imaging at a fever pitch. Although there are limited applications of functional imaging in veterinary oncology at this time, use will increase as the technology becomes more available and the advantages recognized more completely. It is important for veterinary oncologists to be familiar with basic functional imaging techniques to maximize their application.
The most common functional tumor imaging techniques are positron emission tomography (PET), dynamic CT, and functional MRI. Of these three modalities, CT is used the least for functional, quantitative tumor imaging due to the radiation dose concerns, since quantitative imaging requires multiple repeat measurements. Use of PET for functional imaging of human cancer has exploded in the past decade. Most PET functional imaging studies involve quantification of intratumoral glucose metabolism using 18F-labeled deoxyglucose. Emphasis in human PET studies focuses on tumor localization and response to therapy17. A review of PET technology and applications related to veterinary medicine has been published recently.18.
Parameters that can be quantified using functional imaging include perfusion, proliferation, and oxygenation, and also the activity of specific molecules, such as glucose. Perfusion is important because of its relationship to drug delivery and the genesis of tumor hypoxia that can lead to up-regulation of genes that control tumor aggressiveness.19. Hypoxia has also been linked to outcome following radiation therapy20. Direct measurement of tumor hypoxia using needle electrodes or quantification of hypoxia markers in biopsy specimens has been validated, but these are invasive techniques and also subject to sampling error21. Assessing tumor perfusion has been suggested as a surrogate method of assessing tumor hypoxia22. A convenient method to assess tumor perfusion could be a great advantage in characterizing the response of common canine and feline tumors to therapy and in identification of patients likely to respond. In this paper, we review the technique of dynamic contrast enhanced-MRI (DCE-MRI), and how this can be used to characterize tumor perfusion prior to, during, and following treatment.
DCE-MRI enables non-invasive quantitative assessment of tissue vessel density, integrity, and permeability. The information generated from DCE-MRI can be applied to study of angiogenesis, hypoxia, and evaluation of various biomarkers. DCE-MRI has been used in the studies of human and animal tumor models for diagnosis, characterization of predictive prognostic factors, monitoring of treatment response, and evaluation of the efficacy of novel treatment developments. The benefit of DCE-MRI continues to emerge as the technique is optimized and the functional parameters are better understood in relation to their underlying physiologic correlates. Reproducibility of DCE-MRI results in the same tumor, and also between different institutions and imaging protocols, is an important factor in determining the significance of observed changes that are detected with treatments. As advances are made toward improving the utility of DCE-MRI and interpreting biologic associations, it will become an even more invaluable tool in the study and treatment of cancer. This review article will provide a summary of the derivation of the models developed to assess the DCE-MRI technique, the applications to the study and treatment of human and animal cancer, and challenges in reproducibility.
TECHNIQUE/REVIEW
The pathophysiology of tumor growth and metastatic spread is dependent on angiogenesis. Tumors only develop to a diameter of a few millimeters before they outgrow their oxygen and nutrient demands, requiring the formation of new vessels if the tumor is to continue to proliferate. This angiogenic response involves a cascade of events in which mature, resting host endothelial cells are stimulated to proliferate, degrade their basement membranes, and form new blood vessels.23 Angiogenesis is highly regulated in the normal tissue microenvironment with the development of an organized structure of arterioles, capillaries, and venules. Neovascularization of normal tissue results in efficient distribution of nutrients to maintain normal homeostasis. Angiogenesis within tumor tissue is abnormal and dysregulated and results in the formation of irregular, tortuous, and fragile vessels which are highly permeable. Permeability is increased because of structural abnormalities in the endothelial lining including large gaps or channels between and within endothelial cells, discontinuous basement membranes, and loosely adherent pericytes, resulting in large fenestrations capable of leaking large proteins24. The technique of DCE-MRI exploits this abnormal tumor microvasculature, estimating the vessel permeability and other physiologic parameters.
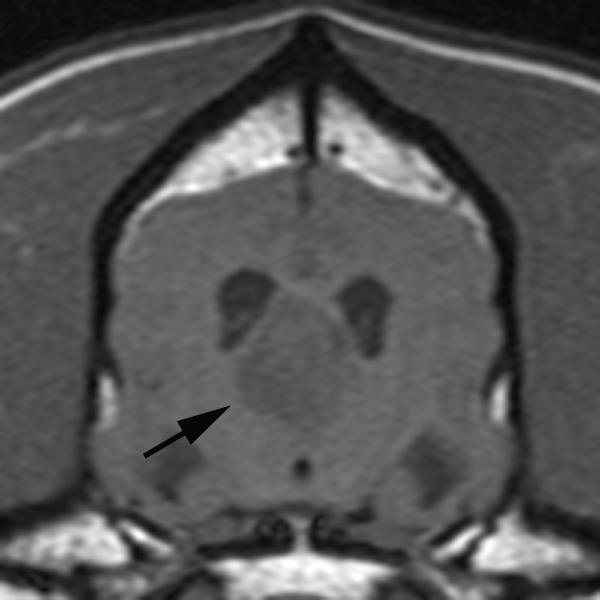
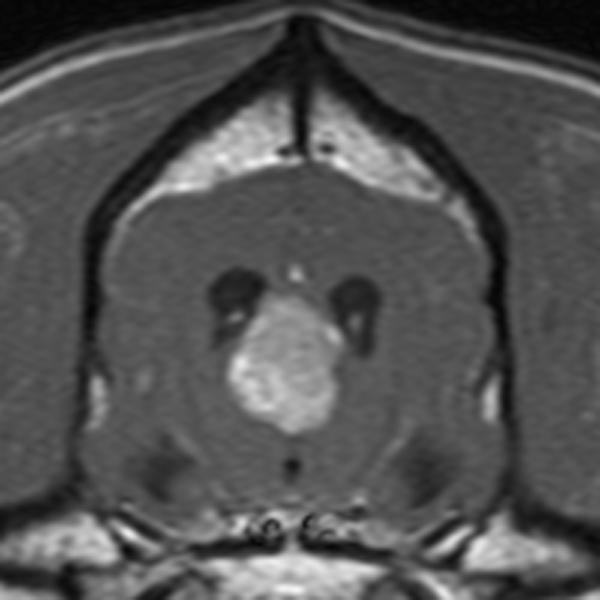
In conventional contrast-enhanced MRI, a single snapshot of tumor enhancement is obtained after contrast medium administration (Figure 1) 24. This information is valuable for morphologic localization of abnormalities, but it does not provide insight toward characterizing the biologic condition of the tissue. DCE-MRI, on the other hand, relies on fast repeated image acquisition before, during, and after the rapid intravenous administration of a low molecular weight, gadolinium based (Gd-DTPA, 567 Daltons) contrast medium 24. The resulting temporal change in signal intensity within the tumor reflects a composite of tumor perfusion, vessel permeability, and the volume of the extravascular-extracellular space 25. DCE-MRI, therefore, enables the depiction of physiologic alterations as well as morphologic changes. Importantly, this quantification can be done on a per-voxel basis, enabling quantification of perfusion at the millimeter level.
Figure 1.
Pre-contrast (A) and post-contrast (B) T1-weighted images of a canine brain with a choroid plexus tumor in the third ventricle. In the pre-contrast image, the tumor (black arrow) has slightly less signal than normal brain due to increased water content within the tumor. Following intravenous administration of a gadolinium-containing contrast agent, the signal of the tumor increases due to the T1-shortening effect of the gadolinium which is at increased concentration in the tumor due to a defective blood brain barrier.
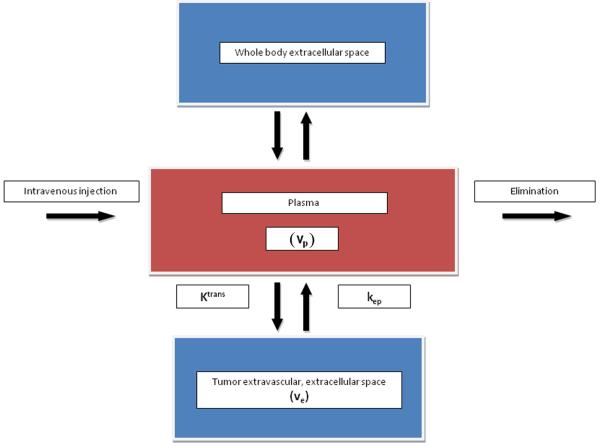
When a paramagnetic, low-molecular weight contrast medium is injected intravenously, it enters tumor blood vessels and subsequently leaks into the extra-vascular extracellular space 26. In tumors, typically 12-45% of the contrast medium leaks into the extracellular space during the first pass.26 Once out of the blood vessels, the contrast medium diffuses freely within the interstitial space until the whole body distribution and renal excretion lowers the vascular concentration below that in the interstitial space, at which stage contrast medium passes back into the vascular space26. The three major factors that determine the behavior of a low molecular weight contrast medium in tissue during the first few minutes after injection are: blood perfusion (contrast medium delivery), transport of contrast medium across vessel walls, and diffusion of contrast medium in the interstitial space (Figure 2)26. If the delivery of contrast medium to a tissue is insufficient to maintain a higher vascular concentration compared to that in the extracellular space, then blood perfusion will be the dominant factor determining contrast medium kinetics26. This is seen commonly in tumors and is described as a flow-limited situation or where vascular permeability is greater than inflow. If tissue perfusion is sufficient and transport out of the vasculature does not deplete intravascular contrast medium concentration, then transport across the vessel wall is the major factor that determines contrast medium kinetics26. These are described as non-flow limited situations and may be seen in areas of fibrosis or tissue atrophy. As low molecular weight contrast media do not cross cell membranes, their volume of distribution is effectively the interstitial, or extracellular, space26. These differences in contrast medium behavior between normal and neoplastic tissues are exploited by DCE-MRI to provide tissue specific information.
Figure 2.
Body compartment distribution of low molecular weight contrast medium after intravenous injection. The contrast medium transfer from the plasma (vp) into the extracellular, extravascular space (ve) is described by the transfer constant (Ktrans). The contrast medium flows back to the plasma at the rate constant (kep) as plasma concentration decreases due to whole body distribution and elimination.
DCE-MRI imaging sequences are mainly those that are sensitive to the presence of contrast medium in the extracellular space, thus reflecting microvessel perfusion, permeability, and the extracellular leakage space; these are called T1- or relaxivity-based methods26. Common DCE techniques incorporate T1-weighted gradient-echo sequences27. A specific discussion of these pulse sequences is beyond the scope of this paper. What is important is that these pulse sequences enable the estimation of tissue T1-relaxation rate for each voxel of the image27. The T1 spin-lattice relaxation rate* is the time constant describing the rate of spin recovery along the direction of the main magnetic field after being flipped into a transverse plane by a radiofrequency pulse (Figure 3). The T1-relaxation rate is determined prior to administration of gadolinium by using one of various methods 28.
Figure 3.
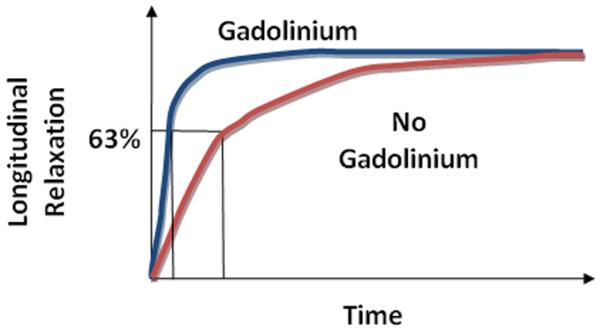
T1 longitudinal relaxation of tissue vs. time with and without Gadolinium-based contrast agent administration. Gadolinium results in more rapid longitudinal relaxation.
The gadolinium contrast medium used for DCE-MRI is a paramagnetic agent. Paramagnetic means that the agent exerts magnetic properties only in the presence of an external magnetic field. Gadolinium results in shortening of the T1-relaxation time in a concentration-dependent manner, which in turn results in an increase in signal in a T1-weighted MR image (Figure 3). Therefore, if the native T1-relaxation time, sometimes referred to as T10, is known in each voxel, the gadolinium concentration can be estimated according to the magnitude of the increased signal intensity resulting from the contrast medium causing shortening of the T10 in the voxel. . This quantification can be done throughout the entire tumor volume.
The degree of signal intensity enhancement seen on T1-weighted images following gadolinium administration is dependent on a number of physiologic and physical factors. Physiologic factors include tissue perfusion, capillary surface area, vessel permeability to the contrast medium, and volume of the extracellular leakage space. Physical factors include native T1-relaxation rate of the tissue, dose of contrast medium, imaging sequence and parameters used, the gain and scaling factors27.
To formulate common standardization, the U.S. National Cancer Institute established guidelines for acquiring DCE-MRI studies to assess tumor vascularity. At a minimum, three planes through the tumor must be imaged and the field of view must include a region of normal tissue outside of the tumor, such as an artery or muscle for normalization24. The quantity of contrast medium injected should be standardized according to the patient’s body weight and should be injected preferentially at a constant rate with a power injector24. After injection, serial image sets are obtained at temporal resolutions ranging from 2–15 seconds for 5–10 minutes24. An MRI system with high field strength and fast temporal resolution is a requirement to obtain meaningful data from DCE-MRI studies. Most DCE-MRI work to date has been done at 1.5T, although the procedure can be performed at 1.0T. Higher field strength leads to increased signal to noise and improved spatial resolution. On the other hand, fast temporal resolution is necessary to quantify pharmacokinetic parameters accurately. In reality, there is always a tradeoff between spatial and temporal resolution. Ideally, the entire tumor volume should be imaged rather than a few selected planes, to depict the possible heterogeneity of perfusion parameters. Signal intensity changes with time can be used to derive physiologic indices based on quantitative pharmacokinetic models, or a qualitative assessment of the curves can be done using kinetic model free variables26.
Quantitative kinetic parameters are derived from gadolinium concentration vs. time curves that are fitted to one of the known pharmacokinetic models (Figure 4)26. The most commonly used model is the two compartment pharmacokinetic model proposed by Tofts et al29. This quantitative analysis involves evaluation of some combination of principal kinetic parameters: the transfer constant (Ktrans), the extravascular extracellular space (EES) fractional volume (ve), the rate constant (kep), and the fractional plasma volume (vp) (Figure 2). The Ktrans (min−1) is transendothelial transport of contrast medium from the vascular compartment to the tumor interstitium. The kep (min−1) reflects the reverse transport of contrast medium back into the vascular space. Ktrans and ve relate to the tissue’s basic physiology, whereas the rate constant (kep) is the ratio of the transfer constant to the EES29:
kep can be derived from the shape of the gadolinium concentration vs. time results, whereas Ktrans and ve require knowledge of the absolute values of gadolinium concentration. Ktrans has several physiologic interpretations, depending on the tissue’s vascular permeability and perfusion.
Figure 4.
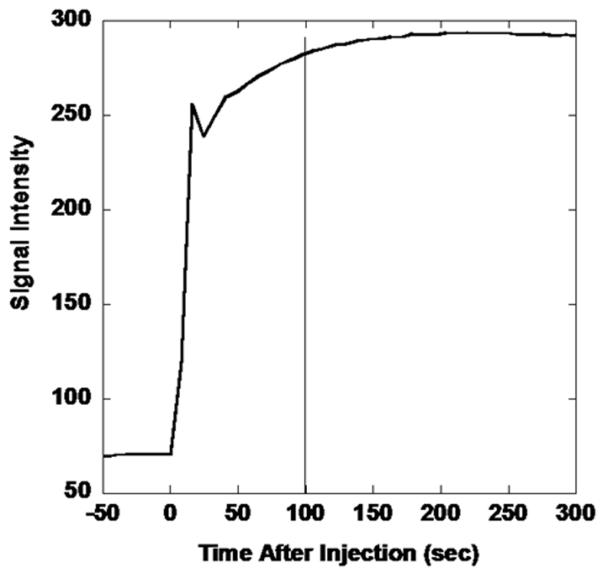
MRI-derived signal intensity vs. time curve for extremity soft tissue sarcoma following intravenous contrast medium administration. Images are acquired dynamically prior to and following gadolinium injection. The T1-signal increases rapidly as gadolinium reaches the tumor, leading to T1-shortening. The sharp decline followed by a continued rise is due to recirculation.
Quantitative parameters are more complicated to derive than qualitative ones derived from curve shape, which deters their standard use. The pharmacokinetic model chosen may not fit the data obtained exactly, and each model makes a number of assumptions that may not be valid for every tissue or tumor type27. Some use in-house software written by medical imaging physicists based on preferred models. There also are few clinically-oriented commercial software programs that perform model-based analysis; however commercial programs can be quite costly. While there is some variability between software programs used for processing the DCE-MRI data, it is the lack of generalized image acquisition methods and variations between MRI scanners that results in the greatest challenge in obtaining comparable quantifiable DCE-MRI data. It is known that DCE imaging can result in different signal enhancement under the same conditions when different scanners are used.30 These findings emphasize the need for calibration methods to solve this problem in order to allow for comparable and standardized DCE examinations.30 Some organized efforts are being taken, such as the Quantitative Imaging Biomarkers Alliance (QIBA) of the Radiological Society of North America, in order to improve the value and practicality of quantitative imaging through defining standardization procedures to reduce the inherent variations across different hardware and software.
The arterial input function (AIF) is usually used in conjunction with a quantitative two compartment model to insure that the output parameters are not influenced by the rate of contrast medium injection or patient-to-patient variation in baseline blood flow rate 24. Hence, AIF optimizes the quantitative kinetic analysis and is quantified by measuring the signal from an artery near the tumor24. However, if there are artifacts introduced during the acquisition of the AIF, it can propagate additional errors into the analysis24. Direct measurement of the AIF using MRI could be subject to significant errors due to multiple causes, including the lack of a major artery in the field of view31. As a solution, use of a group averaged, or fixed, AIF has been proposed, which can be obtained from human or animal population data. Although a fixed AIF is easy to implement and can lead to reproducible estimates of kinetic parameters, inaccurate results due to patient-to-patient variations in the AIF that are not captured by the fixed AIF is a concern31. In fact, 3.6-fold differences in the area under the individual measured AIF curves have been observed31 .
As an alternative to measuring the AIF in each patient individually, reference region models for AIF estimation have gained increasing attention. Instead of using the MRI signal from a local feeding artery, reference region models use the dynamic contrast enhancement of a normal tissue, most commonly muscle, as well as tumor, to determine the AIF inversely31.
Quantification of DCE-MRI data can be complex, and the question remains whether it is necessary to quantify imaging data to answer clinical questions. In many cases, correlation with tumor stage and response to treatment can be more easily, perhaps even more reproducibly, obtained using qualitative parameters.32 A qualitative assessment of perfusion based on the shape of the signal intensity vs. time curve may also be useful clinically for tissue characterization and for assessing response to treatment. Model free indices describe tissue enhancement using a number of descriptors including onset of enhancement (time from injection or first appearance to the first increase in tissue signal intensity), initial and mean gradient of the upsweep of the signal intensity vs. time curve, maximum signal intensity, or the washout gradient (Figure 5) and a semi-quantitative integral or initial area under gadolinium concentration vs. time curve (iAUGC) or signal enhanced curves over fixed periods of time.26 Such model free parameters have the advantage of being relatively straightforward to calculate and can be used when quantitative techniques fail.
Figure 5.
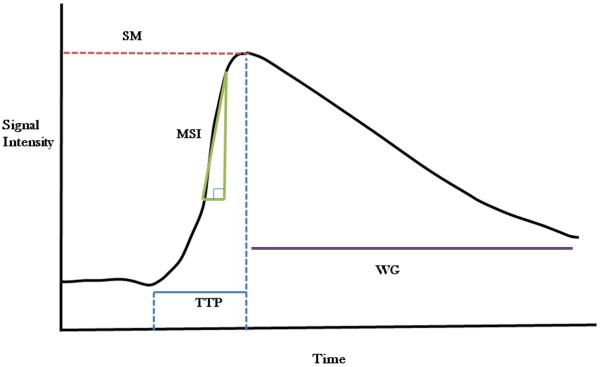
Qualitative parameters derived from Signal Intensity vs. Time Curve; SM: Signal Maximum, MSI: Maximum Slope of Increase, TTP: Time to Peak, WG: Washout Gradient.
The terms semi-quantitative and quantitative can be misleading, in that they can be measured objectively and reproducibly.33 The biological relevance of many commonly used semi-quantitative parameters remains to be determined, which limits the interpretation of their absolute values or relative variations in terms of the underlying physiology. One of the most frequently used semi-quantitative parameters is the iAUGC which is defined as a measure of the amount of contrast agent delivered to and retained by a tumor in a given time period. Simulations of DCE-MRI data have been performed to investigate the relationship between iAUGC and quantitative parameters.33 Although iAUGC cannot be used as a surrogate measure of specific quantitative parameters, iAUGC is considered to be a mixed parameter of both Ktrans and ve.33 Additionally, a modified iAUC (miAUC) approach has been proposed to analyze DCE-MRI data qualitatively with an improved correlation to quantitative methods. The miAUC approach retains advantages associated with non-model based methods (robust to noise and model fit failure, obviates need for an AIF) while providing better distinction of underlying physiologic parameters such as Ktrans and ve.32
The limitations of semi-quantitative methods include the fact that they may not reflect the changing contrast medium concentration in tissues accurately and do not directly inform on tissue physiology.26 These factors limit the usefulness of semi-quantitative parameters and make between-patient and between-system comparisons difficult.34 While these limitations need to be considered in the research and clinical setting, the use of semi-quantitative analysis may be the most appropriate approach to utilizing the DCE-MRI technique for a given case population and a particular purpose.
Clinical Use (Human)
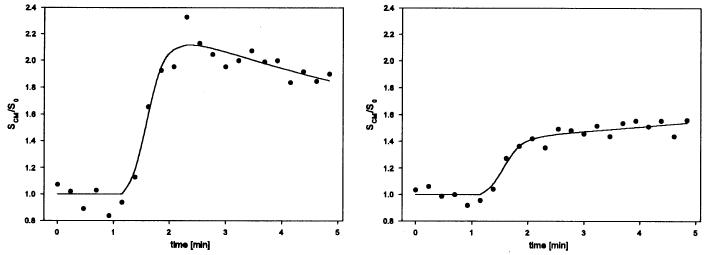
Information derived from DCE-MRI studies can be used to differentiate malignant tumors from benign ones. In people, this application of DCE-MRI is most intense in the diagnosis of breast and prostate cancer where malignant lesions generally have rapid and high amplitude contrast medium wash-in followed by a relatively rapid wash-out, whereas benign lesions are characterized by contrast medium wash-in followed by persistent enhancement, due to a lower degree of angiogenesis (Figure. 6) 25, 35, 36. The sensitivity of DCE-MRI for detection of malignant breast lesions based on enhancement kinetics alone is high, approaching 100% but specificity varies making false positives a problem37. This application of DCE-MRI is not likely to be embraced in this early stage of functional imaging in veterinary medicine, and tumors are still confirmed to be malignant or benign by biopsy.
Figure 6.
Relative intensity–time curves from different tissues. Left: a voxel with meningioma tissue. The shape of the curve is typical of a tumor with strong and fast signal enhancement and moderate wash-out phase. Right: a voxel of ocular muscle. The curve shows low contrast medium accumulation and no wash-out phase. With permission from Neff T, et al. Phys Med Biol 50 (2005) 4209-4223.
More commonly in people, and most likely to be the direction of the early use of DCE-MRI in veterinary medicine, is the use of DCE-MRI for prediction of treatment outcome. Predicting outcome, as already discussed, would be valuable in developing the most appropriate, individualized treatment plan for a patient. At present, there are no noninvasive markers that can reliably predict outcome in cancer therapy.38 Fortunately, DCE-MRI parameters are affected by successful treatments where killing of tumor cells causes vascular shutdown due to loss of proangiogenic cytokine support that results in apoptosis of proliferating endothelial cells.27 In general, a successful treatment should result in a decrease in the rate and perhaps extent of enhancement34. Changes in perfusion parameters can then be linked to outcome. For example, with many types of cancer, particularly cervical cancer, the efficacy of radiation and chemotherapy generally cannot be assessed reliably until months after completion of therapy. However, physiologic changes occur in tumors long before changes in size are observed.25 DCE-MRI can provide early evidence of a positive treatment effect by demonstrating changes in enhancement curves (slower initial enhancement, decreased amplitude, slower wash-out).25 Further, more permeable tissues may be better oxygenated and therefore initially more radiosensitive.25
As examples, DCE-MRI parameters were quantified in 62 women with cervical carcinoma prior to treatment with radiation and chemotherapy and then 2 to 2.5 weeks after initiation of treatment. DCE-MRI data were compared to typical clinical prognostic factors. MRI parameters reflecting heterogeneous tumor perfusion and subtle tumor volume change early during treatment were independent and better predictors of tumor recurrence and death than clinical prognostic factors. The combination of clinical prognostic factors and MRI parameters improved early prediction of treatment even further39. Also, semi-quantitative DCE-MRI parameters were quantified in 49 women with breast cancer prior to mastectomy. The DCE-MRI parameters were compared, along with conventional clinical parameters, to the presence of recurrence or metastasis, disease free survival and overall survival. In the end, the semi-quantitative DCE-MRI parameters contributed the greatest prediction of both disease-free and overall survival40. These data provide support for continued investigation of DCE-MRI as a method to characterize tumor response to therapy and this principle represents an exciting application of DCE-MRI in veterinary medicine.
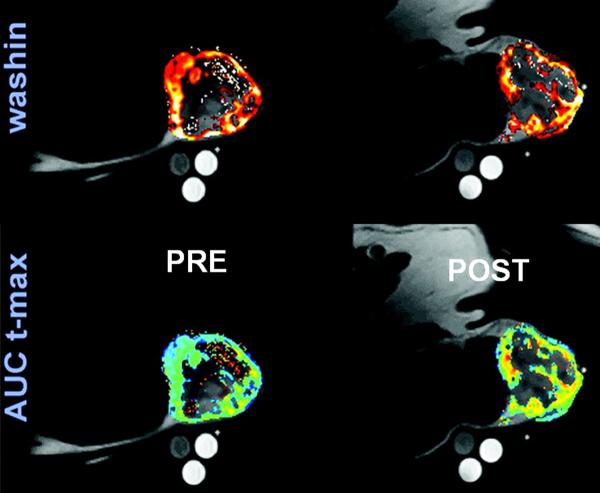
DCE-MRI is also being considered as an aid to radiation therapy planning. Target volume localization for radiotherapy planning is typically based on morphologic information acquired from CT or MR images. Identification of the gross tumor volume (GTV) is a key component leading to identification of the volume of tissue ultimately subjected to the prescribed dose of radiation. Definition of the GTV with CT or MRI is often inadequate due to the complexity and ambiguity of only morphologic features.41 It is often difficult to distinguish between tumor tissue and necrosis, and impossible based on morphology to distinguish between mitotically active tumor areas from less active areas.41 DCE-MRI could be of value in radiation planning with regard to improvement of target volume localization by detection of unexpected tumor extension or presence of occult locoregional metastases in lymph nodes.42 Functional imaging techniques, including DCE-MRI, can supply information about tumor physiology in regard to microcirculation, oxygenation, and other biologic parameters, and this information can be integrated into radiotherapy treatment planning with the aim being radiation dose painting based on identification of regions likely to be more resistant, such as poorly perfused hypoxic regions 43. For radiation oncology, tumor oxygenation and perfusion are the most important parameters that might be considered as regions of interest when planning treatment. DCE-MRI is capable of providing voxel-based quantitative information on perfusion that could be incorporated into radiation planning (Figure. 7, Figure. 8) 44, 45
Figure 7.
Overlay of anatomic T1-weighted images with wash-in, and AUCt-max perfusion maps obtained from a canine patient with a hemangiopercytoma of the perineum using DCE-MRI. Images on the left are pre-treatment and on the right 24 hours after one radiation/hyperthermia treatment. Note the pre-treatment heterogeneity in tumor perfusion, which could be used as a basis of radiation dose painting when planning the treatment. Also note the increase in AUCt-max after 24-h post-hyperthermia. AUCt-max is the AUC of the dynamic signal enhancement between 0 and the time of maximal muscle enhancement. Modified from Viglianti BL, et al. Clin Cancer Res 2009; 15:4993-5001.
Figure 8.
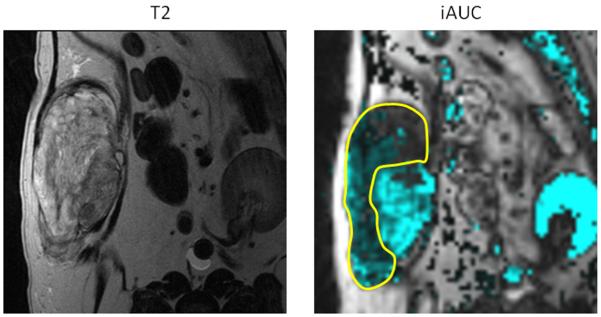
Canine soft tissue sarcoma. Pre-treatment quantification if iAUGC100. Outlined area represents the region with reduced perfusion and suspected hypoxic tissue. Radiation dose could be intensified to this area with the attempt to improve treatment outcome to suspected resistant tumor cell population.
Clinical Use (Canine)
There are only a few instances of DCE-MRI being used in veterinary medicine. Seven dogs with a brain tumor were subjected to DCE-MRI with the intent of characterizing perfusion parameters as a function of tumor type46. Although there were statistical differences between distributions of the enhancement pattern of each tumor, the number of dogs was too small to draw meaningful conclusions.
DCE-MRI was used in six dogs with a spontaneous head or neck tumor undergoing radiation therapy for the purpose of defining parameters that might be used for image-guided therapy 47. Astonishingly, DCE-MRI was performed prior to each of 18 radiation fractions in each dog. When analyzed based on relative signal intensity, there was considerable intra-tumor and inter-tumor variation 47. However, when a pharmacokinetic model was used rather than relative signal intensity, the pretreatment rate constant between the plasma and extracellular extravascular space and the change in the rate constant were related to tumor regression 48.
Thirty-seven dogs with a soft tissue sarcoma had DCE-MRI parameters quantified before and after a hyperthermia treatment of the primary tumor 49. Pre-therapy rate of contrast medium washout was predictive of improved overall and metastasis-free survival. After the first hyperthermia treatment, various parameters were also predictive of improved overall and metastasis-free survival. Also, a pre-therapy perfusion parameter was predictive of duration of local tumor control (Figure. 9). These data validate the use of DCE-MRI early in the course of therapy to identify patients likely to fail. These patients can be treated in other ways to generate new knowledge about alternate treatments and avoid failing conventional therapy.
Figure 9.
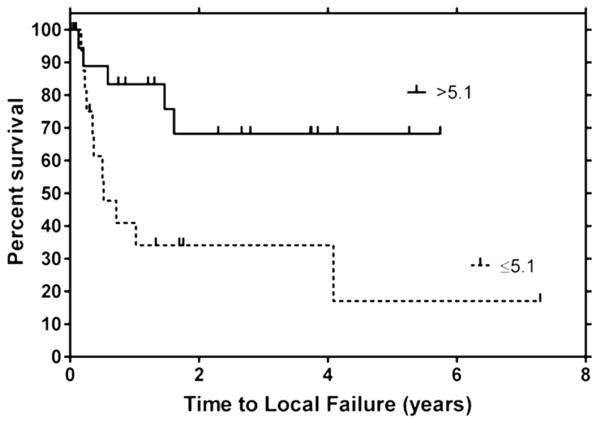
Kaplan-Meier plot depicting time to local failure for soft tissue sarcomas with AUCt-max values above and below their cut point values (cut point = interquartile range/2). Note the effect of perfusion on local control following treatment with radiation and hyperthermia. Poorly perfused tumors had a significantly shorter time to recurrence than well perfused tumors. Reprinted with permission from Viglianti BL, et al. Clin Cancer Res 2009; 15:4993-5001.
DCE-MRI has also been used to evaluate response to PEGylated tumor necrosis factor-α (PEG-TNF) 50. TNFα is a cytokine that has been used as a systemic anticancer therapy, and the PEGylated form has been developed to increase the circulating half-life, decrease immunogenicity, increase biological activity, and increase intratumor drug accumulation. Serial DCE-MRI data were used to monitor response in 7 dogs treated with PEG-TNF. Increases in tumor perfusion and/or vascular permeability paralleled an increase in tumor inflammation and necrosis. It was hypothesized that increased tumor-associated inflammation resulted in increased vascular permeability.
These limited data from spontaneous animal tumors support the application of DCE-MRI in veterinary medicine, as in humans, as a predictor or outcome and to monitor response.
Reproducibility
In most tumor DCE-MRI studies, tumor perfusion is assessed prior to treatment, providing data from only one pre-treatment time point. This would be adequate if inherent tumor perfusion was stable, however tumor perfusion is a dynamic process and it is uncertain whether one pre-treatment assessment is suitable as a baseline for subsequent comparisons. Even if baseline DCE-MRI parameters are not stable, characterizing the inherent variation will enable estimates of sample size or the magnitude of measured treatment-related differences to be formulated. Unfortunately, there are few data on inherent temporal variations in tumor perfusion. Two DCE-MRI studies were performed on 23 human patients (12 lung cancer, 11 liver cancer) 2-7 days apart without intervening treatment. Within patient coefficients of variation for liver were approximately 9% and for lung approximately 18%. Estimates of confidence that any observed change in a patient was due to therapy rather than inherent variation were approximately 71% - 87% if a 20% reduction in the perfusion parameter was observed 51.
In 22 human patients with hepatic metastasis from colorectal cancer, the effect of an antiangiogenic drug was assessed using DCE-MRI. Pre-treatment evaluation consisted of two DCE-MRI scans completed within 14 days of the start of antiangiogenic therapy. The intrapatient coefficient of variation for iAUGC60 and Ktrans were 11% and 24%, respectively37. This variation is similar to that observed in the lung and liver cancer study described above.
There are no data on reproducibility of DCE-MRI parameters in canine tumors. We evaluated DCE-MRI in four dogs with a soft tissue sarcoma for three consecutive days to compile information on the inherent variability of tumor perfusion parameters. Prior to contrast medium injection, 3D SPGR T1-weighted images of the tumor were acquired at various flip angles and used for quantification of per-voxel tumor T1 relaxation times in the central 6 slices. Then, contrast medium was injected rapidly by hand and the tumor imaged using the same sequence and a flip angle of 30°. Contrast medium was injected 1 minute into the dynamic series, which consisted of 80 acquisitions of approximately 8sec each. Perfusion parameters were quantified and extracted in the central 6 slices on each day using CADvue® software. Initially, an attempt was made to interpret the data by employing Tofts 2-compartment model to estimate the transfer constant Ktrans, ve - the extravascular extracellular volume fraction, and the rate constant kep. However, due to absence of a large artery in the field of view of each sarcoma, of which were mainly extremity tumors, we were not able to obtain AIF values that were adequate for use in the pharmacokinetic model. Also, there are no standard canine AIF values that could be used. Alternatively, we used the semi-quantitative initial area under the gadolinium time-concentration curve for the first 100 seconds (iAUGC100) serving as the determinant of tumor perfusion. We found that there were observable differences between the iAUGC100 values within tumors and between dogs (Figure. 10) leading us to conclude that a single DCE-MRI study might not be adequate due to daily perfusion variation. At this point the exact cause of this variation is unknown and we did not identify technical issues, such as differences in patient positioning that would account for this variation. Potential causes, in addition to actual inherent variation in perfusion, include differences in contrast medium injection technique or variations in anesthesia that may have affected blood pressure and flow. Further work on inherent variation in canine tumor perfusion is needed before DCE-MRI studies are used as a predictive endpoint in canine tumors. This would include more robust estimation of the AIF so that pharmacokinetic models could be used.
Figure 10.
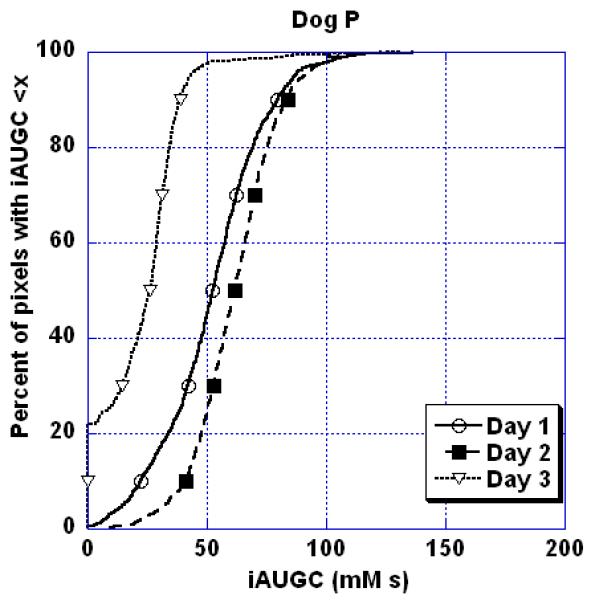
Percent of pixels with iAUGC<x as a function of x for a soft tissue sarcoma in a dog where DCE-MRI was repeated on three consecutive days without any treatment being administered to the tumor. Note the inherent variation in this semi-quantitative perfusion parameter over 3 days.
Summary
In summary, functional tumor imaging is a powerful tool to assess the physiology of the tumor that can be used predicatively and also to guide therapy. As the techniques of functional tumor imaging become more available, they will be applied more frequently in the study of canine cancer. Given the importance of tumor perfusion with respect to tumor oxygenation and drug delivery, the determination of perfusion parameters and the use of DCE-MRI is a convenient and powerful way to gain basic information about a tumor. Fortunately, the technical requirements for quantitative DCE-MRI are such that it can be performed successfully on most 1.5T magnets in clinical use.
Acknowledgments
Supported in part by Grant P01 CA42745 from the Department of Health and Human Services, National Institutes of Health
Footnotes
http://en.wikipedia.org/wiki/Spin-lattice_relaxation_time. Last accessed February 16, 2011.
References
- 1.Kiupel M, Webster JD, Miller RA, Kaneene JB. Impact of tumour depth, tumour location and multiple synchronous masses on the prognosis of canine cutaneous mast cell tumours. J Vet Med A Physiol Pathol Clin Med. 2005;52(6):280–6. doi: 10.1111/j.1439-0442.2005.00726.x. [DOI] [PubMed] [Google Scholar]
- 2.Proulx DR, Ruslander DM, Dodge RK, Hauck ML, Williams LE, Horn B, et al. A retrospective analysis of 140 dogs with oral melanoma treated with external beam radiation. Vet Radiol Ultrasound. 2003;44(3):352–9. doi: 10.1111/j.1740-8261.2003.tb00468.x. [DOI] [PubMed] [Google Scholar]
- 3.Thrall DE, LaRue SM, Yu D, Samulski T, Sanders L, Case B, et al. Thermal dose is related to duration of local control in canine sarcomas treated with thermoradiotherapy. Clin Cancer Res. 2005;11(14):5206–14. doi: 10.1158/1078-0432.CCR-05-0091. [DOI] [PMC free article] [PubMed] [Google Scholar]
- 4.Queiroga FL, Alves A, Pires I, Lopes C. Expression of Cox-1 and Cox-2 in canine mammary tumours. J Comp Pathol. 2007;136(2-3):177–85. doi: 10.1016/j.jcpa.2007.01.010. [DOI] [PubMed] [Google Scholar]
- 5.Spugnini EP, Porrello A, Citro G, Baldi A. COX-2 overexpression in canine tumors: potential therapeutic targets in oncology. Histol Histopathol. 2005;20(4):1309–12. doi: 10.14670/HH-20.1309. [DOI] [PubMed] [Google Scholar]
- 6.Qiu CW, Lin DG, Wang JQ, Li CY, Deng GZ. Expression and significance of PTEN and VEGF in canine mammary gland tumours. Vet Res Commun. 2008;32(6):463–72. doi: 10.1007/s11259-008-9049-7. [DOI] [PubMed] [Google Scholar]
- 7.Zizzo N, Patruno R, Zito FA, Di Summa A, Tinelli A, Troilo S, et al. Vascular endothelial growth factor concentrations from platelets correlate with tumor angiogenesis and grading in a spontaneous canine non-Hodgkin lymphoma model. Leuk Lymphoma. 2010;51(2):291–6. doi: 10.3109/10428190903452818. [DOI] [PubMed] [Google Scholar]
- 8.Ettinger SN, Scase TJ, Oberthaler KT, Craft DM, McKnight JA, Leibman NF, et al. Association of argyrophilic nucleolar organizing regions, Ki-67, and proliferating cell nuclear antigen scores with histologic grade and survival in dogs with soft tissue sarcomas: 60 cases (1996-2002) J Am Vet Med Assoc. 2006;228(7):1053–62. doi: 10.2460/javma.228.7.1053. [DOI] [PubMed] [Google Scholar]
- 9.Scase TJ, Edwards D, Miller J, Henley W, Smith K, Blunden A, et al. Canine mast cell tumors: correlation of apoptosis and proliferation markers with prognosis. J Vet Intern Med. 2006;20(1):151–8. doi: 10.1892/0891-6640(2006)20[151:cmctco]2.0.co;2. [DOI] [PubMed] [Google Scholar]
- 10.Lindblad-Toh K, Wade CM, Mikkelsen TS, Karlsson EK, Jaffe DB, Kamal M, et al. Genome sequence, comparative analysis and haplotype structure of the domestic dog. Nature. 2005;438(7069):803–19. doi: 10.1038/nature04338. [DOI] [PubMed] [Google Scholar]
- 11.Chi JT, Thrall D, Jiang C, Snyder S, Fels DR, Landon C, et al. Comparison of genomics and functional imaging from canine sarcomas treated with thermoradiotherapy predicts therapeutic response and identifies combination therapeutics. Clin Cancer Res. 2011 doi: 10.1158/1078-0432.CCR-10-2583. [DOI] [PMC free article] [PubMed] [Google Scholar]
- 12.Joetzke AE, Sterenczak KA, Eberle N, Wagner S, Soller JT, Nolte I, et al. Expression of the high mobility group A1 (HMGA1) and A2 (HMGA2) genes in canine lymphoma: analysis of 23 cases and comparison to control cases. Vet Comp Oncol. 2010;8(2):87–95. doi: 10.1111/j.1476-5829.2010.00207.x. [DOI] [PubMed] [Google Scholar]
- 13.Mahoney JA, Fisher JC, Snyder SA, Hauck ML. Feasibility of using gene expression analysis to study canine soft tissue sarcomas. Mamm Genome. 2010;21(11-12):577–82. doi: 10.1007/s00335-010-9298-y. [DOI] [PMC free article] [PubMed] [Google Scholar]
- 14.Cline JM, Rosner GL, Raleigh JA, Thrall DE. Quantification of CCI-103F labeling heterogeneity in canine solid tumors. Int J Radiat Oncol Biol Phys. 1997;37(3):655–62. doi: 10.1016/s0360-3016(96)00559-7. [DOI] [PubMed] [Google Scholar]
- 15.Thrall DE, Rosner GL, Azuma C, McEntee MC, Raleigh JA. Hypoxia marker labeling in tumor biopsies: quantification of labeling variation and criteria for biopsy sectioning. Radiother Oncol. 1997;44(2):171–6. doi: 10.1016/s0167-8140(97)01931-2. [DOI] [PubMed] [Google Scholar]
- 16.Aberle DR, Chiles C, Gatsonis C, Hillman BJ, Johnson CD, McClennan BL, et al. Imaging and cancer: research strategy of the American College of Radiology Imaging Network. Radiology. 2005;235(3):741–51. doi: 10.1148/radiol.2353041760. [DOI] [PubMed] [Google Scholar]
- 17.Blodgett T. Best practices: consensus on performing positron emission tomography-computed tomography for radiation therapy planning and for therapy response assessment. Semin Ultrasound CT MR. 2010;31(6):506–15. doi: 10.1053/j.sult.2010.10.006. [DOI] [PubMed] [Google Scholar]
- 18.Lawrence J, Rohren E, Provenzale J. PET/CT today and tomorrow in veterinary cancer diagnosis and monitoring: fundamentals, early results and future perspectives. Vet Comp Oncol. 2010;8(3):163–87. doi: 10.1111/j.1476-5829.2010.00218.x. [DOI] [PubMed] [Google Scholar]
- 19.Ruan K, Song G, Ouyang G. Role of hypoxia in the hallmarks of human cancer. J Cell Biochem. 2009;107(6):1053–62. doi: 10.1002/jcb.22214. [DOI] [PubMed] [Google Scholar]
- 20.Overgaard J. Hypoxic radiosensitization: adored and ignored. J Clin Oncol. 2007;25(26):4066–74. doi: 10.1200/JCO.2007.12.7878. [DOI] [PubMed] [Google Scholar]
- 21.Rockwell S, Dobrucki IT, Kim EY, Marrison ST, Vu VT. Hypoxia and radiation therapy: past history, ongoing research, and future promise. Curr Mol Med. 2009;9(4):442–58. doi: 10.2174/156652409788167087. [DOI] [PMC free article] [PubMed] [Google Scholar]
- 22.Newbold K, Castellano I, Charles-Edwards E, Mears D, Sohaib A, Leach M, et al. An exploratory study into the role of dynamic contrast-enhanced magnetic resonance imaging or perfusion computed tomography for detection of intratumoral hypoxia in head-and-neck cancer. Int J Radiat Oncol Biol Phys. 2009;74(1):29–37. doi: 10.1016/j.ijrobp.2008.07.039. [DOI] [PubMed] [Google Scholar]
- 23.Furuya M, Nishiyama M, Kasuya Y, Kimura S, Ishikura H. Pathophysiology of tumor neovascularization. Vasc Health Risk Manag. 2005;1(4):277–90. doi: 10.2147/vhrm.2005.1.4.277. [DOI] [PMC free article] [PubMed] [Google Scholar]
- 24.Turkbey B, Thomasson D, Pang Y, Bernardo M, Choyke PL. The role of dynamic contrast-enhanced MRI in cancer diagnosis and treatment. Diagn Interv Radiol. 2010;16(3):186–92. doi: 10.4261/1305-3825.DIR.2537-08.1. [DOI] [PMC free article] [PubMed] [Google Scholar]
- 25.Choyke PL, Dwyer AJ, Knopp MV. Functional tumor imaging with dynamic contrast-enhanced magnetic resonance imaging. J Magn Reson Imaging. 2003;17(5):509–20. doi: 10.1002/jmri.10304. [DOI] [PubMed] [Google Scholar]
- 26.Alonzi R, Padhani AR, Allen C. Dynamic contrast enhanced MRI in prostate cancer. Eur J Radiol. 2007;63(3):335–50. doi: 10.1016/j.ejrad.2007.06.028. [DOI] [PubMed] [Google Scholar]
- 27.Padhani AR, Khan AA. Diffusion-weighted (DW) and dynamic contrast-enhanced (DCE) magnetic resonance imaging (MRI) for monitoring anticancer therapy. Target Oncol. 2010;5(1):39–52. doi: 10.1007/s11523-010-0135-8. [DOI] [PubMed] [Google Scholar]
- 28.Kingsley P. Methods of measuring spin-lattice (T1) relaxation times: an annotated bibliography. Concepts Magn Reson. 1999;11:243–76. [Google Scholar]
- 29.Tofts PS, Brix G, Buckley DL, Evelhoch JL, Henderson E, Knopp MV, et al. Estimating kinetic parameters from dynamic contrast-enhanced T(1)-weighted MRI of a diffusable tracer: standardized quantities and symbols. J Magn Reson Imaging. 1999;10(3):223–32. doi: 10.1002/(sici)1522-2586(199909)10:3<223::aid-jmri2>3.0.co;2-s. [DOI] [PubMed] [Google Scholar]
- 30.Pabst T, Kenn W, Kaiser WA, Hahn D. Understanding why contrast enhancement in dynamic MRI is not reproducible: illustration with a simple phantom. Breast J. 2001;7(3):166–70. doi: 10.1046/j.1524-4741.2001.007003166.x. [DOI] [PubMed] [Google Scholar]
- 31.Yang X, Liang J, Heverhagen JT, Jia G, Schmalbrock P, Sammet S, et al. Improving the pharmacokinetic parameter measurement in dynamic contrast-enhanced MRI by use of the arterial input function: theory and clinical application. Magn Reson Med. 2008;59(6):1448–56. doi: 10.1002/mrm.21608. [DOI] [PubMed] [Google Scholar]
- 32.Cheng HL. Improved correlation to quantitative DCE-MRI pharmacokinetic parameters using a modified initial area under the uptake curve (mIAUC) approach. J Magn Reson Imaging. 2009;30(4):864–72. doi: 10.1002/jmri.21916. [DOI] [PubMed] [Google Scholar]
- 33.Walker-Samuel S, Leach MO, Collins DJ. Evaluation of response to treatment using DCE-MRI: the relationship between initial area under the gadolinium curve (IAUGC) and quantitative pharmacokinetic analysis. Phys Med Biol. 2006;51(14):3593–602. doi: 10.1088/0031-9155/51/14/021. [DOI] [PubMed] [Google Scholar]
- 34.Padhani AR, Hayes C, Landau S, Leach MO. Reproducibility of quantitative dynamic MRI of normal human tissues. NMR Biomed. 2002;15(2):143–53. doi: 10.1002/nbm.732. [DOI] [PubMed] [Google Scholar]
- 35.Lipnick S, Liu X, Sayre J, Bassett LW, Debruhl N, Thomas MA. Combined DCE-MRI and single-voxel 2D MRS for differentiation between benign and malignant breast lesions. NMR Biomed. 2010;23(8):922–30. doi: 10.1002/nbm.1511. [DOI] [PubMed] [Google Scholar]
- 36.Kuhl CK. Why do purely intraductal cancers enhance on breast MR images? Radiology. 2009;253(2):281–3. doi: 10.1148/radiol.2532091401. [DOI] [PubMed] [Google Scholar]
- 37.Morris E. Diagnostic breast MR imaging: current status and future directions. Radiol Clin N Am. 2007;45:863–80. doi: 10.1016/j.rcl.2007.07.002. [DOI] [PubMed] [Google Scholar]
- 38.Kim S, Loevner LA, Quon H, Kilger A, Sherman E, Weinstein G, et al. Prediction of response to chemoradiation therapy in squamous cell carcinomas of the head and neck using dynamic contrast-enhanced MR imaging. AJNR Am J Neuroradiol. 2010;31(2):262–8. doi: 10.3174/ajnr.A1817. [DOI] [PMC free article] [PubMed] [Google Scholar]
- 39.Mayr NA, Yuh WT, Jajoura D, Wang JZ, Lo SS, Montebello JF, et al. Ultra-early predictive assay for treatment failure using functional magnetic resonance imaging and clinical prognostic parameters in cervical cancer. Cancer. 2010;116(4):903–12. doi: 10.1002/cncr.24822. [DOI] [PMC free article] [PubMed] [Google Scholar]
- 40.Tuncbilek N, Tokatli F, Altaner S, Sezer A, Ture M, Omurlu IK, et al. Prognostic value DCE-MRI parameters in predicting factor disease free survival and overall survival for breast cancer patients. Eur J Radiol. 2011 doi: 10.1016/j.ejrad.2011.02.021. [DOI] [PubMed] [Google Scholar]
- 41.Neff T, Kiessling F, Brix G, Baudendistel K, Zechmann C, Giesel FL, et al. An optimized workflow for the integration of biological information into radiotherapy planning: experiences with T1w DCE-MRI. Phys Med Biol. 2005;50(17):4209–23. doi: 10.1088/0031-9155/50/17/020. [DOI] [PubMed] [Google Scholar]
- 42.Newbold K, Partridge M, Cook G, Sohaib SA, Charles-Edwards E, Rhys-Evans P, et al. Advanced imaging applied to radiotherapy planning in head and neck cancer: a clinical review. Br J Radiol. 2006;79(943):554–61. doi: 10.1259/bjr/48822193. [DOI] [PubMed] [Google Scholar]
- 43.Bentzen SM, Gregoire V. Molecular imaging-based dose painting: a novel paradigm for radiation therapy prescription. Semin Radiat Oncol. 2011;21(2):101–10. doi: 10.1016/j.semradonc.2010.10.001. [DOI] [PMC free article] [PubMed] [Google Scholar]
- 44.Astner ST, Shi K, Vaupel P, Molls M. Imaging of tumor physiology: impacts on clinical radiation oncology. Exp Oncol. 2010;32(3):149–52. [PubMed] [Google Scholar]
- 45.Cao Y. The promise of dynamic contrast enhanced imaging in radiation therapy. Semin Radiat Oncol. 2011;21(2):147–56. doi: 10.1016/j.semradonc.2010.11.001. [DOI] [PMC free article] [PubMed] [Google Scholar]
- 46.Zhao Q, Lee S, Kent M, Schatzberg S, Platt S. Dynamic contrast-enhanced magnetic resonance imaging of canine brain tumors. Vet Radiol Ultrasound. 2010;51(2):122–9. doi: 10.1111/j.1740-8261.2009.01635.x. [DOI] [PubMed] [Google Scholar]
- 47.Sovik A, Skogmo H Kippenes, Bruland OS, Olsen D Rune, Malinen E. DCEMRI monitoring of canine tumors during fractionated radiotherapy. Acta Oncol. 2008;47(7):1249–56. doi: 10.1080/02841860802244166. [DOI] [PubMed] [Google Scholar]
- 48.Sovik S, Skogmo HK, Andersen EK, Bruland OS, Olsen DR, Malinen E. DCEMRI of spontaneous canine tumors during fractionated radiotherapy: a pharmacokinetic analysis. Radiother Oncol. 2009;93(3):618–24. doi: 10.1016/j.radonc.2009.08.012. [DOI] [PubMed] [Google Scholar]
- 49.Viglianti BL, Lora-Michiels M, Poulson JM, Lan L, Yu D, Sanders L, et al. Dynamic contrast-enhanced magnetic resonance imaging as a predictor of clinical outcome in canine spontaneous soft tissue sarcomas treated with thermoradiotherapy. Clin Cancer Res. 2009;15(15):4993–5001. doi: 10.1158/1078-0432.CCR-08-2222. [DOI] [PMC free article] [PubMed] [Google Scholar]
- 50.Thamm DH, Kurzman ID, Clark MA, Ehrhart EJ, 3rd, Kraft SL, Gustafson DL, et al. Preclinical investigation of PEGylated tumor necrosis factor alpha in dogs with spontaneous tumors: phase I evaluation. Clin Cancer Res. 2010;16(5):1498–508. doi: 10.1158/1078-0432.CCR-09-2804. [DOI] [PubMed] [Google Scholar]
- 51.Ng CS, Raunig DL, Jackson EF, Ashton EA, Kelcz F, Kim KB, et al. Reproducibility of perfusion parameters in dynamic contrast-enhanced MRI of lung and liver tumors: effect on estimates of patient sample size in clinical trials and on individual patient responses. AJR Am J Roentgenol. 2010;194(2):W134–40. doi: 10.2214/AJR.09.3116. [DOI] [PubMed] [Google Scholar]


