

Abstract
Circadian rhythms are oscillations in biological processes that function as a key adaptation to the daily rhythms of most environments. In the model cyanobacterial circadian clock system, the core oscillator proteins are encoded by the gene cluster kaiABC1. Genes with high expression and functional importance like the kai genes are usually encoded by optimal codons, yet the codon usage bias of the kaiBC genes is not optimized for translational efficiency. We discovered a relationship between codon usage and a general property of circadian rhythms called conditionality; namely, that endogenous rhythmicity is robustly expressed under some environmental conditions but not under others2. Despite the generality of circadian conditionality, however, its molecular basis is unknown for any system. Here we show that non-optimal codon usage was selected as a post-transcriptional mechanism to switch between circadian and non-circadian regulation of gene expression as an adaptive response to environmental conditions. When the kaiBC sequence was experimentally optimized to enhance expression of the KaiB and KaiC proteins, intrinsic rhythmicity was enhanced at cool temperatures that are experienced by this organism in its natural habitat. However, fitness at those temperatures was highest in cells whose endogenous rhythms were suppressed at cool temperatures as compared with cells exhibiting high-amplitude rhythmicity. These results indicate natural selection against circadian systems in cyanobacteria that are intrinsically robust at cool temperatures. Modulation of circadian amplitude is therefore critical to its adaptive significance3. Moreover, these results show the direct effects of codon usage on a complex phenotype and organismal fitness. Our work also challenges the long-standing view of directional selection towards optimal codons4–7, and provides a key example of natural selection against optimal codon to achieve adaptive responses to environmental changes.
Most amino acids are encoded by multiple codons, and species vary in their preferences for specific codons for the same amino acid. This preference, or codon usage bias, is thought to reflect a balance between mutational biases and selection for translational efficiency and accuracy4,6–9. Although the relative importance of various factors affecting codon usage is debated10,11, the degree of codon usage bias is known to increase with higher gene expression12. In particular, genes under stronger selection for translational efficiency and/or accuracy show greater preference for using codons whose complementary tRNAs have higher abundances. Despite the fact that codon usage bias is a strong indicator of selection on genes13 and that the specific nature of codon bias can be changed by environmental factors such as temperature and hyper-salinity14,15, its direct effect on a complex phenotype and organismal fitness remains largely unknown.
In the cyanobacterium Synechococcus elongatus PCC7942, circadian rhythms confer a strong selective advantage in rhythmic environments3,16. In S. elongatus, expression of the entire genome is controlled by the circadian pacemaker, as shown by rhythms of promoter activity17, mRNA abundance18–20, and the topology of the entire chromosome19,21. The core circadian clock is composed of three components, KaiA, KaiB, and KaiC, that are expressed as monocistronic kaiA and dicistronic kaiBC transcripts1. Both transcripts are expressed at very high levels, falling within the top 5% of mRNA abundances in S. elongatus18,19. Whereas initial examination of codon usage in kaiBC suggested an unusual codon bias (Table S1, Fig. 1a), further analyses indicated that amino acid specific codon usage in kaiB and kaiC is not significantly different from that of the average codon usage in the rest of the genome (Fig. 1b). In order to quantify the degree of selection on the kai gene cluster, we focused upon its codon adaptation index (CAI)13 and the 5′ mRNA folding energies of its transcripts. Given that kaiBC transcripts are very highly abundant, it was surprising that the CAI for kaiB and kaiC is less than the average CAI value of all S. elongatus genes (Fig. 1b). Moreover, even though the folding energy of the kaiB transcript is less negative than that for most transcripts (Fig. 1c)–indicating that it has a relatively weaker secondary structure than most mRNAs in this organism and is therefore likely to initiate translation efficiently–the weak secondary structure of the kaiB transcript is insufficient to account for its high mRNA abundance given that the CAI is considerably below average. The kaiC portion of the kaiBC transcript has similar CAI (Fig. 1b) and folding energy (Fig. 1c) values as those of the kaiB portion.
Figure 1. Non-optimal codon usage of cyanobacterial clock genes.

a, Codon adaptation index (CAI) values along the entire length of different genes at a sliding window of 20 codons. Left panel: kaiBWT vs. kaiBopt; Middle panel: kaiCI domain of kaiCWT vs. kaiCopt; Right panel: average of all ribosomal protein genes. b, Comparison of CAI values of the kaiBWT, kaiBopt, kaiCWT, kaiCopt, and ribosomal genes in the CAI histogram distribution of the genome. c, Calculated 5′ folding energy of the mRNA for all genes in the S. elongatus genome. d, Comparison of calculated minimum free energy of folding (ΔG) over a range of temperatures between kaiBWT and kaiBopt.
To test whether the lower CAI of kaiBC might be adaptive in the core clock mechanism and/or in the output pathways controlled by the pacemaker in cyanobacteria, we generated two strains whose endogenous kaiBC gene was replaced with modified versions of kaiBC in which codon usage was “optimized” to be similar to that of highly expressed genes18,19, thereby increasing their CAI values from 0.60 to 0.95 for kaiB and 0.61 to 0.82 for kaiC (Fig. 1a; Tables S2 and S3). Changing the codon usage of a gene in its 5′ region affects its folding energy and hence its rate of translation initiation8,22–24. Indeed, the optimized versions of kaiB and kaiBC also had significantly lower 5′ folding energy of the kaiBC transcript (Figs. 1c & 1d). Because the kaiBC gene is transcribed as a single discistronic mRNA with kaiB at its 5′ end1, one optimized strain (“optKaiB”) replaced the entire kaiBWT gene with an optimized kaiBopt, whereas the other optimized strain (“optKaiBC”) replaced both the kaiBWT gene and the 5′ half of the kaiCWT gene with optimized versions (kaiBopt and kaiCopt, Fig. 2a). Our initial hypothesis was that the “non-optimal” codon bias of the endogenous kaiBC is essential for the expression of circadian rhythmicity, which would predict that the intrinsic rhythmicity of optKaiB and optKaiBC strains would be poorer than that of wild-type (as is true for the studies of Neurospora FRQ, accompanying manuscript by Zhou et al.). Unexpectedly, the observed circadian rhythms of gene expression in the optKaiB and optKaiBC strains were as robust as those of the wild-type S. elongatus at the optimal growth temperature of 30°C (Fig. 2b). However, to be adaptive, circadian clocks must be able to keep time accurately over the range of physiological temperatures for a given organism25, so we tested real-time gene expression profiles of the optimized strains relative to WT at temperatures from 18°C to 38°C. Again, to our surprise the optKaiB and optKaiBC strains exhibited robustly rhythmic gene expression over a broad range of temperatures (Fig. 2b, Table S4). In contrast, the rhythm of WT damps within a few cycles at cool temperatures (18–23°C, Fig. 2b, Table S4). There are no significant differences in the free-running period of the circadian rhythms between WT and optKaiB/optKaiBC at 18–20°C and 26–32°C, and only small differences at other temperatures within the 18–38°C range (Fig. 2c). Overall, the temperature compensation of the optimized strains was slightly poorer (Q10 ~1.13) over the range of 23–36°C than that for WT (Q10 ~1.10 from ref. 26, and Q10 ~1.04 from Fig. 2c and Table S6), which might relate to the difference in mRNA folding energies (Fig. 1d).
Figure 2. Conditional circadian phenotypes of the kai-optimized strains.

a, Diagrams of genes in the wild-type kaiABC (WT), kaiB-optimized (optKaiB), and kaiBC-optimized (optKaiBC) strains (see Methods for a detailed description). b, Luminescence rhythms of wild-type and kai-optimized strains in constant light at the indicated temperatures. In vivo luminescence rhythms were monitored from a group of12 colonies for each strain, and a representative example is shown for each group. c, Free-running periods of luminescence rhythms in LL from different strains over a temperature range of 18°C to 38°C (Periods are plotted as mean ± SEM).
We further confirmed that improved rhythmicity at lower temperatures of the optKaiB and optKaiBC strains (Fig. 2b) was due to higher protein production levels of KaiB and KaiC. First, Figs. 3a and Supplementary Fig. S1 confirm that KaiC levels are considerably higher in the optKaiBC strain as compared with WT, and Figs. 3b and Supplementary Fig. S2 show that KaiB levels are similarly elevated in both the optKaiB and optKaiBC strains. Interestingly, the amplitude of the KaiC phosphorylation rhythm is comparable between WT and optKaiBC at 20°C (Fig. 3a). Second, to validate that the augmented KaiB and/or KaiC levels were responsible for the improved rhythmicity at cool temperatures, we co-expressed the native (non-optimized) sequences of kaiB (strain KaiBWT/OX) or kaiBC (strain KaiBCWT/OX) from an IPTG-inducible trc promoter to enhance endogenous production of KaiB and KaiC (Fig. 3c). Fig. 3d shows that KaiB is overexpressed in the KaiBWT/OX and the KaiBCWT/OX strains even in the absence of the IPTG inducer (due to the trc promoter being slightly leaky27), while KaiC levels are not altered. In the presence of a very low concentration of the inducer (5 μM IPTG), KaiB levels are enhanced in KaiBWT/OX and both KaiB and KaiC levels are increased in KaiBCWT/OX (Fig. 3d). KaiA levels are not substantially affected under any of these conditions. In rhythm assays at 18°C, optKaiB and optKaiBC exhibit improved rhythmicity as compared with WT as noted above, but so does the KaiBCWT/OX strain in the absence and presence of the inducer IPTG (Fig. 3e, Table S5). (Much higher concentrations of IPTG lead to arhythmicity as noted before1,27; see Supplemental Figure S3.) Moreover, while the data depicted in Figure 3e are normalized luminescence data, un-normalized data for an equivalent experiment at 20°C are shown in Supplemental Figure S4. On the other hand, the rhythm of the KaiBWT/OX strain damps rapidly. There is a clear correlation between the strains that exhibit sustained rhythmicity in constant conditions (an indicator of the endogenous circadian system) and a favorable KaiB abundance relative to KaiC abundance (optKaiB, optKaiBC, KaiBCWT/OX) versus the strains whose rhythmicity damps rapidly and express either a low KaiB level (WT) or a high KaiB level (KaiBWT/OX) relative to KaiC level (Fig. 3d,e). These experimental manipulations of KaiB and KaiC levels using non-optimized sequences strongly suggest that codon optimization of kaiB and kaiC affects the robustness of rhythmicity at cool temperatures primarily by affecting KaiB and KaiC expression, thereby altering the relative levels of KaiB, KaiC, and KaiA protein abundances in the cells. The stoichiometry among the Kai proteins is known to be critical for expression of the cyanobacterial in vitro oscillator28, and it is therefore likely to be a key determining factor in the expression of rhythmicity in vivo that we report here.
Figure 3. Kai protein expression and circadian regulation of cells expressing wild-type versus optimized versions of kaiBC.

a, KaiC immunoblots in WT and optKaiBC strains in LL at 20°C. Densitometry of the time course blots reveal the KaiC phosphorylation profiles (right panel), KaiC abundance patterns (lower left panel, relative to the maximum density band = optKaiBC at LL42), and total KaiC abundance at three temperatures (20°C, 25°C, and 30°C; lower right panel & Supplementary Fig. S1) in the optKaiBC strain from LL24 to LL54 h relative to that of WT. b, KaiB immunoblots in WT, optKaiB, and optKaiBC strains in LL at 20°C. A nonspecific band (nb) was used as an internal reference for KaiB density. Densitometry of the time course blots revealed relative KaiB abundance (as the ratio of KaiB density to that of the nonspecific band, lower left panel) and total KaiB abundance at three temperatures (20°C, 25°C, and 30°C; lower right panel & Supplementary Fig. S2) in the optKaiB and optKaiBC strains from LL24 to LL54 h relative to that of WT. c, Diagrams of the kaiBWT- or kaiBCWT-coexpressing strains. d, Elevation of KaiB and/or KaiC levels in kaiBWT- or kaiBCWT-coexpressing strains (KaiBWT/OX and KaiBCWT/OX) at LL12 with or without a low concentration (5 μM) of IPTG. The left panel shows immunoblot assays for KaiB, KaiC, and KaiA, and equal loading was confirmed by the density of the nonspecific band (nb). The right panel depicts the densitometry of the relative KaiA, KaiB, and KaiC protein abundances. e, Phenocopying of the cool-temperature rhythmicity of the kaiB- or kaiBC-optimized strains in the wild-type strain by increased expression of kaiBWT and kaiCWT genes. Luminescence was recorded in LL at 18°C from cultures of wild-type (WT), codon-optimized (optKaiB and optKaiBC), and kai-coexpressing (KaiBWT/OX and KaiBCWT/OX) strains in the presence or absence of IPTG (5 μM). Representative traces are shown for each case.
If alternative (i.e., “optimal”) kaiBC sequences promote rhythmicity at cooler temperatures, why have they not been naturally selected? While 30°C is the optimal growth temperature for S. elongatus (Supplemental Fig. 5), 18–23°C is certainly a temperature range that this freshwater, temperate cyanobacterium could experience in its environment. We therefore tested the growth rates of S. elongatus in light/dark cycles at 37°C, 34°C, 30°C, 25°C, 20°C, and 18°C (Fig. 4 and Supplemental Figure S5). Consistent with our previous results using competition assays between WT and the arhythmic strain CLAb as well as with the highly damped strain CLAc3 (both CLAb and CLAc result from point mutations in the kaiC gene1), WT grew at a faster rate in LD at 30°C than CLAb or CLAc (Fig. 4b, Supplemental Table S7). The optKaiBC strain grew at about the same rate as WT or perhaps slightly faster. At cooler temperatures, however, the results were dramatically different. At 18°C and 20°C when the circadian rhythm of gene expression is damped in WT (Figs. 2b, 3e, Supplemental Fig. S4), WT grew significantly faster than optKaiBC (Fig. 4d,e, Supplemental Table S7). Even the arhythmic CLAb and damped CLAc strains outperformed optKaiBC at 18–25°C (Fig. 4c-e, Supplemental Table S7). Therefore, at cool temperatures in LD cycles, strains having damped (WT, CLAc) or arhythmic (CLAb) phenotypes under free-running conditions outgrew the strain that expressed robust rhythms (optKaiBC).
Figure 4. Optimizing the kaiBC sequence causes slower growth rate at cool temperatures.
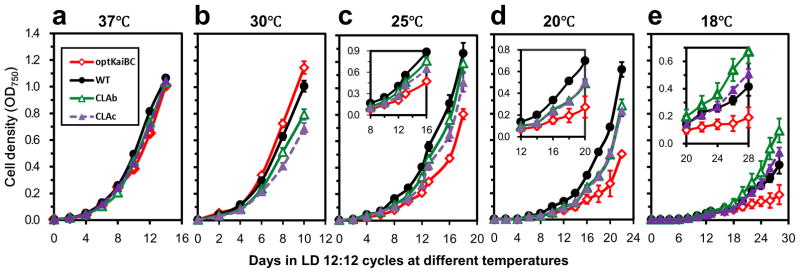
WT, optKaiBC, CLAb (arhythmic) and CLAc (damped oscillation) strains were grown in LD 12:12 cycles at (a) 37°C, (b) 30°C, (c) 25°C, (d) 20°C, or (e) 18°C with constant air bubbling and shaking. Cell densities were monitored by measuring OD750 every two days. Data are averages ± SEM from 2 to 6 independent experiments for each strain and condition. For a better comparison at 18°C, 20°C, and 25°C, the insets are a magnified portion for the specified times. (For doubling time calculations, see Table S7 and Supplementary Figure S5.)
Biases in codon usage are generally thought to be under directional selection for an optimal balance between translational efficiency and accuracy, whereby a higher CAI is always better5,7. Other examples of selection for non-optimal codon usage (mediated by mRNA secondary structure and/or tRNA availability) are rare and poorly characterized8,29. Our study presents a counter-example to the standard view and suggests the action of either (i) selection against optimal codon usage or (ii) stabilizing selection where both low and high extremes in codon usage bias have higher fitness costs. Indeed, the non-optimal codon usage appears to be a molecular mechanism whereby post-transcriptional events allow S. elongatus cells to switch between circadian and non-circadian regulation of gene expression depending upon the environmental conditions, and our results harken back to earlier observations of such “conditionality” for circadian rhythms2,30.
Why is conditionality an important characteristic of circadian rhythms? We tend to think of circadian clocks as rhythmic activators, but they are also rhythmic repressors. Under some conditions this repressor/activator balance may inhibit growth and circadian regulation may not be adaptive. At cooler temperatures, the free-running period of the circadian rhythm of S. elongatus can be as long as 30 h (Fig. 2c), suggesting that the coupling of gene expression and rhythmic regulation might be maladaptive for growth at lower temperatures. For example, we previously reported that S. elongatus mutant strains with 30 h periods can entrain to 24 h light/dark cycles, but they do so with a significantly later phase relationship that is maladaptive16; that result dovetails with our current observations. As another example of conditionality, our previous competition experiments at 30°C found that the arhythmic CLAb strain is more fit than WT under constant illumination, but it is rapidly outcompeted by WT in LD cycles3 (and Fig. 4 also shows that the growth of CLAb is poorer than WT in LD cycles at 20–30°C). Therefore, both illumination and temperature are environmental parameters that demonstrate the “conditional” advantages of circadian regulation under some conditions but not under others.
Our data show that optimizing the codon usage for the circadian kaiBC genes of S. elongatus does not disrupt endogenous circadian regulation (as in the case of Neurospora FRQ, accompanying manuscript by Zhou et al.), but instead the sequence optimization enhances circadian regulation in a range of cool temperatures that are relevant for the ecology of this organism. Despite this enhancement of intrinsic rhythmicity, however, optimal codon usage at the kai locus impairs cell growth at cooler temperatures. Therefore, our data suggest selection against an optimal codon usage because it is incompatible with a post-transcriptionally modulated conditional suppression of circadian rhythmicity at cool temperatures. In S. elongatus, circadian “conditionality” allows expression of robust endogenous rhythmicity within the range of temperature that permits vigorous growth and suppresses rhythmicity at temperatures where growth of this species is minimal (Supplemental Fig. 5). Our observations provide a novel example of post-transcriptional regulation of circadian clock genes that confers an adaptive response to different environmental conditions.
METHODS
Evaluation of codon usage
To evaluate frequency of codon usage of the central clock genes kaiABC, we analyzed coding sequences from different groups. One group is from 2400255 residue sequences from all putative proteins within the whole genome of Synechococcus elongatus PCC 7942. The second group is from all 59 ribosomal genes in the genome (Table S2). We also analyzed microarray datasets from two independent labs18,19. First, we calculated total microarray signals from one circadian cycle in constant light (LL) for each of these genes. Then, all of these genes were rearranged from strongest to weakest mRNA abundances based on the total microarray signal values in LL. Finally, we selected the top 16 genes that show high microarray values from both datasets (Table S3), and combined all of these coding sequences to the third group as putative highly expressed genes. The codon usage frequency was analyzed with a web-based program from The Sequence Manipulation Suite of Bioinformatics Organization, Inc. (Hudson, Massachusetts) (http://www.bioinformatics.org). The fractions of codon usage were based on usage frequencies per 1000 codons (Table S1).
Codon optimization of kai genes
Relative synonymous codon usage (RSCU) is defined as the ratio of the observed frequency of codons to the expected frequency given that all the synonymous codons for the same amino acids are used equally13,31. In the absence of any codon usage bias, the RSCU value would be 1.00. A codon that is used less frequently than expected will have a value of less than 1.00 and vice versa for a codon that is used more frequently than expected. The overall RSCU values of Synechococcus elongatus PCC 7942 were calculated from 3261 coding sequences (990021 codons) from the genome (Table S8). Infrequently used codons in kaiB or kaiC coding sequences were changed to those coding for the specific amino acids with higher RSCU values (Table S9 and Table S10) or higher codon-usage fractions (Table S1) in the genome. As shown in Fig. S6 and Table S9, 67 out of 102 codons were optimized for the entire kaiB coding region, whereas for kaiC gene, the infrequently-used codons were mainly optimized in the N-terminal KaiC-I domain that is encoded by the 5′ half of the kaiC gene (Fig. S7 and Table S10).
Synthesis and construction of optimized kai genes
DNA fragments containing optimized kaiB or kaiC coding sequences with wild-type flanking sequences were commercially synthesized and cloned into the Sma I site of pUC57 (EZBiolab Inc., Westfield, IN) to produce pUCoptKaiB and pUCoptKaiC, respectively. Based on pUCoptKaiB and pUCoptKaiC templates, the optKaiB or optKaiC fragments were resynthesized using 12 ~18 thermal cycles with pfuUltra® High-fidelity DNA polymerase (Stratagene, San Diego, CA) and primers containing the corresponding wild-type flanking sequences. After purification, the optKaiB or optKaiC fragments were EZcloned (Stratagene, San Diego, CA) into a plasmid containing the wild type kai cluster DNA to replace the corresponding wild-type DNA sequences. After the unchanged parental plasmid was digested at 37°C for 1 h with Dpn I (New England Biolabs, Beverly, MA), the circular, nicked optimized dsDNA was transformed into E. coli to generate pKai-optKaiB and pKai-optKaiC, respectively. To optimize both kaiB and kaiC genes, the resynthesized optKaiB fragment was EZcloned into the plasmid pKai-optKaiC to replace the corresponding wild-type kaiB coding sequences and to produce pKai-optKaiBC. All of these kai-optimized constructs were confirmed by DNA sequencing analysis. In case of direct comparison, the wild-type version of kaiB, kaiC, and kaiBC genes or coding sequences are indicated as kaiBWT, kaiCWT, and kaiBCWT, whereas the codon-optimized versions are denoted as kaiBopt, kaiCopt, and kaiBCopt, respectively.
Computation of codon adaptation index (CAI) and 5′ mRNA folding energy
In order to calculate CAI values of genes, we began by calculating the relative synonymous codon usage (RSCU) of all ribosomal genes (Table S2)13. Using these RSCU values, we calculated the CAI values of all genes in the S. elongatus genome and the codon-optimized versions of the kai genes. Using a sliding window of 20 codons, Figure 1a shows that optimized versions of both kaiB (kaiBopt) and kaiC (kaiCopt) genes have higher CAI values along the entire length of the genes than the WT versions and higher than the average CAI of ribosomal genes. The CAI of the wild-type kaiB and kaiC genes is less than the average CAI of the genome, in spite of their high abundance in the transcriptome. As expected, the average CAI of ribosomal genes is much higher than the average. As an example, the CAI of kaiBopt was optimized to 0.95 as shown by the red line in Fig. 1b using the relative synonymous codon usage (RSCU) of ribosomal genes.
In addition to codon usage as it relates to the relative expression of various tRNA genes, the translational efficiency of a protein’s production depends on the 5′ folding energy of its mRNA (1–40 nc). To calculate the minimum free energy (ΔG) of folding of the 5′ region of mRNAs, we used the first 40 nucleotides of the coding sequences (1–40 nc). In addition, we used the RNA folding algorithm in RNA fold of the Vienna RNA Package 2.032. We calculated ΔG at 37°C for each gene in the S. elongatus genome using default parameters. Then, to calculate the effect of temperature on folding energy for the kai genes (wild-type and optimized versions), we varied the temperature from 18°C – 40°C. The folding energy of the kaiBWT and kaiCWT genes is much higher than the rest of the genome, indicating selection for faster translation initiation (Fig. 1c). Since the folding energy of an mRNA depends on the temperature, calculation of the minimum free energy of folding (ΔG) at varying temperatures showed that the ΔG for both kaiBWT and kaiBopt increases with temperature, and that optimizing codon usage also increases the ΔG of the kaiBopt gene at all temperatures (Fig. 1d).
Generation of kai-optimized and kai-coexpressing cyanobacterial strains
Synechococcus elongatus PCC 7942 was used as the cyanobacterial host strain. A kaiBCp::luxAB luminescence reporter of clock-controlled gene expression was integrated into either neutral site I (NS I) with a spectinomycin selection marker (or in other experiments, into NS II with a chloramphenicol selection marker), in which the expression of the Vibrio harveyi luciferase structure gene cassette luxAB is driven by the promoter of the kaiBC genes (kaiBCp) and serves as a real-time reporter of promoter activity1,26,27. The kaiABC-null strain was created by replacement of the kaiABC DNA region with a kanamycin resistance gene1. The wild-type kaiABC cluster or codon-optimized kaiABC cluster containing a kaiBopt, kaiCopt, or kaiBCopt coding region and a spectinomycin resistance cassette was reintroduced into the endogenous kai locus by replacing the kanamycin resistance gene of the kaiABC-null strain to give rise to transgenic strains with either the wild-type version of the kaiABC cluster or the optimized version of the kaiABC cluster. This replacement was done in such a way that the kaiABC cluster was recreated to be exactly as the wild-type cluster with no insertions or deletions except a selection marker downstream of the genomic kaiC sequence. The transgenic cyanobacterial strain harboring the wild-type version of the kai cluster was named the wild type strain (WT), whereas the strains harboring codon-optimized versions of the kai cluster with kaiBopt, kaiCopt, or kaiBCopt were called “optKaiB,” “optKaiC,” or “optKaiBC,” respectively (Fig. 2a). For co-expression of wild-type kaiB, kaiC, or kaiBC genes in vivo, the trcp::kaiBWT, trcp::kaiCWT, or trcp::kaiBCWT constructs with a kanamycin resistance marker27 were transformed into the NS II region of a wild-type luminescence reporter strain to generate kai-coexpressing strains KaiBWT/OX, KaiCWT/OX, or KaiBCWT/OX (Fig. 3c), in which the coexpression of wild-type kaiB, kaiC, or kaiBC genes from NSII were under the control of an IPTG-derepressible heterologous trc promoter and the original kaiABC cluster remains at the original wild-type site. These codon-optimized strains harboring kaiBopt, kaiCopt, or kaiBCopt and kai-coexpressing strains were confirmed by PCR, DNA sequencing, immunobloting, as well as by luminescence analyses. As indicated in the diagrams of Fig. 2a, the wild-type coding region of kaiB gene was replaced with kaiBopt coding sequences in the optKaiB strain, whereas the kaiBC coding region was replaced with both kaiBopt and kaiCopt (i.e. kaiBCopt) coding sequences in the optKaiBC strain. At neutral site II (NS II), a kaiBC promoter-driving luxAB expression cassette with a chloramphenicol selection marker was integrated to function as a luminescence reporter of clock-controlled promoter activity. In the diagrams of Fig. 3c for the kaiBWT- or kaiBCWT-coexpressing strains, three sites in the chromosome are depicted: (i) the wild-type kaiABC cluster (kaiABCWT); (ii) the luxAB luminescence reporters in NS I; and (iii) an IPTG-derepressible promoter driving expression of kaiBWT (KaiBWT/OX strain) or kaiBCWT (KaiBCWT/OX strain) in NS II.
Measurement of luminescence rhythms
Cyanobacterial strains were grown in modified BG1133 liquid media with air bubbling or BG11 agar plates supplemented with appropriate antibiotics (spectinomycin, 20 μg/ml; kanamycin, 10 μg/ml; 5 μg/ml; chloramphenicol, 7.5 μg/ml) at 30°C under continuous cool-white illumination (LL; 40 ~ 50 μE/m2 s). Before the cells were released into LL for the luminescence assay, a 12 h dark exposure was given to synchronize the rhythms of the individual cells in the population. For induction of coexpressed kaiB, kaiC, or kaiBC genes, the trcp inducer IPTG was added at LL0 to final concentrations of 0, 2, 5, 10, 100, or 1000 μM. Luminescence was measured with the kaiBCp::luxAB reporter of clock-controlled gene expression that serves as a real-time reporter of promoter activity1,26,27. For measurement of in vivo luminescence rhythms at different temperatures (18°C to 38°C), at least 12 independent colonies for each condition were monitored as previously described27,34. Our standard light intensity for the luminescence rhythm assay was 40 to 50 μE/m2s, but we observed that the rate of damping in WT was influenced by both the temperature (as described in this paper) and light intensity (as tested under a range of light intensities).
Calculation of free-running period, Q10 value, and damping rate of luminescence rhythms
The period of luminescence rhythms was analyzed with ChronoAnalysis II, version 10.1 (courtesy of Dr. Till Roenneberg), and the Q10 value for evaluation of temperature compensation over a wide range of temperatures was calculated with the following equation: ; where: τ1 = period at the lower temperature (T1) and τ2 = period at the higher temperature (T2)35. Damping rate is the number of days required for the amplitude of the rhythm to decrease to 1/e of the starting value. The damping rates were calculated with the LUMICYCLE data analysis program (Actimetrics, Evanston, IL; courtesy of D. Ferster). The program fits the data to a sine wave multiplied by an exponential decay factor36.
Immunoblot assays for Kai abundance
After two LD 12:12 cycles, liquid cultures at OD750 ~ 0.3 were released to constant light (LL) at indicated temperatures. About 30 ml of cells were harvested at different time points and an appropriate amount of fresh medium was added to the culture flask to maintain an equal cell density during the time course experiment. For kaiB- or kaiBC-coexpressing strains, the cultures were treated with or without 5 μM of IPTG at LL0 for 12 hours before cell collection. Total proteins were extracted as previously described34. Total extracts were separated by SDS-polyacrylamide gel electrophoresis (PAGE) (15% gel for KaiB and 10% gel for KaiA and KaiC) and transferred onto nitrocellulose membranes. Proteins were transferred to nitrocellulose for immunoblotting using polyclonal rabbit antisera raised against KaiA or KaiB34 or using polyclonal mouse antisera raised against KaiC27. Equal loading of extracts was confirmed by Coomassie Brilliant Blue (CBB) staining in the gel, Ponceau Red staining on the membrane, and/or by the density of nonspecific bands on the immunoblots. The immunoblot signals for relative Kai protein density/abundance were analyzed with NIH Image J software.
Determination of growth rate and doubling time
Growth rates of cyanobacterial strains, including wild type, optKaiBC, as well as two arhythmic/damped kaiC mutants (CLAb and CLAc)1,3, were measured in parallel at 18°C, 20°C, 25°C, 30°C, 34°C, and 37°C. Initial cultures were grown in liquid BG-11 medium at 30°C under constant illumination (50 μE/m2 s) in a shaking water bath at 100 rpm and with air bubbling into the cultures. Cell densities were monitored by measuring the optical density at 750 nm (OD750). When cell densities reached OD750 ~ 0.8, cultures were diluted to OD750 ~ 0.005, and grown in LD 12:12 cycles (12 hours light {50 μE/m2 s} followed by 12 hours darkness) in water baths set to 18°C, 20°C, 25°C, 30°C, 34°C, or 37°C with shaking (100rpm) and air bubbling. Cell densities were determined at OD750 over a time course as indicated. When OD750 values of cell cultures exceed 0.9, the OD measurement is not linear with cell density. Therefore, for samples with an OD750 that was larger than 0.9, the samples were diluted to an OD750 that was within the linear range before OD determination (and the plotted OD value then is corrected for the dilution). Two to six independent experiments were performed for each strain, and the growth curves were plotted as average OD750 values over time in LD. Doubling time was calculated by fitting exponential curves to the growth curves. Growth rate was generated by fitting growth data to exponential curves {cell density at a specific time = initial cell density x e(growth rate × time)}. (see: http://mathworld.wolfram.com/LeastSquaresFittingExponential.html). Doubling time was calculated as: Doubling time (hrs) = {ln(2)/growth rate} × 24.
Statistical analyses
A two tailed Student t-test was used for statistical analyses. * p < 0.05; ** p< 0.01.
Supplementary Material
Acknowledgments
We are grateful for the suggestions of M. Woelfle and for the technical assistance of D. Zelli and C. Chintanaphol. This research was supported by grants from the National Institute of General Medical Science (N.I.H.) to CHJ (R01 GM067152 & R01 GM088595) and to YL (GM068496 & GM062591), the Welch Foundation (I-1560) to YL, the National Science Foundation to AR (DEB-0844968) and the Searle Scholars Program to AR. PS acknowledges support from a Burroughs Wellcome Fund Career Award and a David & Lucille Packard Foundation Fellowship awarded to Joshua B. Plotkin.
Footnotes
Full Methods and any associated references are available in the online version of the paper at www.nature.com/nature.
Author Contributions Y.X. and P.M. collected data; Y.X., P.M., and Y.L. analysed the experimental data; Y.X., P.S. and A.R. analysed the bioinformatic data; Y.L. and C.H.J. designed the original conceptual basis for the study, Y.X. and C.H.J. designed the experimental bases for the study; Y.X., P.S., and C.H.J. wrote the manuscript. All authors discussed the results and commented upon the manuscript.
Reprints and permissions information is available at www.nature.com/reprints.
The authors declare no competing financial interests.
Supplementary Information is linked to the online version of the paper at www.nature.com/nature.
References
- 1.Ishiura M, et al. Expression of a gene cluster kaiABC as a circadian feedback process in cyanobacteria. Science. 1998;281:1519–1523. doi: 10.1126/science.281.5382.1519. [DOI] [PubMed] [Google Scholar]
- 2.Njus D, McMurry L, Hastings JW. Conditionality of circadian rhythmicity: synergistic action of light and temperature. J Comp Physiol. 1977;117:335–344. [Google Scholar]
- 3.Woelfle MA, Ouyang Y, Phanvijhitsiri K, Johnson CH. The adaptive value of circadian clocks: an experimental assessment in cyanobacteria. Curr Biol. 2004;14:1481–1486. doi: 10.1016/j.cub.2004.08.023. [DOI] [PubMed] [Google Scholar]
- 4.Drummond DA, Wilke CO. Mistranslation-induced protein misfolding as a dominant constraint on coding-sequence evolution. Cell. 2008;134:341–352. doi: 10.1016/j.cell.2008.05.042. [DOI] [PMC free article] [PubMed] [Google Scholar]
- 5.Bulmer M. The selection-mutation-drift theory of synonymous codon usage. Genetics. 1991;129:897–907. doi: 10.1093/genetics/129.3.897. [DOI] [PMC free article] [PubMed] [Google Scholar]
- 6.Plotkin JB, Kudla G. Synonymous but not the same: the causes and consequences of codon bias. Nat Rev Genet. 2011;12:32–42. doi: 10.1038/nrg2899. [DOI] [PMC free article] [PubMed] [Google Scholar]
- 7.Shah P, Gilchrist MA. Explaining complex codon usage patterns with selection for translational efficiency, mutation bias, and genetic drift. Proc Natl Acad Sci U S A. 2011;108:10231–10236. doi: 10.1073/pnas.1016719108. [DOI] [PMC free article] [PubMed] [Google Scholar]
- 8.Eyre-Walker A, Bulmer M. Reduced synonymous substitution rate at the start of enterobacterial genes. Nucl Acids Res. 1993;21:4599–4603. doi: 10.1093/nar/21.19.4599. [DOI] [PMC free article] [PubMed] [Google Scholar]
- 9.Akashi H. Synonymous codon usage in Drosophila melanogaster: natural selection and translational accuracy. Genetics. 1994;136:927–935. doi: 10.1093/genetics/136.3.927. [DOI] [PMC free article] [PubMed] [Google Scholar]
- 10.Shah P, Gilchrist MA. Effect of correlated tRNA abundances on translation errors and evolution of codon usage bias. PLoS Genet. 2010;6:e1001128. doi: 10.1371/journal.pgen.1001128. [DOI] [PMC free article] [PubMed] [Google Scholar]
- 11.Zhou T, Weems M, Wilke CO. Translationally optimal codons associate with structurally sensitive sites in proteins. Mol Biol Evol. 2009;26:1571–1580. doi: 10.1093/molbev/msp070. [DOI] [PMC free article] [PubMed] [Google Scholar]
- 12.Ikemura T. Correlation between the abundance of Escherichia coli transfer RNAs and the occurrence of the respective codons in its protein genes: a proposal for a synonymous codon choice that is optimal for the E. coli translational system. J Mol Biol. 1981;151:389–409. doi: 10.1016/0022-2836(81)90003-6. [DOI] [PubMed] [Google Scholar]
- 13.Sharp PM, Li WH. The codon Adaptation Index - a measure of directional synonymous codon usage bias, and its potential applications. Nucl Acids Res. 1987;15:1281–1295. doi: 10.1093/nar/15.3.1281. [DOI] [PMC free article] [PubMed] [Google Scholar]
- 14.Lynn DJ, Singer GA, Hickey DA. Synonymous codon usage is subject to selection in thermophilic bacteria. Nucl Acids Res. 2002;30:4272–4277. doi: 10.1093/nar/gkf546. [DOI] [PMC free article] [PubMed] [Google Scholar]
- 15.Paul S, Bag SK, Das S, Harvill ET, Dutta C. Molecular signature of hypersaline adaptation: insights from genome and proteome composition of halophilic prokaryotes. Genome Biol. 2008;9:R70. doi: 10.1186/gb-2008-9-4-r70. [DOI] [PMC free article] [PubMed] [Google Scholar]
- 16.Ouyang Y, Andersson CR, Kondo T, Golden SS, Johnson CH. Resonating circadian clocks enhance fitness in cyanobacteria. Proc Natl Acad Sci U S A. 1998;95:8660–8664. doi: 10.1073/pnas.95.15.8660. [DOI] [PMC free article] [PubMed] [Google Scholar]
- 17.Liu Y, et al. Circadian orchestration of gene expression in cyanobacteria. Genes Dev. 1995;9:1469–1478. doi: 10.1101/gad.9.12.1469. [DOI] [PubMed] [Google Scholar]
- 18.Ito H, et al. Cyanobacterial daily life with Kai-based circadian and diurnal genome-wide transcriptional control in Synechococcus elongatus. Proc Natl Acad Sci U S A. 2009;106:14168–14173. doi: 10.1073/pnas.0902587106. [DOI] [PMC free article] [PubMed] [Google Scholar]
- 19.Vijayan V, Zuzow R, O’Shea EK. Oscillations in supercoiling drive circadian gene expression in cyanobacteria. Proc Natl Acad Sci U S A. 2009;106:22564–22568. doi: 10.1073/pnas.0912673106. [DOI] [PMC free article] [PubMed] [Google Scholar]
- 20.Vijayan V, Jain IH, O’Shea EK. A high resolution map of a cyanobacterial transcriptome. Genome Biol. 2011;12:R47. doi: 10.1186/gb-2011-12-5-r47. [DOI] [PMC free article] [PubMed] [Google Scholar]
- 21.Woelfle MA, Xu Y, Qin X, Johnson CH. Circadian rhythms of superhelical status of DNA in cyanobacteria. Proc Natl Acad Sci U S A. 2007;104:18819–18824. doi: 10.1073/pnas.0706069104. [DOI] [PMC free article] [PubMed] [Google Scholar]
- 22.Kudla G, Murray AW, Tollervey D, Plotkin JB. Coding-sequence determinants of gene expression in Escherichia coli. Science. 2009;324:255–258. doi: 10.1126/science.1170160. [DOI] [PMC free article] [PubMed] [Google Scholar]
- 23.Tuller T, Waldman YY, Kupiec M, Ruppin E. Translation efficiency is determined by both codon bias and folding energy. Proc Natl Acad Sci U S A. 2010;107:3645–3650. doi: 10.1073/pnas.0909910107. [DOI] [PMC free article] [PubMed] [Google Scholar]
- 24.Gu W, Zhou T, Wilke CO. A universal trend of reduced mRNA stability near translation-initiation site in prokaryotes and eukaryotes. PLoS Comp Biol. 2010;6(2):e1000664. doi: 10.1371/journal.pcbi.1000664. [DOI] [PMC free article] [PubMed] [Google Scholar]
- 25.Pittendrigh CS. On Temperature Independence in the Clock System Controlling Emergence Time. Drosophila Proc Natl Acad Sci U S A. 1954;40:1018–1029. doi: 10.1073/pnas.40.10.1018. [DOI] [PMC free article] [PubMed] [Google Scholar]
- 26.Kondo T, et al. Circadian rhythms in prokaryotes: luciferase as a reporter of circadian gene expression in cyanobacteria. Proc Natl Acad Sci U S A. 1993;90:5672–5676. doi: 10.1073/pnas.90.12.5672. [DOI] [PMC free article] [PubMed] [Google Scholar]
- 27.Xu Y, Mori T, Johnson CH. Cyanobacterial circadian clockwork: roles of KaiA, KaiB and the kaiBC promoter in regulating KaiC. EMBO J. 2003;22:2117–2126. doi: 10.1093/emboj/cdg168. [DOI] [PMC free article] [PubMed] [Google Scholar]
- 28.Nakajima M, Ito H, Kondo T. In vitro regulation of circadian phosphorylation rhythm of cyanobacterial clock protein KaiC by KaiA and KaiB. FEBS Lett. 2010;584:898–902. doi: 10.1016/j.febslet.2010.01.016. [DOI] [PubMed] [Google Scholar]
- 29.Konigsberg W, Godson GN. Evidence for use of rare codons in the dnaG gene and other regulatory genes of Escherichia coli. Proc Natl Acad Sci U S A. 1983;80:687–691. doi: 10.1073/pnas.80.3.687. [DOI] [PMC free article] [PubMed] [Google Scholar]
- 30.Liu Y, Garceau NY, Loros JJ, Dunlap JC. Thermally regulated translational control of FRQ mediates aspects of temperature responses in the Neurospora circadian clock. Cell. 1997;89:477–486. doi: 10.1016/s0092-8674(00)80228-7. [DOI] [PubMed] [Google Scholar]
- 31.Sharp PM, Li WH. An evolutionary perspective on synonymous codon usage in unicellular organisms. J Mol Evol. 1986;24:28–38. doi: 10.1007/BF02099948. [DOI] [PubMed] [Google Scholar]
- 32.Schuster P, Fontana W, Stadler PF, Hofacker IL. From sequences to shapes and back: a case study in RNA secondary structures. Proc Bio Sci. 1994;255:279–284. doi: 10.1098/rspb.1994.0040. [DOI] [PubMed] [Google Scholar]
- 33.Bustos SA, Golden SS. Expression of the psbDII gene in Synechococcus sp strain PCC 7942 requires sequences downstream of the transcription start site. J bacteriol. 1991;173:7525–7533. doi: 10.1128/jb.173.23.7525-7533.1991. [DOI] [PMC free article] [PubMed] [Google Scholar]
- 34.Xu Y, Mori T, Johnson CH. Circadian clock-protein expression in cyanobacteria: rhythms and phase setting. EMBO J. 2000;19:3349–3357. doi: 10.1093/emboj/19.13.3349. [DOI] [PMC free article] [PubMed] [Google Scholar]
- 35.Xu Y, et al. Intramolecular regulation of phosphorylation status of the circadian clock protein KaiC. PLoS ONE. 2009;4:e7509. doi: 10.1371/journal.pone.0007509. [DOI] [PMC free article] [PubMed] [Google Scholar]
- 36.Izumo M, Johnson CH, Yamazaki S. Circadian gene expression in mammalian fibroblasts revealed by real-time luminescence reporting: temperature compensation and damping. Proc Natl Acad Sci U S A. 2003;100:16089–16094. doi: 10.1073/pnas.2536313100. [DOI] [PMC free article] [PubMed] [Google Scholar]
Associated Data
This section collects any data citations, data availability statements, or supplementary materials included in this article.