Abstract
Cloud droplet formation depends on the condensation of water vapor on ambient aerosols, the rate of which is strongly affected by the kinetics of water uptake as expressed by the condensation (or mass accommodation) coefficient, αc. Estimates of αc for droplet growth from activation of ambient particles vary considerably and represent a critical source of uncertainty in estimates of global cloud droplet distributions and the aerosol indirect forcing of climate. We present an analysis of 10 globally relevant data sets of cloud condensation nuclei to constrain the value of αc for ambient aerosol. We find that rapid activation kinetics (αc > 0.1) is uniformly prevalent. This finding resolves a long-standing issue in cloud physics, as the uncertainty in water vapor accommodation on droplets is considerably less than previously thought.
Keywords: global climate, hydrological cycle, precipitation
Atmospheric aerosols affect the radiative balance of the Earth, directly through absorption and scattering of solar radiation and indirectly by influencing the microphysical properties, abundance, and lifetime of clouds. The magnitude of the indirect aerosol radiative forcing represents the most uncertain component of the estimated anthropogenic effect on climate (1). Cloud properties are intimately tied to the activation of individual aerosol particles and subsequent growth of the newly formed droplets by accretion of water vapor. This process depends on the rate of transfer of water vapor to droplets; the fraction, αc, of water molecules impinging on the surface of droplets that are incorporated in the droplet, the so-called uptake coefficient (2), is a critical parameter in global climate models.
The value of αc has been a subject of research for decades; it is commonly determined as an adjustable parameter to match growth rate measurements of droplets containing a well-defined concentration of solute (2, 3). The prevailing view is that αc for a pure water surface is close to unity. Actual cloud droplets, however, may contain solutes or surface films that affect growth kinetics even at low concentrations (4, 5), because slow solute dissolution (6) or glassy or highly viscous aerosol phases (7) may suppress droplet growth rates. The effective αc (that accounts for all water uptake processes) for droplets activated on ambient particles may be considerably lower than unity, with estimates of αc for ambient droplets ranging from 10−5 to 1.0 (8–14). The smallest values in this range are unlikely to be representative of the global aerosol population, but several of these studies report values of αc between 10−1 and 10−2, indicating significantly slower water uptake rates than that for pure water droplets.
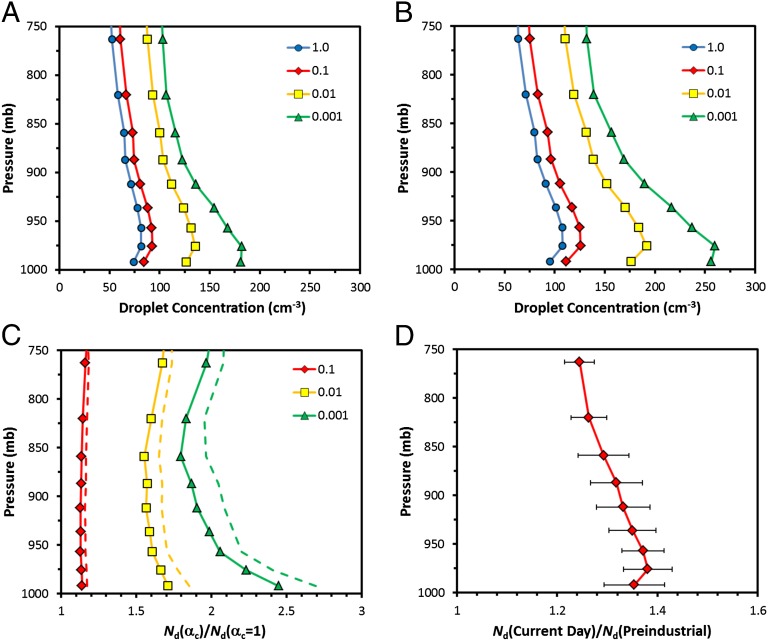
Droplet formation in climate model simulations can be very sensitive to variations in αc, owing to the dependence of cloud droplet number concentration (Nd) on the maximum supersaturation that develops in clouds. The latter is controlled by a balance between supersaturation generation (from radiative or expansion cooling) and depletion from condensation of water vapor on existing droplets. A smaller value of αc results in slower water vapor condensation, allowing supersaturation to develop more fully and increasing Nd before reaching its maximum. This phenomenon is demonstrated by the sensitivity of global annual average vertical distributions of Nd to αc, computed with a state-of-the-art climate model for preindustrial (Fig. 1A) and current-day emissions (Fig. 1B). As expected, Nd correlates directly with aerosol concentration. Decreasing αc from 1.0 to 0.1 results in a 10–15% increase in Nd for current day emissions, whereas reducing αc to 10−2 and 10−3 leads to considerable increases in Nd by factors of 1.5–1.8 and 2.0–2.5, respectively (Fig. 1C). This Nd variability far surpasses the predicted 20–40% change in Nd between preindustrial and current-day emissions (for constant αc; Fig. 1D). The implication is that for aerosol–cloud–climate interaction studies, the extent to which αc varies over space and time (especially if αc < 0.1) is critical in understanding its contribution to Nd variability; hence, global cloud properties and climate. Little is known, however, concerning the spatial and temporal distribution of αc. This uncertainty translates to a considerable, but unconstrained, source of uncertainty in estimating aerosol indirect forcing.
Fig. 1.
Global annual average vertical distributions of cloud droplet number concentration (Nd) computed with the NCAR Community Atmosphere Model 5.1 for (A) preindustrial emissions with fixed αc and (B) current-day emissions with fixed αc. (C) Nd for fixed value of α normalized by those computed for αc = 1 for preindustrial (solid line) and current-day (dashed line) emissions. (D) Nd for current-day emissions normalized with those for preindustrial emissions. Curve represents average of all constant αc simulations, whereas error bars reflect the corresponding SD.
Measurements of the droplet size distribution resulting from exposure of aerosol particles to a given water vapor supersaturation, the so-called Cloud Condensation Nuclei (CCN) data, can provide the fundamental information on which values of αc can be inferred. For this, threshold droplet growth analysis (TDGA) (15–18) is based on comparing the growth of activated CCN against a standard particle that rapidly grows [e.g., (NH4)2SO4 CCN with αc > 0.1 (19)] for identical measurement conditions. If droplet sizes from ambient particles are similar to the standard, they are considered to have similar αc; a smaller droplet size may suggest slower growth kinetics (and lower αc). TDGA is designed to detect the presence of potentially slowly growing CCN but does not numerically constrain αc. Furthermore, the technique is subject to uncertainty when the particle number concentration is sufficiently high to deplete supersaturation in the instrument (19, 20). TDGA is therefore most effective when used to exclude the presence of slowly growing CCN.
A recently developed numerical model that simulates droplet growth in the Droplet Measurement Technologies CCN instrument (19) is able to analyze large field and laboratory data sets while comprehensively accounting for supersaturation depletion effects (20), variations in instrument operation parameters, and dry particle size distributions and hygroscopicity. The first applications of the model to ambient CCN data sets, one collected close to the Deepwater Horizon oil spill site (14) and the other collected from transecting forest fire plumes (19), demonstrated that supersaturation depletion effects and changes in dry particle size and hygroscopicity distributions caused depressions in observed droplet size that TDGA would incorrectly interpret as changes in αc. Extending the analysis to ambient CCN data sets of global relevance provides a novel constraint on the variability of αc and its dependence on source type and chemical composition.
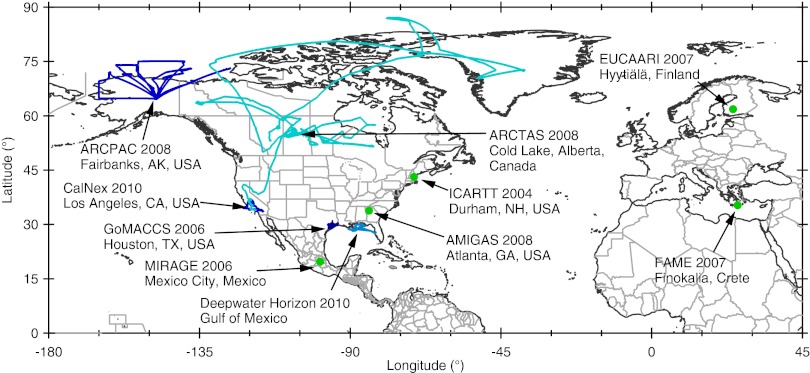
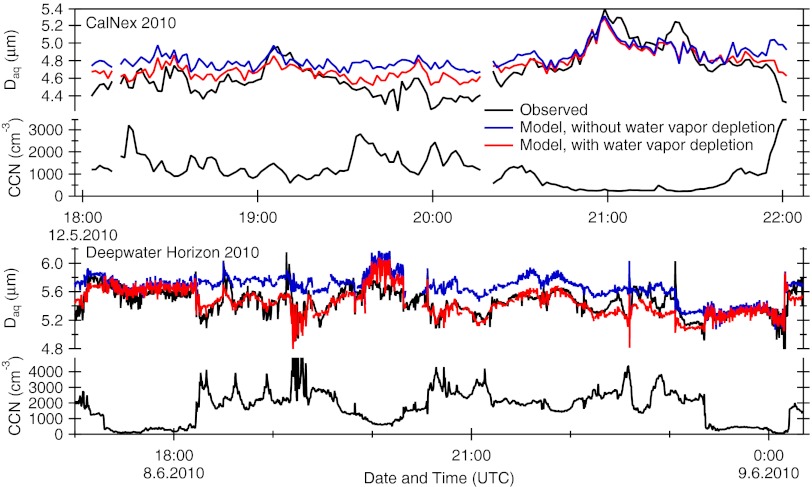
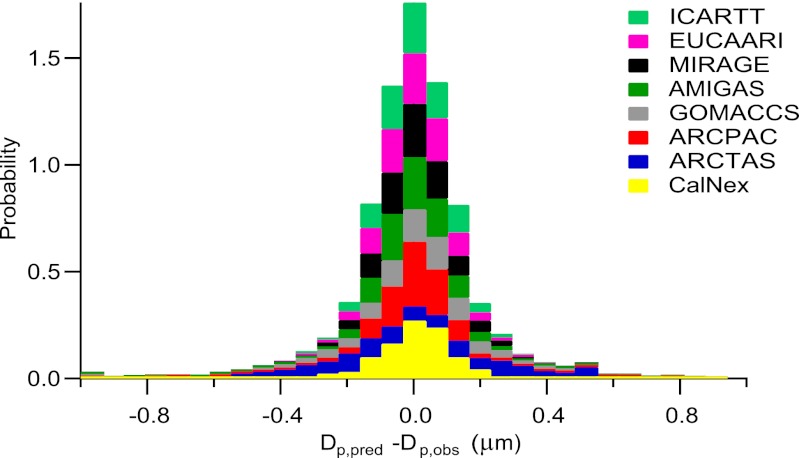
The eight data sets analyzed here (Table 1; Fig. 2) are large and globally representative (SI Text), including urban outflows, boreal forests, Arctic air masses, fresh and aged biomass burning plumes, and continental air with anthropogenic and biogenic influences. We also include two previous studies on the activation kinetics of aged marine air in the eastern Mediterranean (15, 16) and near a strong hydrocarbon source at Deepwater Horizon (14). Stringent filtering to exclude data subject to instrument transients (fluctuating behavior in column pressure, temperature, and supersaturation) and significant changes in dry particle size distribution during the sampling/averaging is required, as these can notably influence droplet size and the kinetic interpretation. The latter is especially important for airborne data, where the environment changes rapidly. Even with filtering, TDGA could not rule out the presence of some droplets with depressed growth. To study whether the observed depressed size is from αc < 0.1, instrument variability, supersaturation depletion effects, or variability in aerosol size distribution and hygroscopicity, we apply an approach proposed by Raatikainen et al. (19) that is insensitive to observation and prediction biases. Because activated droplet size is a function of aerosol size distribution, hygroscopicity, instrument operating conditions (accurately known), and αc (not known), one can simulate the activation and growth of CCN in the Droplet Measurement Technologies CCN counter using a prescribed (constant) αc. If the difference between observed and predicted droplet size is essentially constant for all of the data, then a constant αc is assumed valid. Indeed, this is found to be the case for our globally relevant data sets. Prescribing αc = 0.2 [which is representative of fast activation kinetics (19)] captures the temporal variability of measured droplet size (Fig. 3) to within a constant bias and a 0.3-μm variance (Fig. 4), which characterizes normal instrument variability and the essentially unresolvable range of αc between 0.1 and 1.0 (19, 21). With this result and the fact that TDGA suggests that the majority of particles activate as rapidly as (NH4)2SO4, one concludes that αc > 0.1 is globally representative. Regions of the globe not directly sampled (e.g., eastern Asia, Amazon) generally follow one of the air types of Table 1; CCN activation kinetics of globally important secondary organic aerosol generated in environmental chambers further supports the model of rapid activation (SI Text).
Table 1.
Globally representative data sets considered in this study
| Campaign | Location | Dates | Supersaturation (%) |
| ICARTT (28) | New Hampshire | 7/04–8/04 | 0.2–0.6 |
| EUCAARI (18) | Hyytiälä, Finland | 3/07–5/07 | 0.1–1.8 |
| MIRAGE (29) | Mexico City, Mexico | 3/06 | 0.07–1.05 |
| AMIGAS (17) | Atlanta, Georgia | 8/08–9/08 | 0.2–1.0 |
| GoMACCS (30) | Texas | 8/06–9/06 | 0.3–1.0 |
| ARCPAC (31) | Alaska | 4/08 | 0.1–0.6 |
| ARCTAS (32) | Saskatchewan, Canada | 7/08 | 0.20–0.57 |
| CalNex (33, 34) | California | 5/10 | 0.31–0.34 |
| FAME (15, 16) | Finokalia, Crete | 7/07–10/07 | 0.2–0.73 |
| DWH (14) | Gulf of Mexico | 6/10 | 0.31 |
The growth kinetics analysis of the FAME and Deepwater Horizon (DWH) data sets is published elsewhere; analysis of the other eight data sets is presented in SI Text. AMIGAS, August Mini Intensive Gas and Aerosol Study; ARCPAC, Aerosol, Radiation, and Cloud Processes affecting Arctic Climate; ARCTAS, Arctic Research of the Composition of the Troposphere from Aircraft and Satellites; CalNex, California Nexus; EUCAARI, European Integrated Project on Aerosol Cloud Climate and Air Quality Interactions; FAME, Finokalia Aerosol Measurement Experiment; GoMACCS, Gulf of Mexico Atmospheric Composition and Climate Study; ICARTT, International Consortium for Atmospheric Research on Transport and Transformation; MIRAGE, Megacities Impacts on Regional and Global Environments; DWH, Deepwater Horizon.
Fig. 2.
Campaign sites (green markers) and flight tracks (light and dark blue lines) of the globally representative data sets considered in this study. Analysis of the data sets is presented in SI Text and in previous publications (14–16).
Fig. 3.
Characteristic observed and predicted time series of number-average droplet diameter for αc = 0.2. Constant 1- and 2.3-μm offsets were added to the observed droplet sizes from the CalNex and Deepwater Horizon campaigns, respectively. The Deepwater Horizon data are from ref. 14. Neglecting to simulate the supersaturation depression from condensation of water vapor on CCN leads to a larger and considerably less variable predicted mean droplet size than observed. Depletion effects are more prominent for DWH because the presence of coarse mode sea salt leads to larger-size droplets that cause greater total condensation and water vapor depletion for a given particle concentration. In both data sets, applying TDGA would misidentify the presence of slow growth kinetics.
Fig. 4.
Probability density distributions of the difference between average predicted (αc = 0.2) and observed droplet diameters in the CCN instrument for all the data analyzed in this study. The observed droplet sizes are corrected for a constant bias expressing droplet sizing shifts in the CCN instrument and model prediction uncertainties, as described in SI Text. For all the data shown, predicted droplet size exhibits variability that is within instrument uncertainty, meaning that the effective uptake coefficient is effectively constant for all the data. Combining the results of TDGA on the same data leads to the conclusion that rapid droplet growth kinetics (with αc between 0.1 and 1.0) is globally prevalent.
Important implications arise from our results. First, αc is effectively constant for all the data considered, even for particles composed largely of organics with very low oxygen content. Anthropogenic (compositional) impacts on αc are therefore limited to the 0.1–1.0 range, considerably reducing the uncertainty for cloud droplet number prediction in climate models. This study resolves a decades-long uncertainty in cloud physics on the value of αc, because it appears that αc for ambient aerosol can be represented in models with a constant value in the 0.1–1.0 range.
Materials and Methods
Ambient CCN Data Sets Considered.
CCN data are collected with a Droplet Measurement Technologies continuous flow streamwise thermal gradient chamber (22, 23). This instrument consists of a continuous flow tube in which the sample flow is focused on the column centerline by using a larger sheath flow. Chamber walls are kept wet, and a positive wall temperature gradient is maintained by three sets of thermo-electric coolers. Because water vapor diffuses faster than heat in air, supersaturation increases with distance from the wall, reaching a maximum at the column centerline. Due to the entry length effects, particles are first exposed to a quickly increasing relative humidity until a relatively stable maximum supersaturation is reached. Activated droplets exiting the chamber are counted and sized (20 size bins from 0.5 to 10.0 μm) by an optical particle counter. Instrument supersaturation, typically as a function of wall temperature gradient, is determined by conducting calibration experiments with ammonium sulfate or sodium chloride aerosol. The data sets for which CCN measurements are analyzed are described in detail in SI Text.
CCN Instrument Model Description.
The coupled instrument and droplet growth model (19), freely available at http://nenes.eas.gatech.edu/Experiments/CFSTGC.html, calculates flow velocity, pressure, and supersaturation profiles from the measured sample pressure, column temperatures, sample and sheath flow rates, and calibrated maximum supersaturation. Flow velocities and supersaturation profiles are then used in a Lagrangian droplet growth model to calculate the growth and activation of CCN as they flow through the instrument chamber. The growth model input parameters are αc, dry particle size distributions, and hygroscopicity. Number concentrations are needed to account for water vapor depletion effects because CCN chamber supersaturation is decreased due to water vapor condensation on growing droplets, leading to coupling between the instrument and droplet growth models (20).
Global Simulations.
The impact of the mass accommodation coefficient αc on cloud properties and indirect aerosol radiative forcing was estimated using the community atmosphere model (CAM5.1), which is a state-of-the-art atmospheric general circulation model with fully coupled aerosol–cloud interactions (24). We used the model configured with the finite volume dynamic core, with a horizontal resolution of 1.9° × 2.5° and 30 levels in the vertical. The three-mode version of the modal aerosol module (MAM3) was used, which considers aerosol sulfate, ammonium, nitrate, primary organic matter, secondary organic aerosol, black carbon, sea salt, and dust; particles are distributed into Aitken, accumulation, and coarse lognormal modes with prescribed geometric SD. The mode diameter varies as aerosol number and total mass change. The MAM3 is coupled to a double moment cloud microphysics scheme. Particles can be removed by wet removal mechanisms or regenerated to interstitial aerosol after cloud droplets evaporate. Activation of aerosol to cloud droplets is calculated with the (25) parameterization, which includes the effect of αc on the activation process. Simulations with αc = 1, 10−1, 10−2, and 10−3 were performed for current-day and preindustrial emissions of aerosol precursors, with climatological sea surface temperatures and ice cover. Emissions data sets used in the simulations are those of ref. 26 for both the present day (year 2000) and preindustrial simulations (year 1850). The vertical distribution of emissions follows the protocol of ref. 27. The reported fields of in-cloud droplet number concentrations correspond to the annual average from the last 5 y of simulation, after allowing 1 y of simulation for spin-up. The annual average spatial distribution of cloud number concentrations for preindustrial and current-day emissions are provided in SI Text.
Supplementary Material
Acknowledgments
We thank Dr. Xiaohong Liu for advice on using the CAM 5.1 and for providing computer time for the simulations. We also thank all those who contributed to the measurement campaigns; Charles Brock from the National Oceanic and Atmospheric Administration (NOAA) Earth System Research Laboratory; and the National Aeronautics and Space Administration (NASA) Langley Aerosol Research Group Experiment for supporting aerosol measurements during Arctic Research of the Composition of the Troposphere from Aircraft and Satellites. T.R. thanks the Finnish Cultural Foundation; S.L. and J.J.L. acknowledge the support of a Georgia Tech President’s fellowship and an National Center for Atmospheric Research Advanced Study Program Graduate Fellowship; and J.J.L. thanks the NASA Graduate Student Researchers Program for funding. R.H.M. acknowledges support from a Department of Energy Global Change Education Fellowship, a NASA Earth and Space Science Fellowship, and a NASA postdoctoral fellowship. L.T.P. received funding from a NASA Earth System Science fellowship. T.L.L. acknowledges support from a National Science Foundation (NSF) fellowship and a Georgia Tech institutional fellowship. Funding from a DOE grant (to A.N.), the Electric Power Research Institute, an NSF Faculty Early Career Development award (to A.N.), NOAA grants (to J.H.S. and A.N.), and NASA grants (to A.N.) is acknowledged.
Footnotes
The authors declare no conflict of interest.
This article is a PNAS Direct Submission.
This article contains supporting information online at www.pnas.org/lookup/suppl/doi:10.1073/pnas.1219591110/-/DCSupplemental.
References
- 1.Intergovernmental Panel on Climate Change (IPCC) 2007. Climate Change (The Physical Science Basis. Contribution of Working Group I to the Fourth Assessment Report of the Intergovernmental Panel on Climate Change (Cambridge Univ Press, Cambridge, UK)
- 2.Kolb CE, et al. An overview of current issues in the uptake of atmospheric trace gases by aerosols and clouds. Atmos Chem Phys. 2010;10(21):10561–10605. [Google Scholar]
- 3.Mozurkewich M. Aerosol growth and the condensation coefficient for water: A review. Aerosol Sci Technol. 1986;5(2):223–236. [Google Scholar]
- 4.Feingold G, Chuang PY. Analysis of the influence of film-forming compounds on droplet growth: Implications for cloud microphysical processes and climate. J Aerosol Sci. 2002;59(12):2006–2018. [Google Scholar]
- 5.Takahama S, Russell LM. A molecular dynamics study of water mass accommodation on condensed phase water coated by fatty acid monolayers. J Geophys Res. 2011;1116(D2) [Google Scholar]
- 6.Asa-Awuku A, Nenes A. Effect of solute dissolution kinetics on cloud droplet formation: Extended Köhler theory. J Geophys Res. 2007;112(D22) [Google Scholar]
- 7.Tong H-J, et al. Measurements of the timescales for the mass transfer of water in glassy aerosol at low relative humidity and ambient temperature. Atmos Chem Phys. 2011;11(10):4739–4754. [Google Scholar]
- 8.Chuang PY. Measurement of the timescale of hygroscopic growth for atmospheric aerosols. J Geophys Res. 2003;108(D9) [Google Scholar]
- 9.Stroud CA, et al. Cloud activating properties of aerosol observed during CELTIC. J Aerosol Sci. 2007;64(2):441–459. [Google Scholar]
- 10.Fountoukis C, et al. Aerosol–cloud drop concentration closure for clouds sampled during the International Consortium for Atmospheric Research on Transport and Transformation 2004 campaign. J Geophys Res. 2007;112(D10) [Google Scholar]
- 11.Ruehl CR, Chuang PY, Nenes A. How quickly do cloud droplets form on atmospheric particles? Atmos Chem Phys. 2008;8(4):1043–1055. [Google Scholar]
- 12.Ruehl CR, Chuang PY, Nenes A. Distinct CCN activation kinetics above the marine boundary layer along the California coast. Geophys Res Lett. 2009;36(15) [Google Scholar]
- 13.Shantz NC, et al. Slower CCN growth kinetics of anthropogenic aerosol compared to biogenic aerosol observed at a rural site. Atmos Chem Phys. 2010;10(1):299–312. [Google Scholar]
- 14.Moore RH, et al. CCN spectra, hygroscopicity, and droplet activation kinetics of secondary organic aerosol resulting from the 2010 Deepwater Horizon oil spill. Environ Sci Technol. 2012;46(6):3093–3100. doi: 10.1021/es203362w. [DOI] [PubMed] [Google Scholar]
- 15.Bougiatioti A, et al. Cloud condensation nuclei measurements in the marine boundary layer of the Eastern Mediterranean: CCN closure and droplet growth kinetics. Atmos Chem Phys. 2009;9(18):7053–7066. [Google Scholar]
- 16.Bougiatioti A, et al. Size-resolved CCN distributions and activation kinetics of aged continental and marine aerosol. Atmos Chem Phys. 2011;11(16):8791–8808. [Google Scholar]
- 17.Padró LT, et al. Mixing state and compositional effects on CCN activity, and droplet activation kinetics of size-resolved CCN in an urban environment. Atmos Chem Phys. 2012;12(21):10239–10255. [Google Scholar]
- 18.Cerully KM, et al. Aerosol hygroscopicity and CCN activation kinetics in a boreal forest environment during the 2007 EUCAARI campaign. Atmos Chem Phys. 2011;11(23):12369–12386. [Google Scholar]
- 19.Raatikainen T, et al. A coupled observation-modeling approach for studying activation kinetics from measurements of CCN activity. Atmos Chem Phys. 2012;12(9):4227–4243. [Google Scholar]
- 20.Lathem TL, Nenes A. Water vapor depletion in the DMT continuous-flow CCN chamber: Effects on supersaturation and droplet growth. Aerosol Sci Technol. 2011;45(5):604–615. [Google Scholar]
- 21.Miles RH, et al. Comparison of Approaches for Measuring the Mass Accommodation Coefficient for the Condensation of Water and Sensitivities to Uncertainties in Thermophysical Properties J. Phys. Chem. A. 2012;116(44):10810–10825. doi: 10.1021/jp3083858. [DOI] [PMC free article] [PubMed] [Google Scholar]
- 22.Roberts GC, Nenes A. A continuous-flow streamwise thermal-gradient CCN chamber for atmospheric measurements. Aerosol Sci Technol. 2005;39(3):206–221. [Google Scholar]
- 23.Lance S, Medina J, Smith JN, Nenes A. Mapping the operation of the DMT continuous flow CCN counter. Aerosol Sci Technol. 2006;40(4):242–254. [Google Scholar]
- 24.Liu X, et al. Toward a minimal representation of aerosols in climate models: Description and evaluation in the community atmosphere model CAM5. Geosci. Model Dev. 2012;5(3):709–739. [Google Scholar]
- 25.Fountoukis C, Nenes A. Continued development of a cloud droplet formation parameterization for global climate models. J Geophys Res. 2005;110(D11) [Google Scholar]
- 26.Lamarque JF, et al. Historical (1850-2000) gridded anthropogenic and biomass burning emissions of reactive gases and aerosols: Methodology and application. Atmos Chem Phys. 2010;10(15):7017–7039. [Google Scholar]
- 27.Dentener F, et al. Emissions of primary aerosol and precursor gases in the years 2000 and 1750 prescribed data-sets for AeroCom. Atmos Chem Phys. 2006;6(12):4321–4344. [Google Scholar]
- 28.Medina J, et al. Cloud condensation nuclei closure during the International Consortium for Atmospheric Research on Transport and Transformation 2004 campaign: Effects of size-resolved composition. J Geophys Res. 2007;112(D10):D10S31. [Google Scholar]
- 29.Lance S, et al. Aerosol mixing-state, hygroscopic growth and cloud activation efficiency during MIRAGE 2006. Atmos Chem Phys Discuss. 2012;12(6):15709–15742. [Google Scholar]
- 30.Lance S, et al. Cloud condensation nuclei activity, closure, and droplet growth kinetics of Houston aerosol during the Gulf of Mexico Atmospheric Composition and Climate Study (GoMACCS) J Geophys Res. 2009;114(D7):D00F15. [Google Scholar]
- 31.Moore RH, et al. Hygroscopicity and composition of Alaskan Arctic CCN during April 2008. Atmos Chem Phys. 2011;11(22):11807–11825. [Google Scholar]
- 32.Lathem TL, et al. Analysis of CCN activity and droplet activation kinetics of Arctic aerosol during summer 2008. Atmos Chem Phys Discuss. 2012;12(9):24677–24733. [Google Scholar]
- 33.Ensberg JJ, et al. Inorganic and black carbon aerosols in the Los Angeles Basin during CalNex. J Geophys Res. 2012 in press. [Google Scholar]
- 34.Moore RH, et al. Hygroscopicity and Composition of California CCN During Summer 2010. J Geophys Res. 2012b;117(D7):D00V12. [Google Scholar]
Associated Data
This section collects any data citations, data availability statements, or supplementary materials included in this article.


