

Abstract
Cells use general stress response pathways to activate diverse target genes in response to a variety of stresses. However, general stress responses coexist with more specific pathways that are activated by individual stresses, provoking the fundamental question of whether and how cells control the generality or specificity of their response to a particular stress. Here we address this issue using quantitative time-lapse microscopy of the Bacillus subtilis environmental stress response, mediated by σB. We analyzed σB activation in response to stresses such as salt and ethanol imposed at varying rates of increase. Dynamically, σB responded to these stresses with a single adaptive activity pulse, whose amplitude depended on the rate at which the stress increased. This rate-responsive behavior can be understood from mathematical modeling of a key negative feedback loop in the underlying regulatory circuit. Using RNAseq we analyzed the effects of both rapid and gradual increases of ethanol and salt stress across the genome. Because of the rate responsiveness of σB activation, salt and ethanol regulons overlap under rapid, but not gradual, increases in stress. Thus, the cell responds specifically to individual stresses that appear gradually, while using σB to broaden the cellular response under more rapidly deteriorating conditions. Such dynamic control of specificity could be a critical function of other general stress response pathways.
Keywords: systems biology, single-cell dynamics, computational biology
Cells must respond to, and anticipate, a wide range of stresses that occur on multiple timescales. For this purpose, many species use general stress response pathways, which activate a diverse set of target regulons in response to a variety of stresses. For example, in mammals, p53 is activated by DNA damage (1–4) and hypoxia (5, 6), among others, and activates genes that impact cell cycle progression (7), DNA repair (8, 9), apoptosis, and angiogenesis (10, 11). In yeast, Msn2/4 responds to nutritional stress (12), as well as to salt (13), calcium (14), heat, and other stresses (15). Bacteria also contain general stress response pathways, including the alternative sigma factors RpoS in Escherichia coli (16) and σB in Bacillus subtilis (17).
It has been proposed that general stress response pathways enable cells to cross-protect, by anticipating stresses that may not be present at the moment, but are likely to occur soon (18). For example, preexposure to specific stresses is known to enhance bacterial resistance to different stresses applied subsequently (19–21). This raises a basic question: How do cells determine when to use the general stress response rather than activating more specific individual pathways?
The σB-mediated general stress response of B. subtilis provides an ideal model system to address these issues. σB is activated by diverse stresses through a well-characterized and conserved transcriptional and posttranscriptional circuit mechanism (17). In response to stress, it activates ∼200 target genes (22). Moreover, σB activity can be quantitatively analyzed at the level of individual cells, using time-lapse movies and fluorescent protein reporters (23).
The key interactions that control σB activation have been elucidated (24–27). σB is directly regulated by RsbW, an anti-sigma factor. Stresses lead to dephosphorylation of the RsbV anti–anti-sigma factor. Desphosphorylated RsbV can bind to and be rephosphorylated by RsbW, which also has kinase activity. When RsbV is bound to RsbW, σB is released and can activate target genes, including its own operon (Fig. 1A). Two different classes of stress—energy stress and environmental stress—activate σB, but they do so through distinct RsbV phosphatases: RsbQP and RsbTU, respectively (24, 26).
Fig. 1.

σB general stress response pathway shows adaptive pulse amplitude modulation (APAM) in response to environmental stress. (A) The σB environmental stress response circuit (schematic). The stressosome (orange) controls the availability of RsbT (purple), the positive activator of RsbU. Active RsbU dephosphorylates RsbV (blue), which can bind RsbW (red), releasing σB (green) to activate target promoters, including its own operon (shown). Activation of the σB operon increases expression of RsbX phosphatase (gray), which counteracts activation of RsbT. Energy stress is transduced by a different RsbV phosphatase (Fig. S3). (B) Time-lapse microscopy of cells containing a PsigB-yfp promoter reporter reveals a single pulse in response to sudden addition of ethanol. (C) Time traces of PsigB-yfp promoter activity. Each curve represents the response of single-cell traces averaged over four colonies (two colonies on 2 d, n = 4). Error bars represent the single-cell variation (SD) in response. (D) Peak amplitude increases with increasing ethanol, whereas the duration of the response remains approximately constant. Error bars represent SD of the average colony peak amplitude or duration.
In previous work, we showed that energy stresses generate a sustained series of stochastic pulses of σB activation (23). Stochastic fluctuations in the levels of RsbQP phosphatase cause sudden increases in σB activation, due to an ultrasensitive switch in the phosphorylation state of RsbV. These increases in active σB are subsequently amplified and then terminated through autoregulatory feedback loops—including production of additional RsbW kinase, to form distinct pulses.
Environmental stresses, including ethanol and salt, are mediated by essentially the same circuit. However, they are first transduced by the stressosome, a large multisubunit complex (28) that activates the RsbTU phosphatase to dephosphorylate RsbV. Here we show that this difference causes a qualitatively different dynamic response compared with energy stress. An increase in environmental stress leads to a single uniform pulse of σB activation, whose amplitude is modulated by the rate at which the stress increases over time. The σB environmental stress response pathway is thus a temporal filter, responding only to rapidly increasing stresses. This filtering function allows the cell to activate σB, and hence a broad set of stress response pathways, when any environmental stress is growing rapidly, while retaining the ability to track more slowly changing levels of salt, ethanol, and other stresses with more specific pathways.
Results
Environmental Stress Induces a Single, Adaptive, Amplitude-Modulated Pulse of σB Activity.
To examine σB dynamics at the single-cell level we used a reporter strain incorporating a yellow fluorescent reporter (yfp) for σB activity (23). To focus on the environmental stress response pathways, and avoid potential cross-talk from the energy stress pathways, we deleted the energy stress phosphatase, rsbQP (26). We also deleted the blue-light sensor, ytvA, to avoid inadvertent activation of σB by microscope illumination (SI Text) (29, 30). We then used quantitative time-lapse microscopy to examine σB activation in individual cells of this strain over time on agarose pads or using the CellASIC microfluidic culturing system (31–33).
We first examined the response of σB to ethanol, a known activator of the environmental pathway (34). A step change in ethanol concentration led to a single pulse of σB activity (Fig. 1B, Fig. S1 A and B), similar to population-level observations reported previously (34). The pulse peaked ∼30 min after the addition of stress before returning to and maintaining near prestress levels (Fig. 1 C and D, Fig. S2 A and B, and Movie S1). We note that the measured pulse duration could be extended by the maturation time of the fluorescent reporter protein. To minimize the impact of this effect, we used a fast-maturing fluorescent YFP protein (maturation time ∼10 min) (35). The pulse was synchronized across the cell population (Fig. S1) and consistent with distributions observed in liquid media conditions (Fig. S1E). Increasing the size of ethanol concentration step led to a corresponding increase in the amplitude of the pulse, with little effect on pulse duration (Fig. 1D). Other environmental stresses such as NaCl (Fig. S2C) and butanol (Fig. S2D) showed similar activation dynamics. Together, these results show that environmental stresses regulate σB by adaptive pulse amplitude modulation (APAM).
Mathematical Modeling Shows That the Stressosome Can Enable Adaptive Pulse Amplitude Modulation.
The dynamic response to environmental stress differed qualitatively from the sustained frequency-modulated stochastic pulsing previously observed in response to energy stress (Fig. S1 C and D) (23). To understand this difference, we adapted the mathematical model previously developed to explain σB energy stress response to the case of environmental stress (Fig. 2A) (23). In that model, fluctuations in the levels of RsbQP phosphatase due to transcriptional noise triggered pulses of σB activity.
Fig. 2.
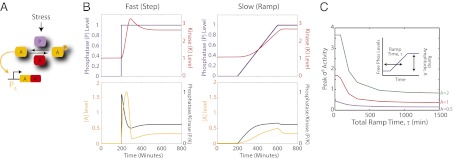
Modeling predicts the σB pathway is rate responsive. (A) Minimal model of σB circuit where the unphosphorylated activator, A, directly activates target genes, including its own operon. The activity of A is controlled by the phosphatase, P, and kinase K. (B) σB activity depends on the rate that free phosphatase is increased. Fast release of phosphatase (Upper Left) results in a pulse of σB activity (Lower Left). Slow release of phosphatase (Upper Right) results in attenuated σB activation (Lower Right). (C) Dependence of σB activation on ramp time, τ, and final ramp amplitude. Purple, red, and green curves correspond to ramp amplitudes of 0.5, 1, and 2, respectively.
The environmental stress pathway contains two regulatory components that are not involved in the response to energy stress (Fig. S3): First, environmental stresses are transduced by a ∼1.8-Mda supramolecular complex, called the stressosome (28). In the unstressed state, the stressosome sequesters RsbT, a required cofactor of the phosphatase RsbU. This cofactor is released upon exposure to stress, leading to dephosphorylation of RsbV and consequent activation of σB (SI Text). Second, an additional negative feedback loop controls phosphatase activity: σB activates expression of RsbX (36), which enables the stressosome to sequester RsbT, reducing σB activation.
To incorporate the stressosome into the model, we assumed that the phosphorylation-based stressosome dynamics were much faster than those of the σB-dependent transcriptional feedback loop, where σB activates its own operon. In this regime, a step in stress leads directly and instantaneously to a corresponding increase in RsbTU phosphatase activity (purple line, Fig. 2B). This activates σB, increasing production of kinase (RsbW, or K in the model) (red line, Fig. 2B, Left). Eventually kinase activity exceeds the higher level of phosphatase activity, shutting the system back off, after producing a single, adaptive pulse (black and yellow lines, Fig. 2B). In contrast to the sustained pulses that occur in the energy stress model, the one-time release of RsbT from the stressosome due to the step in stress results in a single adaptive pulse of σB, as observed experimentally (Fig. 2B). The model also predicts that the pulse amplitude depends on the level of stress applied, which is again in close agreement with experimental results (Fig. S4).
This model predicts that the amplitude of a pulse should depend strongly on the rate at which stress levels increase. This “rate-responsive” property can be analyzed by reducing the speed of phosphatase release in the model. When phosphatase release is sufficiently slow, σB activation of its own operon causes RsbW (K) to accumulate, shutting off σB activity before all of the phosphatase has been released and thereby reducing σB pulse amplitude (Fig. 2B, Right). Thus, different rates of stress increase generate different levels of σB activation (Fig. 2C).
In the model, the RsbX-mediated feedback loop was not required to produce dynamics similar to those observed experimentally. To test this prediction, we constructed a strain (∆FBrbsX) where the endogenous rsbX gene was replaced by an isopropyl β-D-1-thiogalactopyranoside (iptg)-inducible copy (Fig. S5A). When RsbX was induced to levels that produced similar σB activity to that of the reporter strain, the σB pulse dynamics were strikingly similar (Fig. S5 B and C). Thus, the absence of the RsbX feedback loop does not affect the dynamics of environmental σB activation under the conditions tested. However, the RsbX feedback does play other roles: First, it increases the input dynamic range of the system, effectively making the response to ethanol more linear than it would otherwise be (Fig. S6A). Second, it reduces gene expression noise in σB activation (Fig. S6B). Both of these roles are consistent with previous analysis of negative feedback loops (37–39).
To further test this model, we examined a strain expressing an inducible σB operon, but lacking rsbW (40) (Fig S7A). As predicted, this strain exhibited sustained activation of σB (Fig. S7B). In a different strain containing an inducible sigB operon (40), the response to ethanol showed reduced adaptation, suggesting that feedback through rsbW expression is necessary for full adaptation, although other interactions could also contribute, as partial adaptation occurs in the absence of rsbW (Fig. S8). Together, these results show that the simplified σB model is sufficient to reproduce the qualitative difference between energy and environmental stress dynamics.
Environmental Pathway Is Rate Responsive, Enabling Cells to Activate σB Under Fast, but Not Slow, Stress.
To test whether σB activation is indeed rate responsive, we grew our reporter strain in a microfluidic device that allowed precise dynamic modulation of environmental conditions (Materials and Methods). We then compared the σB response to an instant or gradual (ramped) increase from 0 to 2% (vol/vol) ethanol, with ramp times varying from 0 to 400 min (Fig. 3). We found that both the peak and total σB were rate responsive (Fig. 3C and Fig. S9), similar to model predictions. Some differences were noted at longer ramp times. For example, a 400-min ramp resulted in almost no detectable σB activity. Overall, the agreement between model and experiment is remarkable, considering cells have undergone a few cell divisions over the longer ramps times. σB-independent cell cycle effects do not appear to affect rate responsiveness. Moreover, this rate-responsive property was not specific to ethanol, as similar behavior was observed with salt stress (Fig. S10).
Fig. 3.

σB environmental response is rate responsive. (A) Schematic of experiment. Reporter strain was grown in Spizizen’s minimal media (SMM) in a microfludic environment. Ethanol concentration was linearly increased from 0 to 2% (green) or increased in a step (blue). (B) Individual colony promoter activity traces for indicated ramp times. (C) The mean response of all colonies subjected to ramp stress was averaged for each ramp rate. Their peak responses were normalized to the peak promoter activity in the corresponding step increase experiments. For each ramp time, the results of two experiments on different days are indicated (open circles).
What functional role could the rate-responsive activation of σB provide for the cell? We hypothesized that the cell uses σB to provide rate-responsive activation of target genes that should be activated by rapidly increasing environmental stresses of any kind, while using σB-independent regulators to provide rate-independent regulation of genes that are more specific to a particular stress. In this scheme, σB would enable cells to cross-protect under fast, but not slow, stresses. In fact, stress response genes can be classified into distinct groups depending on their response to σB: There are pure σB target operons, σB-independent stress response operons, and mixed target genes that are activated by both σB and another regulator (Fig. 4 and Table S1).
Fig. 4.
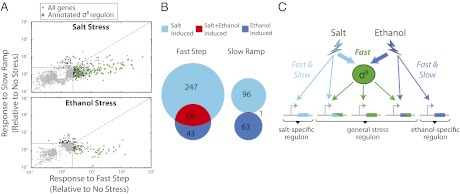
Stress dynamics control response specificity. (A) Cells were exposed to salt (NaCl) (Upper) or ethanol (Lower) under step, 400-min ramp, and no stress conditions. Fold responses of individual genes (dots), relative to no stress, were quantified by RNAseq. Gray indicates less than 2.5-fold induction. Genes below the diagonal line are preferentially activated under fast stress conditions. Nearly all genes activated only under fast stress are part of the σB regulon (green). (B) Venn diagram showing relationship between up-regulated genes under fast (Left) or slow (Right) ethanol or salt stress. (C) Fast stress activates both specific and general stress response pathways (Upper) whereas slow stress more specifically activates individual stress responses.
To test this hypothesis, we examined the stress activation dynamics of OpuE, a mixed stress response gene encoding a transporter. opuE expression is controlled from σB and σA promoters, both of which are activated under salt stress (41). The presence of the σB-independent regulatory pathway should make activation of OpuE under salt stress less rate responsive than a pure σB-dependent target. As predicted, a PopuE-yfp reporter was rate independent, showing similar levels of activation in response to a step or a 400-min ramp from 0 to 0.4 M NaCl (Fig. S11). This contrasted with a pure σB reporter, which was activated more weakly by the ramp than by the step (Fig. S10). Critically, when a different stress (ethanol) that activates only the σB promoter was applied, PopuE-yfp was again rate responsive (Fig. S12). Thus, consistent with the hypothesis, opuE is activated by fast and slow increases in salt stress, but only by fast increases of other stresses.
To test whether this type of rate-dependent cross-regulation occurred more broadly, we analyzed the genome-wide transcriptional response of cells to a step or a 400-min ramp in salt (0–0.36 M NaCl) or ethanol (0–1%). We used RNAseq to analyze the resulting changes in gene expression (Fig. 4A). In both datasets, annotated σB target genes were far more likely to be rate responsive than other genes, and the strongest rate-responsive genes were mainly found among known σB targets (Fig. 4A), consistent with rate-responsive activation of the σB regulon. Genes not categorized as σB target genes, which displayed significant rate responsiveness, were examined in further detail (Table S2). Only one, katX, was heavily up-regulated and rate responsive in both stresses, consistent with previous reports (42), suggesting it may be directly regulated by σB.
Using these data, we tested the hypothesis that fast stress, by inducing σB, leads to greater cross-regulation and that slow stress, by minimizing σB activation, conversely, leads to more specific responses. We identified the subset of genes that were up-regulated in response to each of the four conditions (a step or ramp of ethanol or salt). As expected, steps in stress level produced a much greater overlap in the regulatory response than ramps (Fig. 4B). Furthermore, this overlapping response was highly enriched for σB targets (49 of 64 overlapping genes are σB targets). These results show that the rate-responsive property of σB enables the cell to generate a more similar response to fast stresses, while responding more specifically to the same stresses when applied slowly (Fig. 4C).
Discussion
Several dynamic features of the σB environmental response are notable. First, it shows a clear adaptive response to step increases in stress, with the magnitude of stress controlling the amplitude of the response (Fig. 1). This type of behavior has been seen in other bacterial systems, such as chemotaxis, which are sensitive to changes in their inputs, rather than to absolute levels (43, 44), as well as in mammalian signaling pathways (45, 46). Second, unlike the strikingly heterogeneous response to energy stress, the response to environmental stress is homogeneous across cells (Fig. S1). Third, the system is rate responsive, with faster stresses leading to larger and sharper activation of σB (Fig. 3).
This dynamic behavior can be achieved with a strikingly simple circuit design. A key feature is a transcriptional negative feedback loop based on up-regulation of RsbW by σB, which leads to adaptation in response to increased stress. Other interactions could also contribute to the adaptive behavior observed here (Fig. S8). For example, it was reported that RsbT could become unstable once released from the stressosome, which would prevent the system from maintaining a strong activation level after a step increase in stress (47). Activation of σB requires an element that can transduce the total level of stress rapidly enough to “outrun” this negative feedback loop. The stressosome appears to provide this critical function. Its role as a signaling hub has been discussed previously, but the present work suggests that an important additional role is its ability to rapidly release a strong bolus of phosphatase to activate the system before transcriptional activation of RsbW shuts it off again.
A simple mathematical model of the σB circuit demonstrates that the key features of the σB pathway described above can generate the experimentally observed adaptive pulse response to stress (Fig. 2). The parameters (e.g., transcription rate, phosphorylation rate) used in this model are the same as those used to model the response of the σB circuit to energy stress (23). Thus, our simulations are a prediction of the circuit behavior under environmental stress and not just a fit to the data. This demonstrates how simple “toy” models of gene regulatory networks can make experimentally testable predictions.
As shown above, these dynamic features make the system responsive to the rate at which stress increases and thereby enable the cell to broadly activate diverse stress response pathways in response to a single stress. However, under what circumstances should a cell activate all responses rather than just respond to the particular stress immediately present? Our results suggest that the σB response is overlaid on the more specific stress responses, with a magnitude that increases with the speed at which stress levels increase.
To implement this strategy, the cell must effectively choose a timescale such that stresses faster than this timescale activate the broad response whereas slower ones preferentially activate only the more specific responses. Biologically, this timescale reflects an evolved “expectation” about how far in advance the cell needs to prepare for an upcoming stress. It will be interesting to try to understand what selective forces affect this timescale and whether it varies among stresses and between species.
In fact, it will be particularly interesting to explore the dynamic behavior of general stress response pathways in other species. σB has orthologs in diverse Gram-positive bacteria that may respond to different stresses and with different dynamics. A particularly interesting case is Streptomyces coelicolor, which contains nine distinct σB paralogs, responding to different stresses (48), provoking the question of how this system controls the overall response of the cell to stresses of varying types and speeds. Finally, general stress response pathways in eukaryotes have also been observed to be highly dynamic (4, 49), but their responses to time-varying stress levels have not yet been explored. It will be interesting to see whether the ability to broaden genetic responses to stresses in a rate-responsive way is a conserved function of general stress response pathways.
Materials and Methods
Strains and Growth Conditions.
B. subtilis strains were PB2 derivatives. Most strains included knockouts of rsbQP, the mediator of energy stress, and ytvA, the light-activated stressosome sensor (SI Text). Cells also contained a fluorescent reporter of σB activity. Strains were started from glycerol stocks and grown in Spizizen’s minimal media (50) and prepared for microscopy using agarose pads (31) or analyzed using a Cellasic ONIX microfluidic platform with cells in logarithmic phase growth. For more details regarding the strain construction and growth please refer to SI Text.
Microscopy.
Cells were imaged with a Nikon Ti-E inverted microscope, using an automated time-lapse imaging platform. During ramp experiments, cells were loaded onto a Cellasic bacterial plate (B04A) and exposed to increasing concentrations of stress via the microfluidic system. Fluorescent Images were captured using a CoolSnap HQ2 and analyzed with custom MATLAB software.
RNAseq.
For experiments in Fig. 4, cells were prepared by step or ramped addition of either salt or ethanol. RNA was harvested 15–20 min after the final addition of either stress. Subsequently, a transcriptome library was created using the Epicentre ScriptSeq v2 kit and submitted for sequencing at the California Institute of Technology (Caltech) Sequencing Core Facility. Libraries were sequenced using the Illumina(Solexa) protocol and pipeline, aligned with Maq and Cisgenome, and analyzed using DESEq (51) and MATLAB. For more details, see SI Text.
Supplementary Material
Acknowledgments
We thank C. Price and D. Rudner for providing strains. We thank A. Eldar, R. Kishony, C. Price, N. Wingreen, J. Levine, and other members of M.B.E.'s laboratory for helpful discussions. Work in M.B.E.'s laboratory was supported by NIH Grants R01GM079771 and R01GM086793, US National Science Foundation CAREER Award 0644463, and the Packard Foundation. J.C.W.L. was supported by the International Human Frontier Science Program Organization and the European Molecular Biology Organization.
Footnotes
The authors declare no conflict of interest.
This article is a PNAS Direct Submission.
This article contains supporting information online at www.pnas.org/lookup/suppl/doi:10.1073/pnas.1213060110/-/DCSupplemental.
References
- 1.Shieh SY, Ikeda M, Taya Y, Prives C. DNA damage-induced phosphorylation of p53 alleviates inhibition by MDM2. Cell. 1997;91(3):325–334. doi: 10.1016/s0092-8674(00)80416-x. [DOI] [PubMed] [Google Scholar]
- 2.Maya R, et al. ATM-dependent phosphorylation of Mdm2 on serine 395: Role in p53 activation by DNA damage. Genes Dev. 2001;15(9):1067–1077. doi: 10.1101/gad.886901. [DOI] [PMC free article] [PubMed] [Google Scholar]
- 3.Grönroos E, Terentiev AA, Punga T, Ericsson J. YY1 inhibits the activation of the p53 tumor suppressor in response to genotoxic stress. Proc Natl Acad Sci USA. 2004;101(33):12165–12170. doi: 10.1073/pnas.0402283101. [DOI] [PMC free article] [PubMed] [Google Scholar]
- 4.Purvis JE, et al. p53 dynamics control cell fate. Science. 2012;336(6087):1440–1444. doi: 10.1126/science.1218351. [DOI] [PMC free article] [PubMed] [Google Scholar]
- 5.Hammond EM, Giaccia AJ. The role of p53 in hypoxia-induced apoptosis. Biochem Biophys Res Commun. 2005;331(3):718–725. doi: 10.1016/j.bbrc.2005.03.154. [DOI] [PubMed] [Google Scholar]
- 6.Roe JS, et al. p53 stabilization and transactivation by a von Hippel-Lindau protein. Mol Cell. 2006;22(3):395–405. doi: 10.1016/j.molcel.2006.04.006. [DOI] [PubMed] [Google Scholar]
- 7.el-Deiry WS, et al. WAF1/CIP1 is induced in p53-mediated G1 arrest and apoptosis. Cancer Res. 1994;54(5):1169–1174. [PubMed] [Google Scholar]
- 8.Sjöblom T, Lähdetie J. Expression of p53 in normal and gamma-irradiated rat testis suggests a role for p53 in meiotic recombination and repair. Oncogene. 1996;12(12):2499–2505. [PubMed] [Google Scholar]
- 9.Gatz SA, Wiesmüller L. p53 in recombination and repair. Cell Death Differ. 2006;13(6):1003–1016. doi: 10.1038/sj.cdd.4401903. [DOI] [PubMed] [Google Scholar]
- 10.Oda E, et al. Noxa, a BH3-only member of the Bcl-2 family and candidate mediator of p53-induced apoptosis. Science. 2000;288(5468):1053–1058. doi: 10.1126/science.288.5468.1053. [DOI] [PubMed] [Google Scholar]
- 11.Yu J, Wang Z, Kinzler KW, Vogelstein B, Zhang L. PUMA mediates the apoptotic response to p53 in colorectal cancer cells. Proc Natl Acad Sci USA. 2003;100(4):1931–1936. doi: 10.1073/pnas.2627984100. [DOI] [PMC free article] [PubMed] [Google Scholar]
- 12.Görner W, et al. Acute glucose starvation activates the nuclear localization signal of a stress-specific yeast transcription factor. EMBO J. 2002;21(1–2):135–144. doi: 10.1093/emboj/21.1.135. [DOI] [PMC free article] [PubMed] [Google Scholar]
- 13.Rep M, Krantz M, Thevelein JM, Hohmann S. The transcriptional response of Saccharomyces cerevisiae to osmotic shock. Hot1p and Msn2p/Msn4p are required for the induction of subsets of high osmolarity glycerol pathway-dependent genes. J Biol Chem. 2000;275(12):8290–8300. doi: 10.1074/jbc.275.12.8290. [DOI] [PubMed] [Google Scholar]
- 14.Cai L, Dalal CK, Elowitz MB. Frequency-modulated nuclear localization bursts coordinate gene regulation. Nature. 2008;455(7212):485–490. doi: 10.1038/nature07292. [DOI] [PMC free article] [PubMed] [Google Scholar]
- 15.Schmitt AP, McEntee K. Msn2p, a zinc finger DNA-binding protein, is the transcriptional activator of the multistress response in Saccharomyces cerevisiae. Proc Natl Acad Sci USA. 1996;93(12):5777–5782. doi: 10.1073/pnas.93.12.5777. [DOI] [PMC free article] [PubMed] [Google Scholar]
- 16.Weber H, Polen T, Heuveling J, Wendisch VF, Hengge R. Genome-wide analysis of the general stress response network in Escherichia coli: SigmaS-dependent genes, promoters, and sigma factor selectivity. J Bacteriol. 2005;187(5):1591–1603. doi: 10.1128/JB.187.5.1591-1603.2005. [DOI] [PMC free article] [PubMed] [Google Scholar]
- 17.Hecker M, Pané-Farré J, Völker U. SigB-dependent general stress response in Bacillus subtilis and related gram-positive bacteria. Annu Rev Microbiol. 2007;61:215–236. doi: 10.1146/annurev.micro.61.080706.093445. [DOI] [PubMed] [Google Scholar]
- 18.Mitchell A, et al. Adaptive prediction of environmental changes by microorganisms. Nature. 2009;460(7252):220–224. doi: 10.1038/nature08112. [DOI] [PubMed] [Google Scholar]
- 19.Völker U, Mach H, Schmid R, Hecker M. Stress proteins and cross-protection by heat shock and salt stress in Bacillus subtilis. J Gen Microbiol. 1992;138(10):2125–2135. doi: 10.1099/00221287-138-10-2125. [DOI] [PubMed] [Google Scholar]
- 20.Langsrud S, Sundheim G, Holck AL. Cross-resistance to antibiotics of Escherichia coli adapted to benzalkonium chloride or exposed to stress-inducers. J Appl Microbiol. 2004;96(1):201–208. doi: 10.1046/j.1365-2672.2003.02140.x. [DOI] [PubMed] [Google Scholar]
- 21.Begley M, Gahan CG, Hill C. Bile stress response in Listeria monocytogenes LO28: Adaptation, cross-protection, and identification of genetic loci involved in bile resistance. Appl Environ Microbiol. 2002;68(12):6005–6012. doi: 10.1128/AEM.68.12.6005-6012.2002. [DOI] [PMC free article] [PubMed] [Google Scholar]
- 22.Nannapaneni P, et al. Defining the structure of the general stress regulon of Bacillus subtilis using targeted microarray analysis and random forest classification. Microbiology. 2012;158(Pt 3):696–707. doi: 10.1099/mic.0.055434-0. [DOI] [PubMed] [Google Scholar]
- 23.Locke JC, Young JW, Fontes M, Hernández Jiménez MJ, Elowitz MB. Stochastic pulse regulation in bacterial stress response. Science. 2011;334(6054):366–369. doi: 10.1126/science.1208144. [DOI] [PMC free article] [PubMed] [Google Scholar]
- 24.Voelker U, et al. Separate mechanisms activate sigma B of Bacillus subtilis in response to environmental and metabolic stresses. J Bacteriol. 1995;177(13):3771–3780. doi: 10.1128/jb.177.13.3771-3780.1995. [DOI] [PMC free article] [PubMed] [Google Scholar]
- 25.Benson AK, Haldenwang WG. Bacillus subtilis sigma B is regulated by a binding protein (RsbW) that blocks its association with core RNA polymerase. Proc Natl Acad Sci USA. 1993;90(6):2330–2334. doi: 10.1073/pnas.90.6.2330. [DOI] [PMC free article] [PubMed] [Google Scholar]
- 26.Brody MS, Vijay K, Price CW. Catalytic function of an alpha/beta hydrolase is required for energy stress activation of the sigma(B) transcription factor in Bacillus subtilis. J Bacteriol. 2001;183(21):6422–6428. doi: 10.1128/JB.183.21.6422-6428.2001. [DOI] [PMC free article] [PubMed] [Google Scholar]
- 27.Eymann C, et al. In vivo phosphorylation patterns of key stressosome proteins define a second feedback loop that limits activation of Bacillus subtilis σB. Mol Microbiol. 2011;80(3):798–810. doi: 10.1111/j.1365-2958.2011.07609.x. [DOI] [PMC free article] [PubMed] [Google Scholar]
- 28.Marles-Wright J, et al. Molecular architecture of the “stressosome,” a signal integration and transduction hub. Science. 2008;322(5898):92–96. doi: 10.1126/science.1159572. [DOI] [PubMed] [Google Scholar]
- 29.Avila-Pérez M, Hellingwerf KJ, Kort R. Blue light activates the sigmaB-dependent stress response of Bacillus subtilis via YtvA. J Bacteriol. 2006;188(17):6411–6414. doi: 10.1128/JB.00716-06. [DOI] [PMC free article] [PubMed] [Google Scholar]
- 30.Gaidenko TA, Kim TJ, Weigel AL, Brody MS, Price CW. The blue-light receptor YtvA acts in the environmental stress signaling pathway of Bacillus subtilis. J Bacteriol. 2006;188(17):6387–6395. doi: 10.1128/JB.00691-06. [DOI] [PMC free article] [PubMed] [Google Scholar]
- 31.Young JW, et al. Measuring single-cell gene expression dynamics in bacteria using fluorescence time-lapse microscopy. Nat Protoc. 2012;7(1):80–88. doi: 10.1038/nprot.2011.432. [DOI] [PMC free article] [PubMed] [Google Scholar]
- 32.Locke JC, Elowitz MB. Using movies to analyse gene circuit dynamics in single cells. Nat Rev Microbiol. 2009;7(5):383–392. doi: 10.1038/nrmicro2056. [DOI] [PMC free article] [PubMed] [Google Scholar]
- 33.Spiller DG, Wood CD, Rand DA, White MR. Measurement of single-cell dynamics. Nature. 2010;465(7299):736–745. doi: 10.1038/nature09232. [DOI] [PubMed] [Google Scholar]
- 34.Boylan SA, Redfield AR, Brody MS, Price CW. Stress-induced activation of the sigma B transcription factor of Bacillus subtilis. J Bacteriol. 1993;175(24):7931–7937. doi: 10.1128/jb.175.24.7931-7937.1993. [DOI] [PMC free article] [PubMed] [Google Scholar]
- 35.Nagai T, et al. A variant of yellow fluorescent protein with fast and efficient maturation for cell-biological applications. Nat Biotechnol. 2002;20(1):87–90. doi: 10.1038/nbt0102-87. [DOI] [PubMed] [Google Scholar]
- 36.Voelker U, Dufour A, Haldenwang WG. The Bacillus subtilis rsbU gene product is necessary for RsbX-dependent regulation of sigma B. J Bacteriol. 1995;177(1):114–122. doi: 10.1128/jb.177.1.114-122.1995. [DOI] [PMC free article] [PubMed] [Google Scholar]
- 37.Madar D, Dekel E, Bren A, Alon U. Negative auto-regulation increases the input dynamic-range of the arabinose system of Escherichia coli. BMC Syst Biol. 2011;5:111. doi: 10.1186/1752-0509-5-111. [DOI] [PMC free article] [PubMed] [Google Scholar]
- 38.Nevozhay D, Adams RM, Murphy KF, Josic K, Balázsi G. Negative autoregulation linearizes the dose-response and suppresses the heterogeneity of gene expression. Proc Natl Acad Sci USA. 2009;106(13):5123–5128. doi: 10.1073/pnas.0809901106. [DOI] [PMC free article] [PubMed] [Google Scholar]
- 39.Dublanche Y, Michalodimitrakis K, Kümmerer N, Foglierini M, Serrano L. Noise in transcription negative feedback loops: Simulation and experimental analysis. Mol Syst Biol. 2006;2:41. doi: 10.1038/msb4100081. [DOI] [PMC free article] [PubMed] [Google Scholar]
- 40.Boylan SA, Rutherford A, Thomas SM, Price CW. Activation of Bacillus subtilis transcription factor sigma B by a regulatory pathway responsive to stationary-phase signals. J Bacteriol. 1992;174(11):3695–3706. doi: 10.1128/jb.174.11.3695-3706.1992. [DOI] [PMC free article] [PubMed] [Google Scholar]
- 41.Spiegelhalter F, Bremer E. Osmoregulation of the opuE proline transport gene from Bacillus subtilis: Contributions of the sigma A- and sigma B-dependent stress-responsive promoters. Mol Microbiol. 1998;29(1):285–296. doi: 10.1046/j.1365-2958.1998.00929.x. [DOI] [PubMed] [Google Scholar]
- 42.Petersohn A, Engelmann S, Setlow P, Hecker M. The katX gene of Bacillus subtilis is under dual control of sigmaB and sigmaF. Mol Gen Genet. 1999;262(1):173–179. doi: 10.1007/s004380051072. [DOI] [PubMed] [Google Scholar]
- 43.Block SM, Segall JE, Berg HC. Impulse responses in bacterial chemotaxis. Cell. 1982;31(1):215–226. doi: 10.1016/0092-8674(82)90421-4. [DOI] [PubMed] [Google Scholar]
- 44.Alon U, Surette MG, Barkai N, Leibler S. Robustness in bacterial chemotaxis. Nature. 1999;397(6715):168–171. doi: 10.1038/16483. [DOI] [PubMed] [Google Scholar]
- 45.Cohen-Saidon C, Cohen AA, Sigal A, Liron Y, Alon U. Dynamics and variability of ERK2 response to EGF in individual living cells. Mol Cell. 2009;36(5):885–893. doi: 10.1016/j.molcel.2009.11.025. [DOI] [PubMed] [Google Scholar]
- 46.Goentoro L, Kirschner MW. Evidence that fold-change, and not absolute level, of beta-catenin dictates Wnt signaling. Mol Cell. 2009;36(5):872–884. doi: 10.1016/j.molcel.2009.11.017. [DOI] [PMC free article] [PubMed] [Google Scholar]
- 47.Reeves A, Martinez L, Haldenwang W. Expression of, and in vivo stressosome formation by, single members of the RsbR protein family in Bacillus subtilis. Microbiology. 2010;156(Pt 4):990–998. doi: 10.1099/mic.0.036095-0. [DOI] [PubMed] [Google Scholar]
- 48.Viollier PH, et al. Specialized osmotic stress response systems involve multiple SigB-like sigma factors in Streptomyces coelicolor. Mol Microbiol. 2003;47(3):699–714. doi: 10.1046/j.1365-2958.2003.03302.x. [DOI] [PubMed] [Google Scholar]
- 49.Ashall L, et al. Pulsatile stimulation determines timing and specificity of NF-kappaB-dependent transcription. Science. 2009;324(5924):242–246. doi: 10.1126/science.1164860. [DOI] [PMC free article] [PubMed] [Google Scholar]
- 50.Spizizen J. Transformation of biochemically deficient strains of Bacillus subtilis by deoxyribonucleate. Proc Natl Acad Sci USA. 1958;44(10):1072–1078. doi: 10.1073/pnas.44.10.1072. [DOI] [PMC free article] [PubMed] [Google Scholar]
- 51.Anders S, Huber W. Differential expression analysis for sequence count data. Genome Biol. 2010;11(10):R106. doi: 10.1186/gb-2010-11-10-r106. [DOI] [PMC free article] [PubMed] [Google Scholar]
Associated Data
This section collects any data citations, data availability statements, or supplementary materials included in this article.