

Abstract
The nonstructural 5A (NS5A) protein is a target for drug development against hepatitis C virus (HCV). Interestingly, the NS5A inhibitor daclatasvir (BMS-790052) caused a decrease in serum HCV RNA levels by about two orders of magnitude within 6 h of administration. However, NS5A has no known enzymatic functions, making it difficult to understand daclatasvir’s mode of action (MOA) and to estimate its antiviral effectiveness. Modeling viral kinetics during therapy has provided important insights into the MOA and effectiveness of a variety of anti-HCV agents. Here, we show that understanding the effects of daclatasvir in vivo requires a multiscale model that incorporates drug effects on the HCV intracellular lifecycle, and we validated this approach with in vitro HCV infection experiments. The model predicts that daclatasvir efficiently blocks two distinct stages of the viral lifecycle, namely viral RNA synthesis and virion assembly/secretion with mean effectiveness of 99% and 99.8%, respectively, and yields a more precise estimate of the serum HCV half-life, 45 min, i.e., around four times shorter than previous estimates. Intracellular HCV RNA in HCV-infected cells treated with daclatasvir and the HCV polymerase inhibitor NM107 showed a similar pattern of decline. However, daclatasvir treatment led to an immediate and rapid decline of extracellular HCV titers compared to a delayed (6–9 h) and slower decline with NM107, confirming an effect of daclatasvir on both viral replication and assembly/secretion. The multiscale modeling approach, validated with in vitro kinetic experiments, brings a unique conceptual framework for understanding the mechanism of action of a variety of agents in development for the treatment of HCV.
Keywords: direct-acting antiviral agents, mathematical modeling, viral dynamics
Hepatitis C virus (HCV) infection is a major health burden affecting about 150 million people worldwide (1) and ∼4.1 million in the United States (2), where it is the primary cause of liver cirrhosis and liver cancer (1). Until 2011, the most advanced antiviral therapy was pegylated interferon-α (IFN-α) plus ribavirin (Peg-IFN/RBV), with a cure rate of 50% or less in patients infected with HCV genotype 1, the most prevalent in the Western world.
To obtain higher cure rates, drug development has focused mainly on inhibiting the function of nonstructural (NS) viral proteins with known enzymatic functions, such as the NS3-4A protease and the NS5B polymerase. Through the use of an innovative screening approach to search for nonenzymatic targets, daclatasvir (BMS-790052) was identified as a potent NS5A inhibitor (3). The functions of the NS5A protein are not fully elucidated, although in vitro studies suggest an essential role of NS5A in both viral replication (4–7) and assembly/release of infectious particles (8–11). The efficacy of daclatasvir as an antiviral agent was confirmed in a single ascending-dose study in which a mean 3.3-log10 reduction in viral load 24 h after drug administration was observed in patients receiving a 100-mg dose (3). More remarkably, 6 h after dosing, a mean 1.95-log10 viral load decline occurred. This decline is faster than has been observed with any other antiviral agent studied to date. Our goal is to uncover the biological basis of this extremely rapid viral decline and the in vivo mechanism of action (MOA) of daclatasvir through mathematical modeling.
Mathematical modeling of HCV infection and treatment has provided valuable insights into the mechanisms of action of IFN-based therapy (12). In these models, the infected cell is treated as a “black box” that produces/secretes virus particles, which then either are cleared or infect new target cells. Using this type of model, it was shown that IFN acts mainly to reduce the average rate of virion production/release per infected cell (12). As a consequence, the early viral decline in serum HCV RNA after treatment initiation was assumed to reflect the clearance of viral particles, which in the model occurs at rate c per virion. By fitting the HCV RNA decline during administration of high daily doses of IFN, Neumann et al. (12) estimated c in HCV genotype 1–infected patients as 6.2 ± 1.8 d−1, corresponding to a serum half-life (t½) of 2.7 h. At this rate of virion clearance, it would take at least 17 h to achieve 1.95 log10 viral load reduction, not the 6 h observed.
Here, we analyze the early viral decay observed after one dose of 10 or 100 mg of daclatasvir (3). Using the standard model of HCV dynamics (12) or simple linear regression, we estimate the HCV t½ to be about 0.7 h, i.e., 45 min. To explain the discrepancy with the prior t½ estimate of 2.7 h during IFN treatment, we introduce a multiscale model of HCV viral dynamics that includes the effects of treatment on distinct intracellular processes of viral RNA production and virion assembly/secretion. We show that this model provides a conceptual framework for the origin of viral decline patterns. Further, the multiscale model fits data on viral declines in patients on IFN, daclatasvir, and the HCV protease inhibitor telaprevir (TVR) and allows us to decipher the mode of action of these drugs and estimate their in vivo antiviral effectiveness in blocking intracellular viral RNA production and in blocking virion assembly/secretion. This approach also shows why clearance rates derived from previous IFN-based studies are underestimates, and therefore it reconciles the two contradictory estimates of c and estimates the mean HCV t½ as 45 min.
Results
Empirical Analysis of the Early Viral Decline.
All nine patients treated with 10 or 100 mg of daclatasvir had a profound and rapid HCV RNA decline from baseline, with mean amplitudes of 0.27, 1.20, and 1.95 log10 international units (IU)/mL at 2, 4, and 6 h post dosing, respectively (Fig. S1). This translates into a mean rate of viral decline between 1 and 6 h of 23.2 d−1, assuming the decline begins 1 h post dosing because of a pharmacological delay.
Analysis of Early Viral Kinetics Using the Standard Model of HCV Infection.
In the five patients (Table 1) who did not have a viral load rebound over the first 3 d, the standard biphasic viral decline model introduced by Neumann et al. (12) (Eq. 1) was fit to the data and well characterized the changes in HCV RNA (Fig. 1A). The mean antiviral effectiveness in blocking viral production/secretion, ɛ, was estimated as 0.997 (Table 1), and the mean rate of viral clearance, c, was estimated as 23.3 d−1, similar to the empirical rate of viral decline estimated above. In addition, we observed a second phase of viral decline that allowed us to estimate the loss rate of infected cells, δ (mean 1.06 d−1) (Table 1). Interestingly, although c and δ represent physiological quantities and therefore should not depend upon the antiviral strategy, these mean values are about four and seven times higher, respectively, than what was estimated previously in patients receiving IFN-based therapy (12, 13).
Table 1.
Parameter estimates obtained using the standard biphasic model (Eq. 1) to fit viral kinetic data from patients treated with daclatasvir
| Patient | Daclatasvir dose (mg) | Age (y) | Sex | Race | BMI (kg/m2) | Genotype | V0(log10IU/mL) | t0 (h) | c (d−1) | ɛ | δ (d−1) |
| 8 | 100 | 45 | F | AA | 33 | 1b | 5.64 | 1.42 | 31.3 | 0.996 | 1.89 |
| 42 | 10 | 47 | F | Caucasian | 25 | 1b | 5.65 | 2.4 | 21.0 | 0.998 | 0.39 |
| 68 | 100 | 32 | F | Caucasian | 30 | 1b | 7.15 | 1.63 | 20.2 | 0.998 | 1.27 |
| 69 | 100 | 44 | F | AA | 26 | 1a | 6.14 | 0.91 | 22.0 | 0.999 | 0.75 |
| 83 | 100 | 44 | F | AA | 31 | 1b | 5.45 | 2.21 | 21.8 | 0.996 | 1.01 |
| Mean | 6.00 | 1.71 | 23.3 | 0.997 | 1.06 |
Individual viral kinetic parameter estimates made assuming constant antiviral effectiveness of daclatasvir until day 2 in the five patients (Fig. 1) who did not show a viral rebound until day 3. AA, African American; BMI, body mass index; c, serum HCV RNA clearance rate; δ, loss rate of infected cells; ɛ, effectiveness in blocking virion production/release; F, female; t0, pharmacological delay.
Fig. 1.
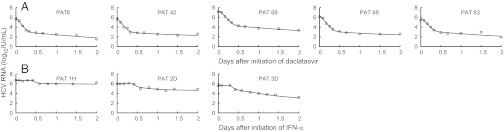
Viral kinetics and model predictions. Viral load data (○) and standard and multiscale models’ predictions (solid line) for (A) five patients receiving one dose (four received 100 mg and one, Pt42, received 10 mg) of daclatasvir (BMS-790052) and (B) three representative patients receiving daily IFN-α of 5 MIU (Left), 10 MIU (Center), and 15 MIU (Right). Although interpretations are different, the model curves of the standard model (Eq. 1) and of the multiscale model (Eq. 3) overlap and cannot be distinguished.
Analysis of Early Viral Kinetics Using a Multiscale Model.
To resolve the discrepancy in the estimates of c and δ obtained when fitting viral load data during IFN-based therapy and daclatasvir therapy, we developed an HCV dynamic model that extends the standard model (Fig. 2A) by incorporating essential features of the viral lifecycle that may be targeted by daclatasvir. In this model, viral RNA (vRNA) is produced within infected cells at constant rate α, degraded with constant rate μ, and exported as virions into the circulation at rate ρ per vRNA (Fig. 2B). Moreover, the amount of vRNA per infected cell depends on the time elapsed since cell infection, which we call a, the age of an infected cell. Unlike the standard model that does not distinguish between vRNA production and virion secretion, this model allows us to distinguish three possible intracellular effects of antiviral therapy: blocking vRNA production with effectiveness ɛα, blocking vRNA packaging/secretion with effectiveness ɛs, and enhancing the vRNA degradation rate μ by a factor κ ≥ 1.
Fig. 2.

Standard and multiscale models of HCV infection. (A) The standard model (12) considers only the level of cell infection and virus in serum. Treatment acts by reducing the average number of virions produced by infected cells from p to p(1 − ɛ). Thus, ɛ represents a global measure of antiviral effectiveness that does not distinguish the stages of intracellular viral replication that are blocked by treatment. (B) The multiscale model was designed to account for essential features of intracellular HCV RNA (vRNA) replication, R, i.e., production, degradation, and assembly/secretion with rate parameters α, μ, and ρ, respectively. The vRNA level within an infected cell (dashed circle) is assumed to increase with time since infection and reach a steady state. Treatment (parameters in red) may block vRNA production with effectiveness ɛα and/or virion assembly/secretion with effectiveness ɛs, and/or enhance the degradation rate of vRNA by a factor κ. In both models, T and I represent target and infected cells, respectively, and V represents virus. Target cells are created and die with constant rates s and d, respectively, and are infected by virus, V, with rate constant β. Infected cells, I, are lost with rate constant δ, and virus, V, is cleared from serum with rate constant c.
Because the multiscale model contains several unknown parameters, several assumptions are necessary to make parameter identification possible when only short-term serum HCV RNA data are available. First, we assumed that the parameters c and δ do not depend on the type of treatment administered. Because we were interested in understanding the differences in the initial viral decay observed with daclatasvir vs. IFN-based therapies, we included in our analysis 20 patients who received different doses of daily IFN, and had frequent viral load measurements (12). Second, an approximate analytical solution of the multiscale model (Eq. 3) may be obtained if one assumes that no new cell infections occur after treatment initiation. We found that the approximate solution (Eq. 3) and the numerical solution of the full model (Eq. 2) agreed well in the parameter regime of interest (Fig. S2). Viral load data were analyzed using Eq. 3 only until day 2, as only a single dose of daclatasvir was given. On such a short time scale, the loss rate of infected cells cannot be identified, and we fixed δ = 0.14 d−1, the mean estimated in patients treated with Peg-IFN/RBV (12–14). Third, the effectiveness in enhancing the loss rate of vRNA, κ, could not be estimated separately from the intrinsic vRNA degradation rate, μ. Thus, we fixed μ = 1 d−1 and, in essence, estimated the combined parameter κμ. (If we fixed μ = 2 d−1, then the estimate of κ decreased by 50%, whereas if we set μ = 0.5 d−1, the estimate of κ doubled.) Further, the distribution of κμ in the population could not be estimated, and hence we assumed that this parameter was similar for all patients in our study. Lastly, we fixed the rate of vRNA production per infected cell, α, to 40 vRNA d−1 (15). A sensitivity analysis verified that our choices for α and δ did not substantially influence our estimates of the viral clearance rate, c, or of ɛs and ɛα (Table S1).
To increase the precision of the parameter estimates, a nonlinear mixed-effects model was used to fit the data. The parameters were estimated by maximum likelihood estimation using the extended stochastic approximation expectation-maximization algorithm as implemented in the MONOLIX software (www.lixoft.com) (SI Methods). The model fit the individual data well (Fig. 1). The mean pharmacological delay, t0, until treatment influences viral load was significantly shorter with daclatasvir than with IFN (0.97 h vs. 10.0 h, P < 10−10), which was expected because daclatasvir, unlike IFN, is a direct antiviral. Consistent with the prediction of the standard model (12), the effectiveness in blocking vRNA production, ɛα, was significantly associated with the dose of IFN received, with mean values of 0.96 and 0.77 in the 10– or 15–million international unit (MIU) and 5-MIU dosing groups, respectively (P = 0.0014). Daclatasvir showed an even higher level of effectiveness in blocking vRNA production [mean effectiveness = 0.990, CI95% (0.98, 1.0)]. Unlike IFN, daclatasvir also efficiently blocked the secretion of virus (mean ɛs in daclatasvir-treated patients = 0.998 vs. 0.39 in IFN-treated patients, P < 10−10), with no significant difference between IFN doses. Using the multiscale model, all patients regardless of antiviral strategy could be fitted assuming a high rate of viral clearance, estimated as c = 22.3 d−1 [CI95% (18.7, 25.7)] (Table 2). This clearance rate corresponds to a virion half-life t½ = 45 min. Lastly, the degradation rate of vRNA under treatment, κµ, was estimated as 1.46 d−1 [CI95% (0.74, 2.18)], corresponding to a mean vRNA t½ = 11.3 h.
Table 2.
Population parameter estimates obtained using the approximate solution (Eq. 3) of the multiscale model
| Parameter | Estimate | Standard Error |
| ɛα | ||
| IFN | ||
| 5 MIU | 0.77 | 0.087 |
| 10/15 MIU* | 0.96 | 0.011 |
| Daclatasvir | 0.99 | 0.011 |
| ɛs | ||
| IFN, 5/10/15 MIU† | 0.39 | 0.018 |
| Daclatasvir | 0.998 | 0.00017 |
| t0 (h) | ||
| IFN, 5/10/15 MIU† | 10.0 | 2.88 |
| Daclatasvir | 0.97 | 0.38 |
| ρ (d−1) | 8.18 | 1.8 |
| c (d−1) | 22.3 | 1.7 |
| κμ (d−1) | 1.46 | 0.36 |
c, serum HCV RNA clearance rate; ɛα, drug effectiveness in blocking intracellular HCV RNA (vRNA) synthesis; ɛs, drug effectiveness in blocking virion assembly/secretion; κμ, degradation rate of vRNA during treatment; ρ, export rate of vRNA into virions; t0, pharmcological delay.
*The patients treated with 10- and 15-MIU doses of IFN were analyzed together because previous analysis (12) showed no difference in effectiveness.
†t0 and ɛs were found not to differ among the IFN dosing groups.
Using the approximate solution, Eq. 3, the multiscale model predicts that after a delay t0, the viral load, V(t), decays in a triphasic manner (Fig. 3), given by V(t)=V0[Ae−ct + Be−λt + Ce−δt]. These successive phases of decline represent the drug’s ability to affect different stages of the viral lifecycle: (i) By blocking virion assembly/secretion, there is a deficit in virion production, and virions naturally eliminated with rate c are not replaced. (ii) By blocking its production and/or increasing its rate of loss intracellularly or by infected cell death, vRNA levels decrease with rate λ, which limits the material available for producing new virions. (iii) The remaining virus production ultimately declines with rate δ, reflecting the progressive elimination of infected cells over time.
Fig. 3.

Patterns of viral decline predicted by the multiscale model. Viral load decline from baseline in a patient treated with daclatasvir (Pt 8, black ○) compared with the decline seen in a patient treated with 10 MIU IFN (Pt 2C, blue ○) at early (A) and late (B) times, and the corresponding best-fit model prediction (solid lines) using the multiscale model (Eq. 3 and Table S3). When treatment efficiently blocks both vRNA production, with effectiveness ɛα, and virion assembly/secretion, with effectiveness ɛs, as estimated for daclatasvir (Table 2), the multiscale model predicts two phases of viral decline in the first 2 d of treatment (A, black line). The first phase is the result of HCV clearance in serum, with rate c. The second phase reflects vRNA decline with rate λ = κμ + ρ(1 − ɛs) + δ ∼ κμ + δ, as ɛs ∼ 1 (Table S3). When treatment does not efficiently block virion assembly/secretion, as predicted with IFN (Table 2), the first early phase is not visible and only the second early phase of viral decline is observed (A, blue line). After day 3, assuming that the treatment is effective in blocking vRNA production and regardless of the effectiveness in blocking secretion, the long-term viral decline is driven by the loss rate of infected cells, with rate δ (B).
In this model, A, B, and C are constants that depend on model parameters; thus, the duration of these phases depends on the drug’s mode of action. For daclatasvir, A is 500-fold larger than B and we calculate that for the initial 8 h, the first term reflecting virion clearance is larger than the second term and a first phase decay with a slope reflecting the virion clearance rate c is apparent (Fig. 3A, black line). For IFN, A is smaller than B and the phase representing virion clearance now is too short to be observed in the clinical data, and only a single phase of HCV RNA decay with rate λ is seen during the first 2 d of therapy (Fig. 3A, blue line). This phase reflects the decay of vRNA and infected cells and not virion clearance as incorrectly concluded in prior work (12). At longer times, approximately day 3 with either IFN or daclatasvir (Fig. 3B), the last phase of decay driven by infected cell loss is predicted to be observed.
If high clearance rate estimates are indicative of drug therapies that block viral assembly/secretion, one may ask whether other direct-acting antiviral agents also have this property. Interestingly, for the protease inhibitor TVR, using the standard model, a mean c = 12.1 d−1 was reported for all TVR doses and c = 16.7 d−1 for nine patients from our recent publication (16) treated with the highest dosage of 1,250 mg twice daily (BID), values two- to threefold greater than for IFN, with no explanation. To test whether this might be the result of TVR having an effect on virion assembly/secretion, we added the nine patients treated with 1,250 mg BID TVR monotherapy as an additional group in our population analysis. All data could be well fit with the multiscale model (Fig. S3), and a high value of c = 22.7 d−1 was found (Table S2). TVR also was found to have an effect in blocking assembly/secretion (mean ɛs = 0.94); however, this effect was significantly weaker than for daclatasvir (P < 10−6). Comparing (1 − ɛs) for TVR (0.06) with that of daclatasvir (0.002) reveals that daclatasvir reduces assembly/secretion 30-fold more than TVR. Our prediction that TVR has an effect on assembly/secretion in vivo is consistent with in vitro findings (17) that the NS3 protease domain is important in late steps in the viral lifecycle that involve intracellular assembly of virus.
Whereas the multiscale model prediction that daclatasvir inhibits both HCV replication and HCV assembly/secretion in vivo is consistent with published data indicating that NS5A plays a role in both these viral processes (4–11), we confirmed these effects in cell culture HCV infection experiments in which both intracellular and extracellular viral parameters can be measured in parallel (SI Methods). Specifically, we found that treatment of infected cells with daclatasvir resulted in an intracellular HCV RNA decline comparable with that observed when infected cells were treated with the polymerase inhibitor NM107, consistent with both drugs blocking HCV replication (Fig. 4). As expected, for a replication inhibitor, extracellular virus titers in NM107-treated cultures declined in parallel with intracellular RNA levels. However, daclatasvir treatment resulted in an immediate and more rapid decrease in extracellular HCV titers that preceded the drop in intracellular HCV RNA, consistent with some aspect of HCV assembly/secretion being inhibited independently of the effects on HCV replication.
Fig. 4.

Intracellular and extracellular HCV kinetics during treatment in cell culture. (A) RTqPCR analysis of intracellular HCV RNA levels in Huh7 cultures at the indicated times during mock treatment (black), 1 nM daclatasvir treatment (red), or treatment with 25 μM of the HCV NS5B polymerase inhibitor NM107 (blue). A delay of 6–9 h before HCV RNA declined from mock was observed with daclatasvir and NM107. Thereafter, intracellular HCV RNA declined at a similar rate with both daclatasvir and NM107. (B) Extracellular HCV titer (focus-forming units per milliliter) determined at the indicated times during treatment with 1 nM daclatasvir (red dashed line) or 25 μM NM107 (blue dashed line) compared with mock-treated cultures (black dashed line). Under NM107 treatment, HCV titer declined at the same rate as intracellular HCV RNA, whereas daclatasvir treatment resulted in a rapid and immediate decline in HCV titer. Data are representative of three independent experiments.
Discussion
NS5A is an HCV-encoded nonstructural protein that has become a promising target for anti-HCV therapy (3, 18). In a phase IIa study, 4 of 11 patients who received the NS5A inhibitor daclatasvir and the protease inhibitor asunaprevir for 24 wk had a sustained virologic response at 12 and 24 wk after treatment ended, establishing that HCV may be cured by an all-oral treatment regime that lacks IFN/RBV (18).
NS5A is a phosphoprotein that may exist in multiple phosphorylated states (11, 19). Possibly because of this, it appears to have multiple functions in the virus lifecycle, likely mediated by its ability to bind HCV RNA (20) and to interact with several virus and host proteins (21). Given the uncertain nature of the molecular mechanisms by which NS5A functions and the absence of direct screening assays for NS5A function, it is not surprising that the MOA of NS5A inhibitors is uncertain (22). One means of uncovering an antiviral agent’s MOA is to analyze the kinetics of the response it generates.
Here, we have shown that after in vivo administration of the NS5A inhibitor daclatasvir, HCV RNA declines with extreme rapidity, falling appoximately 2 logs within the first 6 h post dosing, followed by a slower phase of decline. Using a multiscale model, we have shown that this kinetic pattern would arise if and only if daclatasvir effectively blocks both intracellular viral HCV RNA (vRNA) synthesis and virion assembly/secretion in vivo. If daclatasvir blocked only vRNA synthesis, the kinetics of viral decline would be similar to that seen with IFN and the first phase would not be as rapid as observed (Fig. S4). Alternatively, if daclatasvir blocked only virion assembly/secretion, then one would see only a rapid first phase followed by a flat second phase, differing from the second phase that was observed, and which cannot fit the data (Fig. S5). It is only when we assume that daclatasvir blocks both vRNA synthesis and virion assembly/secretion that we match the data (Fig. 1). Although this finding is consistent with a large body of data obtained in vitro showing that NS5A is essential for both viral replication (4–7) and the assembly and release of infectious particles (8–11), we confirmed the modeling predictions by assessing the effect of daclatasvir on HCV infection in vitro, where both intracellular and extracellular HCV can be measured simultaneously (Fig. 4). Although daclatasvir treatment reduced intracellular HCV RNA with the same kinetics as the HCV polymerase inhibitor NM107—suggesting that at the doses used, both drugs block HCV replication to a similar degree—a more rapid extracellular decline in HCV was observed in response to daclatasvir, consistent with an additional block in assembly/secretion of infectious viral particles. In addition, an early transient increase in intracellular HCV RNA levels was observed in multiple experiments. Although this increase was not statistically significant, it suggests that blocking assembly/secretion may result in a transient accumulation of intracellular HCV RNA.
If daclatasvir blocks virion assembly/secretion, the viral decline after dosing should provide a more precise estimate of the HCV t½ than the one observed with other anti-HCV compounds. Indeed, when virus secretion is not blocked efficiently, there is a continued release of new virus particles; thus, the observed rate of decay after treatment initiation provides only a minimal estimate of the true virion half-life. We now estimate, both from fitting our model to the data and by empirically measuring the rate of HCV decline, that the HCV t½ is ∼45 min, i.e., around four times shorter than the previous estimate of 2.7 h. This implies that to maintain viral levels at steady state, viral production must be four times larger than previously estimated (12); hence, there is more opportunity for viral mutation than previously appreciated. Lastly, our t½ estimate for HCV is similar to the estimated 56-min t½ of HIV (23) and may imply that both viruses are cleared by similar mechanisms.
An off-target effect of daclatasvir in enhancing HCV clearance also might account for our estimate of the HCV half-life. However, if daclatasvir’s only MOA was to enhance viral clearance by fourfold, then HCV RNA would rapidly decline fourfold, i.e., 0.6 log10 during therapy (Fig. S6) and not the 2–3 logs observed. To obtain the observed kinetics, daclatasvir still would also need to block virion assembly/secretion and vRNA replication. Also, a similar 45-min estimate of the virion half-life was made by Powers et al. (24), in the absence of daclatasvir, by analyzing the kinetics of viral decline in six patients during the anhepatic and early reperfusion stages after liver transplantation, when no or little new virus is being made.
Interestingly, Ramratnam et al. (23), using large-volume apheresis to artificially increase virion clearance, estimated the HCV t½ in two HCV/HIV-coinfected patients as 1.67 h and 3 h, which suggests that if our current estimate of a 45-min t½ is accurate, HCV clearance might be impaired in coinfected patients.
Although the viral decline observed during the first 2 d post dosing was biphasic, the second-phase viral decline with daclatasvir is not the persistent second-phase viral decline predicted by the standard biphasic model but rather represents a transient phase that mainly reflects the drug’s ability to reduce vRNA levels by blocking vRNA production and/or by increasing its degradation rate by a factor κ. Although the magnitude of κ could not be estimated, the model predicts that the vRNA t½ during daclatasvir therapy [ln(2)/κµ] in vivo is about 11 h. Recently, we showed that in replicon cells treated with NM107, the t½ of genotype 1b subgenomic HCV RNA was 17 h (25). A similar estimate was found in replicon cells treated with 100 U/mL of IFN in one study (26) but was 12 h in another study (27). The fact that the in vitro and in vivo estimates of t½ differ by a factor of 1.1–1.5 suggests that the effect of daclatasvir on enhancing vRNA degradation, if existent, likely is modest.
The multiscale model shows that the first phase of viral decline reflecting HCV serum clearance is visible only if a drug efficiently blocks viral secretion. We have shown for IFN that the first phase should not be apparent in clinical data, and what we previously thought was the first phase may in fact be the new intermediate phase we identified in the daclatasvir data analysis. This is the explanation for why earlier analyses of viral decay in patients treated with IFN led to inaccurate estimates of the viral clearance rate. For TVR, in which we predict the drug inhibits assembly/secretion, a similar analysis shows that a short first phase with c = 22.7 d−1 should be apparent before transitioning into the new immediate phase.
The multiscale model most likely is valid only for short periods after the initiation of antiviral therapy. Its use for longer periods probably will require one to include the possibility that under potent therapy, the rates of vRNA production, α(1 − ɛα), and degradation, κμ, are not constant. One can easily imagine that under potent therapy, the replication complexes, which are responsible for vRNA production, will decrease in number, effectively lowering α. Also, vRNA in different cellular compartments, e.g., cytoplasm and membranous web (28), may degrade at different rates; thus, once vRNA in one compartment is mostly depleted, the vRNA degradation rate, κμ, may change. Lastly, our model solution assumes that the drug effectivenesses, ɛs, ɛα, and κ, are all constant. Thus, Eq. 3 would need to be modified in cases in which drug effectivenesses change with time, such as for the HCV polymerase inhibitor mericitabine (29).
In summary, we have developed a multiscale model of HCV infection and treatment in vivo that includes both intracellular and serum HCV RNA dynamics. The model provides a conceptual framework to explain the observed decline of serum HCV during therapy. Because the model considers several different steps in the HCV lifecyle, it provides a promising tool for selecting agents with complementary modes of action to maximize cure rates. When applied to the HCV kinetics observed in patients during daily IFN therapy, during protease inhibitor therapy, or after a single dose of daclatasvir, several insights into the mechanisms of action of these drugs were obtained. In particular, the multiscale model confirms that IFN mainly slows intracellular HCV RNA replication/synthesis, but suggests it also may have a small effect on virion assembly/secretion. Thus, it is plausible that during the first phase of viral decline, there is continued packing and release of the vRNA that was present in the cell before IFN administration, which masks the intrinsic plasma HCV clearance rate. Further, our results suggest that both daclatasvir and TVR block virion assembly/secretion, with mean effectivenesses in vivo equal to 99.8% and 94%, respectively (Table S2), with TVR being significantly less effective (P < 10−6). Lastly, we now estimate the mean half-life of HCV RNA in serum to be about 45 min. This estimate is around four times shorter than previous estimates made by modeling the HCV RNA decline following initiation of IFN-based therapy (12, 13) but is consistent with some estimates of viral decline rates observed during the anhepatic and early reperfusion phases in subjects who underwent liver transplantation (24, 30).
Methods
Standard model of viral dynamics.
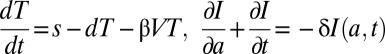
The standard model of HCV dynamics predicts that viral decline is governed by the following set of differential equations:
 |
where T represents the density of target cells, which are created with constant rate s, die with constant rate d, and are infected by virus, V, with rate constant β. In the model, infected cells, I, are lost with rate constant δ and produce virions at constant rate p per cell (Fig. 2A). Virions are assumed to be cleared from serum with rate constant c. Because we focus on short-term kinetics, we assumed that the target cell level is constant throughout the study period and remains at its pretreatment steady-state value T0 = cδ/pβ (12). After an initial pharmacologic delay of length t0, therapy is assumed to reduce the rate of viral production per cell from p to p(1 − ɛ), where ɛ is the drug effectiveness.
Multiscale model of viral dynamics.
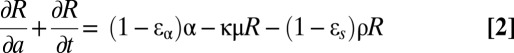
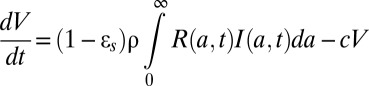
We denote by R(a) the concentration of intracellular vRNA in a cell that has been infected for time a. In the absence of treatment, R(a) may be described by  , where α represents the rate of vRNA production, μ is the (intracellular) rate of vRNA degradation, and ρ is the export rate of vRNA in virions. Treatment may act by blocking intracellular viral production with effectiveness ɛα, by blocking virion assembly and/or secretion with effectiveness ɛs, and by increasing the degradation rate of vRNA by a factor κ, so that the full model combining intracellular and extracellular dynamics is
 |
 |
 |
with boundary conditions I(0,t) = βVT, I(a,0) = I0(a), R(0,t) = 1, R(a,0) = R0(a), where I0(a) and R0(a) are the pretherapy steady-state distributions. We have assumed that treatment begins at time t = 0 and that cells, when initially infected, contain one vRNA.
Because the amount of intracellular vRNA depends on both the length of time a cell has been infected and the length of treatment, a partial differential equation is needed to describe intracellular vRNA kinetics. We previously showed that a drug blocking entry leads to very slow viral decays and when included with effects such as blocking replication that give rise to rapid declines, this effect cannot be discerned (12). Thus, we have not included a potential effect of daclatasvir on reducing β and, hence, cannot determine whether daclatasvir also has an effect on viral entry.
Fig. 2B gives a schematic representation of this model. If one assumes that treatment is potent enough that the number of new cell infections is negligible after treatment initiation, i.e., I(a,t) = 0 for a < t, this model can be solved using the method of characteristics, yielding
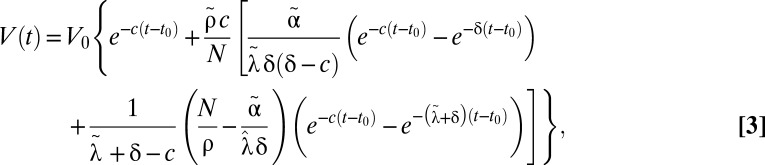 |
where we have incorporated a pharmacologic delay of length t0 before the viral load decline begins,  ,
,  , and
, and  .
.
Data.
IFN-α2b treatment in vivo.
To compare the kinetics observed with daclatasvir to that observed with IFN-based therapy, we considered 24 treatment-naïve patients infected with HCV genotype 1 randomly assigned to receive daily s.c. injections of 5, 10, or 15 MIU) of IFN-α2b (12). As done in ref. 12, the four nonresponder patients were not included in this analysis.
Daclatasvir (BMS-790052) treatment in vivo.
In a double-blind single ascending-dose study, three groups of six subjects were randomly assigned to receive one dose of 1, 10, or 100 mg of daclatasvir or placebo in a ratio of 5:1 (Fig. S1). As 1 mg was suboptimal, we did not include it in our study. One subject in the 10-mg group withdrew from the study 8 h after administration of the study drug and was not included in our analysis. After drug levels dropped to a low level, viral rebounds were observed (Fig. S1). To avoid bias in the parameter estimation due to these rebounds, we constrained our viral kinetic analysis to the five patients (one given 10 mg and four given 100 mg of daclatasvir) who did not show a viral rebound throughout the 3 d post dosing (Fig. S1 and Table S3).
Daclatasvir (BMS-790052) treatment in vitro.
Cell culture experiments used Huh7-1 cells and cell culture–propagated HCV (HCVcc) from the JFH-1 HCV consensus clone provided by Takaji Wakita (National Institute of Infectious Diseases, Tokyo, Japan), as described in detail in SI Methods. For HCV infection experiments, Huh7 cultures were inoculated with HCVcc and cultured for an additional 10 d to allow HCV infection to reach steady state. Parallel cultures of steady-state HCV-infected cells were then mock treated or treated with 25 μM NM107 or 1 nM daclatasvir. At indicated times, medium was harvested from eight replicate wells for titer analysis and cellular RNA isolated lysate was harvested in 200 μL 1× nucleic acid purification lysis solution (Applied Biosystems) from four replicate wells for real-time quantitative PCR (RTqPCR) analysis for HCV RNA and cellular GAPDH mRNA, as described in detail in SI Methods.
Supplementary Material
Acknowledgments
Portions of this work were performed under the auspices of the US Department of Energy under Contract DE-AC52-06NA25396 and supported by National Institutes of Health Grants R56/R01-AI078881-, P20-GM103452, OD011095, and AI028433; the National Science Foundation under Grants NSF PHY11-25915 and DMS 1122290; and the University of Illinois Walter Payton Liver Center Guild.
Footnotes
Conflict of interest statement: R.E.N. was an employee of Bristol-Myers Squibb when this study was performed.
*This Direct Submission article had a prearranged editor.
This article contains supporting information online at www.pnas.org/lookup/suppl/doi:10.1073/pnas.1203110110/-/DCSupplemental.
References
- 1.World Health Organization July 2012. Hepatitis C. Fact sheet no.164. Available at http://who.int/mediacentre/factsheets/fs164/en/
- 2.Armstrong GL, et al. The prevalence of hepatitis C virus infection in the United States, 1999 through 2002. Ann Intern Med. 2006;144(10):705–714. doi: 10.7326/0003-4819-144-10-200605160-00004. [DOI] [PubMed] [Google Scholar]
- 3.Gao M, et al. Chemical genetics strategy identifies an HCV NS5A inhibitor with a potent clinical effect. Nature. 2010;465(7294):96–100. doi: 10.1038/nature08960. [DOI] [PMC free article] [PubMed] [Google Scholar]
- 4.Blight KJ, Kolykhalov AA, Rice CM. Efficient initiation of HCV RNA replication in cell culture. Science. 2000;290(5498):1972–1974. doi: 10.1126/science.290.5498.1972. [DOI] [PubMed] [Google Scholar]
- 5.Lohmann V, Hoffmann S, Herian U, Penin F, Bartenschlager R. Viral and cellular determinants of hepatitis C virus RNA replication in cell culture. J Virol. 2003;77(5):3007–3019. doi: 10.1128/JVI.77.5.3007-3019.2003. [DOI] [PMC free article] [PubMed] [Google Scholar]
- 6.Lohmann V, et al. Replication of subgenomic hepatitis C virus RNAs in a hepatoma cell line. Science. 1999;285(5424):110–113. doi: 10.1126/science.285.5424.110. [DOI] [PubMed] [Google Scholar]
- 7.Tellinghuisen TL, Foss KL, Treadaway JC, Rice CM. Identification of residues required for RNA replication in domains II and III of the hepatitis C virus NS5A protein. J Virol. 2008;82(3):1073–1083. doi: 10.1128/JVI.00328-07. [DOI] [PMC free article] [PubMed] [Google Scholar]
- 8.Appel N, et al. Essential role of domain III of nonstructural protein 5A for hepatitis C virus infectious particle assembly. PLoS Pathog. 2008;4(3):e1000035. doi: 10.1371/journal.ppat.1000035. [DOI] [PMC free article] [PubMed] [Google Scholar]
- 9.Hughes M, Griffin S, Harris M. Domain III of NS5A contributes to both RNA replication and assembly of hepatitis C virus particles. J Gen Virol. 2009;90(Pt 6):1329–1334. doi: 10.1099/vir.0.009332-0. [DOI] [PMC free article] [PubMed] [Google Scholar]
- 10.Masaki T, et al. Interaction of hepatitis C virus nonstructural protein 5A with core protein is critical for the production of infectious virus particles. J Virol. 2008;82(16):7964–7976. doi: 10.1128/JVI.00826-08. [DOI] [PMC free article] [PubMed] [Google Scholar]
- 11.Tellinghuisen TL, Foss KL, Treadaway J. Regulation of hepatitis C virion production via phosphorylation of the NS5A protein. PLoS Pathog. 2008;4(3):e1000032. doi: 10.1371/journal.ppat.1000032. [DOI] [PMC free article] [PubMed] [Google Scholar]
- 12.Neumann AU, et al. Hepatitis C viral dynamics in vivo and the antiviral efficacy of interferon-alpha therapy. Science. 1998;282(5386):103–107. doi: 10.1126/science.282.5386.103. [DOI] [PubMed] [Google Scholar]
- 13.Snoeck E, et al. A comprehensive hepatitis C viral kinetic model explaining cure. Clin Pharmacol Ther. 2010;87(6):706–713. doi: 10.1038/clpt.2010.35. [DOI] [PubMed] [Google Scholar]
- 14.Adiwijaya BS, et al. Rapid decrease of wild-type hepatitis C virus on telaprevir treatment. Antivir Ther. 2009;14(4):591–595. [PubMed] [Google Scholar]
- 15.Quinkert D, Bartenschlager R, Lohmann V. Quantitative analysis of the hepatitis C virus replication complex. J Virol. 2005;79(21):13594–13605. doi: 10.1128/JVI.79.21.13594-13605.2005. [DOI] [PMC free article] [PubMed] [Google Scholar]
- 16.Guedj J, Perelson AS. Second-phase hepatitis C virus RNA decline during telaprevir-based therapy increases with drug effectiveness: Implications for treatment duration. Hepatology. 2011;53(6):1801–1808. doi: 10.1002/hep.24272. [DOI] [PMC free article] [PubMed] [Google Scholar]
- 17.Shimakami T, et al. Protease inhibitor-resistant hepatitis C virus mutants with reduced fitness from impaired production of infectious virus. Gastroenterology. 2011;140(2):667–675. doi: 10.1053/j.gastro.2010.10.056. [DOI] [PMC free article] [PubMed] [Google Scholar]
- 18.Lok AS, et al. Preliminary study of two antiviral agents for hepatitis C genotype 1. N Engl J Med. 2012;366(3):216–224. doi: 10.1056/NEJMoa1104430. [DOI] [PubMed] [Google Scholar]
- 19.Huang Y, Staschke K, De Francesco R, Tan SL. Phosphorylation of hepatitis C virus NS5A nonstructural protein: A new paradigm for phosphorylation-dependent viral RNA replication? Virology. 2007;364(1):1–9. doi: 10.1016/j.virol.2007.01.042. [DOI] [PubMed] [Google Scholar]
- 20.Foster TL, Belyaeva T, Stonehouse NJ, Pearson AR, Harris M. All three domains of the hepatitis C virus nonstructural NS5A protein contribute to RNA binding. J Virol. 2010;84(18):9267–9277. doi: 10.1128/JVI.00616-10. [DOI] [PMC free article] [PubMed] [Google Scholar]
- 21.Macdonald A, Harris M. Hepatitis C virus NS5A: Tales of a promiscuous protein. J Gen Virol. 2004;85(Pt 9):2485–2502. doi: 10.1099/vir.0.80204-0. [DOI] [PubMed] [Google Scholar]
- 22.Targett-Adams P, et al. Small molecules targeting hepatitis C virus-encoded NS5A cause subcellular redistribution of their target: insights into compound modes of action. J Virol. 2011;85(13):6353–6368. doi: 10.1128/JVI.00215-11. [DOI] [PMC free article] [PubMed] [Google Scholar]
- 23.Ramratnam B, et al. Rapid production and clearance of HIV-1 and hepatitis C virus assessed by large volume plasma apheresis. Lancet. 1999;354(9192):1782–1785. doi: 10.1016/S0140-6736(99)02035-8. [DOI] [PubMed] [Google Scholar]
- 24.Powers KA, et al. Kinetics of hepatitis C virus reinfection after liver transplantation. Liver Transpl. 2006;12(2):207–216. doi: 10.1002/lt.20572. [DOI] [PubMed] [Google Scholar]
- 25.Dahari H, Barretto N, Sansone N, Guedj J, Perelson AS, Uprichard SL. Modeling inhibition kinetics of HCV SG1B RNA during IFN/DAAS treatment in non-growing Huh7 cells. Hepatology. 2011;54(Suppl S1):538A. (abstr) [Google Scholar]
- 26.Dahari H, Sainz B, Jr, Perelson AS, Uprichard SL. Modeling subgenomic hepatitis C virus RNA kinetics during treatment with alpha interferon. J Virol. 2009;83(13):6383–6390. doi: 10.1128/JVI.02612-08. [DOI] [PMC free article] [PubMed] [Google Scholar]
- 27.Guo JT, Bichko VV, Seeger C. Effect of alpha interferon on the hepatitis C virus replicon. J Virol. 2001;75(18):8516–8523. doi: 10.1128/JVI.75.18.8516-8523.2001. [DOI] [PMC free article] [PubMed] [Google Scholar]
- 28.Egger D, et al. Expression of hepatitis C virus proteins induces distinct membrane alterations including a candidate viral replication complex. J Virol. 2002;76(12):5974–5984. doi: 10.1128/JVI.76.12.5974-5984.2002. [DOI] [PMC free article] [PubMed] [Google Scholar]
- 29.Guedj J, Dahari H, Shudo E, Smith P, Perelson AS. Hepatitis C viral kinetics with the nucleoside polymerase inhibitor mericitabine (RG7128) Hepatology. 2012;55(4):1030–1037. doi: 10.1002/hep.24788. [DOI] [PMC free article] [PubMed] [Google Scholar]
- 30.Dahari H, Feliu A, Garcia-Retortillo M, Forns X, Neumann AU. Second hepatitis C replication compartment indicated by viral dynamics during liver transplantation. J Hepatol. 2005;42(4):491–498. doi: 10.1016/j.jhep.2004.12.017. [DOI] [PubMed] [Google Scholar]
Associated Data
This section collects any data citations, data availability statements, or supplementary materials included in this article.