

Abstract
Objective
To compare the 10-year retest stability of normal traits, pathological traits, and personality disorder dimensions in a clinical sample.
Method
Ten-year rank order stability estimates for the Revised NEO Personality Inventory, Schedule for Nonadaptive and Adaptive Personality, and Diagnostic Interview for DSM-IV Personality Disorders were evaluated before and after correcting for test-retest dependability and internal consistency in a clinical sample (N = 266).
Results
Dependability corrected stability estimates were generally in the range of .60–.90 for traits and .25–.65 for personality disorders.
Conclusions
The relatively lower stability of personality disorder symptoms may indicate important differences between pathological behaviors and relatively more stable self-attributed traits and imply that a full understanding of personality and personality pathology needs to take both traits and symptoms into account. The Five-Factor Theory distinction between basic tendencies and characteristic adaptations provides a theoretical framework for the separation of traits and disorders in terms of stability in which traits reflect basic tendencies that are stable and pervasive across situations, whereas personality disorder symptoms reflect characteristic maladaptations that are a function of both basic tendencies and environmental dynamics.
Keywords: Personality Stability, Traits, Personality Disorders, Five Factor Theory
Stability is a defining aspect of personality traits (Asendorpf, 1992; Caspi & Roberts, 1999; Funder, 1991) and issues of personality stability are central to questions about human nature (Roberts & Caspi, 2001). Retest correlations for core personality dispositions over fairly extended intervals are rarely lower than .50, and are often in the .80s (Ardelt, 2000; Roberts & Del Vecchio, 2000; Roberts & Mroczek, 2008; Ferguson, 2010; Lucas & Donnellen, 2011). Given this robust general finding, researchers have increasingly begun to focus on potential moderators of differential stability, such as the nature of the personality characteristics being examined (e.g., Ferguson, 2010). In this study, we compare ten-year stability coefficients for the scales of a normal trait questionnaire, a pathological trait questionnaire, and a personality disorder diagnostic interview in a clinical sample in order to evaluate the relative rank-order stability of normative and pathological personality dimensions. Based on the recent suggestion that differences between personality traits and disorders can be explained by lower dependability of personality disorder assessments (Chmielewski & Watson, 2009), we also examine the affects of differential dependability across assessment methods on personality stability estimates.
The Stability of Normative and Pathological Personality
Personality stability can depend on certain attributes of the constructs being examined. For example, researchers generally find that ratings of narrow affects such as anger or sadness are less stable than ratings of broad traits such as neuroticism (Vaidya, Gray, Haig, Mroczek, & Watson, 2008). This pattern may suggest that the tendency to experience negative emotions in general is stable over time, but the experience of specific negative emotions waxes and wanes according to interactions between dispositional propensities and environmental context. Other research indicates that personality disorders (PDs) are less rank-order stable than normative traits (Durbin & Klein, 2006; Morey et al., 2007), and in fact that normative trait stability is informative about PD symptomatology (Hopwood et al., 2009; Hopwood & Zanarini, 2010a; Wright, Pincus, & Lenzenweger, 2011). PD symptoms connote functional impairments that are thought to be influenced by environmental factors (e.g., social stressors) and to respond to psychosocial interventions (e.g., psychotherapy). To the extent that contexts change differentially across individuals over time, narrower and more specific behavioral manifestations of personality features that covary within these contexts may show reduced temporal consistency relative to broad and endogenous dispositions.
This pattern parallels the separation of basic tendencies and characteristic adaptations in McCrae and Costa’s (1995 in McCrae and Costa’s (2003) Five-Factor Theory of personality. Basic tendencies to be more or less neurotic, extraverted, open, agreeable, and conscientious are thought to mature by early adulthood, at which point they remain relatively stable in the absence of extreme environmental changes throughout adulthood. Characteristic adaptations change in response to variability in the biological or social environment. From this perspective PD symptoms can be viewed as reflecting characteristic maladaptations, or maladjusted reactions to environmental contexts that are influenced by personality dispositions, previous experiences, and current contexts. These more behaviorally specific and contextual symptoms would thus be anticipated to be less stable over time than basic tendencies (Harkness & Lilienfeld, 1997; Harkness & McNulty, 2002).
However, in a recent meta-analysis Ferguson (2010) compared stability effects from studies using broad versus narrow and normal versus pathological personality traits, and concluded that stability generally does not differ across these domains. Yet the authors of the only study used in Ferguson’s meta-analysis that directly compared retest correlations for traits and PDs in the same sample (Durbin & Klein, 2006) found that PD symptom counts were less stable than normal personality traits over ten years. This pattern was also observed in an article using data from the Collaborative Longitudinal Personality Disorders Study (CLPS) that did not contribute to Ferguson’s meta-analysis1. Specifically, Morey et al. (2007) observed mean two-year stability coefficients for Five Factor trait domains (.74) and facets (.67) that were somewhat larger than retest correlations for PD symptom counts (.59).
Potential Effects of Reliability on Personality Stability
One potential explanation for the discrepancy between the meta-analytic conclusion drawn by Ferguson (2010) and the results of these specific studies is that unlike Ferguson, neither Morey et al. (2007) nor Durbin and Klein (2006) corrected for short-term ‘dependability’ coefficients (retest correlations taken over a sufficiently short enough time interval that genuine trait change is deemed unlikely). Chmielewski and Watson (2009) compared short-term dependability in assessments of affects, normative traits, and schizotypal personality features and found that dependability tended to be lower for schizotypal features and affects than for normative traits. Correcting stability coefficients for dependability made the stabilities of affect measures more similar to those of trait measures. Chmielewski and Watson suggested based on these findings that correcting for dependability in PD ratings would close the gap between PD and trait stabilities as well. In particular, these authors argued that “transient error may have affected the findings of the Collaborative Longitudinal Study of Personality Disorders (CLPS), which documented high levels of change in PDs” (Chmielewski & Watson, 2009, p. 199). Although retest reliability data are available for the diagnostic interview in the CLPS sample (Zanarini et al., 2000), and dependability did not appreciably account for remission rates (i.e., mean-level stability) in Grilo et al. (2004), Chmielewski and Watson’s hypothesis has not yet been tested with respect to rank order stability, as we do in this study.
Another methodological issue that could affect the differential stability of personality attributes involves the properties of self-report and interview assessment methods. Many clinicians and PD researchers have raised concerns about self-report questionnaires such as susceptibility to response bias (Huprich & Bornstein, 2007) and tend to favor diagnostic interviews for assessing personality pathology (Zimmerman et al., 1994). Conversely, most research on personality stability has been conducted using self-report questionnaires (Roberts & Del Vecchio, 2000). Because personality researchers interested in developmental issues such as stability prefer questionnaires and clinicians interested in the pathological consequences of personality value interviews, the issues of personality stability and normality versus pathology have sometimes been conflated. Indeed, Samuel et al. (2011) recently found, in the CLPS data, that PD constructs measured by self-report were more stable than PD constructs measured by diagnostic interview over two years, without controlling for dependability. This finding may suggest either that the interview method was less dependable than the questionnaire, or that the interview focused more on dynamic aspects of pathological personality whereas the questionnaire tapped more stable aspects.
The Present Study
To summarize, the similarity of retest stability estimates for normative traits, pathological traits, and PDs is important both for theoretical models of personality and personality pathology and also for applied personality assessment. However, several issues about the relative stability of these different aspects of personality have interacted in previous research in a manner that has generated a lack of clarity about possible moderators, rendering the relative effects of dependability, pathology, and behavioral specificity on personality stability over extended intervals unclear. To further evaluate these issues, we assess in this study the 10-year retest stability of normative traits, pathological traits, and PDs in the CLPS sample, controlling for dependability. This study is the first evaluation of 10-year differential stability of normative personality traits, pathological personality traits, and PD symptoms in a clinical sample, and the first direct comparison of differential stability across these assessment domains that controls for dependability.
Method
Baseline and 10-year follow up data from the CLPS sample were used in this study. At baseline, data were collected from 668 individuals who were selected for having borderline PD, avoidant PD, obsessive-compulsive PD, schizotypal PD, or major depressive disorder. However, the sample overall displayed extensive comorbidity (McGlashan et al., 2000) and similar levels of variability across the DSM-IV PD symptom counts. At baseline and 10-year follow-up, participants were administered the Diagnostic Interview for DSM-IV Personality Disorders (DIPD-IV; Zanarini, Frankenburg, Sickel, & Yong, 1996) by interviewers masked to previous data, the Revised NEO Personality Inventory (NEO PI-R; Costa & McCrae, 1992), a self-report measure of five-factor model personality traits and facets, and the Schedule for Nonadaptive and Adaptive Personality (SNAP; Clark, 1993), a self-report measure of normative and pathological personality features. Information on the retest and internal consistency reliabilities of these measures is given below. The inter-rater reliabilities of DIPD-IV symptom counts from videotaped interviews in a baseline subsample (N = 84) ranged from .69–.97 (Mdn = .88) (Zanarini et al., 2000).
Participants from the original 668 were included in this report if they completed all three study measures at both baseline and 10-year follow-up (N = 266). Missing data occurred because of study attrition (N = 237) and because some participants who did not attrite did not complete self-report questionnaires at the follow-up (N = 165). We compared individuals with and without follow-up data on baseline personality variables. Although most differences were trivial, the following scales showed statistically significant (p < .01) but generally small (i.e., d coefficients around .20; Cohen, 1992) effect size differences between those with and without 10-year follow-up data. Individuals included in the analyses had higher scores on NEO PI-R neuroticism (d = .32; each neuroticism facet also differed between groups), DIPD-IV paranoid (d = .31), schizotypal (d = .27) and SNAP propriety (d = .26), mistrust (d = .25), eccentric perceptions (d = .24), self-harm (d = .20), detachment (d = .22), and negative temperament (d = .29), and lower scores on NEO PI-R extraversion (d = .21; particularly positive emotions [d = .25] and gregariousness [d = .21] facets), openness to actions (d = .34), and achievement-striving (d = .21). Overall, this pattern suggests that individuals who persisted in the study were less emotionally healthy than those who did not.
We computed retest Pearson correlations between baseline and 10-year follow-up scores for each trait and PD to assess rank-order stability. Pearson correlations were selected in order to maintain comparability between the current results and those of other studies, given that the Pearson correlation is the most common metric used to represent longitudinal stability in the personality literature. Given substantial positive skew, the DIPD-IV data were square root transformed prior to analysis. Spearman rho coefficients were computed given that these variables were skewed even after transformation. As all rho coefficients were < |.05| different from Pearson r values, we report r values to facilitate comparisons with stability coefficients from the other measures. To address potential biases associated with missing data, we recomputed all correlations for all measures using Full Information Maximum Likelihood estimation as implemented in AMOS 17.0. As no stability coefficient changed more than |.05|, we only report zero-order correlations among those with observed follow-up data.
In order to address concerns about the impact of measurement reliability on stability, we also corrected estimates using 1 to 2 week dependability coefficients for each personality variable. No retest reliability study was conducted in the CLPS sample for the NEO PI-R or SNAP. The NEO PI-R manual does not report information on its retest reliability. Therefore, we used the retest reliability estimates from a study with a 1 week retest interval that used the NEO PI-R in a sample of 132 undergraduates (McCrae et al., 2011). Test-retest coefficients for the SNAP trait and temperament scales are from a 1-week retest study conducted in a state hospital among 52 patients2, as reported in the SNAP manual (Clark, 1993). Dependability coefficients for the DIPD-IV are from Zanarini et al. (2000), who reported correlations across a 7–10 day retest interval of PD symptom counts by different interviewers with 52 patients in the CLPS sample.
Following Ferguson (2010), we also used Cronbach’s alpha internal consistency values to correct for measurement error. Although several authors (Chmielewski &Watson, 2009; McCrae et al., 2011) have argued that internal consistency corrections are theoretically and empirically inferior to retest corrections for evaluating the impact of unreliability on personality validity and stability, using internal consistency values has the advantage of allowing us to correct stability coefficients based on data provided by individuals in this sample and to directly compare the relative impacts of these two correction methods.
In addition to corrections for dependability and internal consistency, we also tested the moderating role of age and the severity of baseline functional impairment on stability using hierarchical moderated regression analyses with centered age/functioning and baseline trait values in step 1, the interaction between age or functioning and the baseline trait in step 2, and the 10-year value on the trait as the dependent variable. We tested age moderation because research suggests that stability varies as a function of age. In particular young adults are often found to have somewhat less stable personalities than individuals in middle age (Ferguson, 2010; Roberts & Del Vecchio, 2000), although whether age effects apply similarly to traits and PDs has not been studied extensively. Functioning may moderate stability for at least two reasons. First, some researchers have suggested that stability effects, particularly with regard to PDs, may be a function of regression to the mean reflecting distressed mood states at the baseline assessment (Chmielewski & Watson, 2009). Evidence that individuals with more severe functional impairment at baseline displayed more dramatic changes in personality features than those with less severe impairment would support this contention. Second, borderline PD, one of the PDs with more severe functional impairment (Skodol et al., 2002), has been associated with lower 6-year personality stability of FFM traits in the CLPS (Hopwood et al., 2009; N = 432) and lower 10-year stability of FFM traits in the McLean Study of Adult Development (Hopwood & Zanarini, 2010; N = 362) samples, raising the possibility that the more functionally impaired individuals generally will exhibit lower levels of personality stability.
Results
Tables 1 through 3 report internal consistency and dependability values, uncorrected 10-year stabilities, and 10-year stability estimates corrected for both dependability and internal consistency for the NEO PI-R, SNAP, and DIPD-IV, respectively. Overall, the dependability and internal consistency corrections yielded similar results. Given the recommendations by Chmielewski and Watson (2009) and McCrae et al. (2011), we focus here on dependability corrected estimates. The average dependability corrected stability was .74 for the NEO PI-R domains and .70 for the facets. There was some variability across traits, with neuroticism and conscientiousness being somewhat less stable than the other domains. Values for the SNAP are reported in Table 2. The mean retest corrected stability for SNAP traits was .70. Again there was variability; for example, negative temperament and dependency had corrected retest correlations of .57 whereas this correlation was .82 for detachment and .96 for propriety. Finally, retest corrected values for the DIPD-IV PD symptom counts are reported in Table 3. These values are substantially lower than those of the two self-report measures, with a mean of .47.
Table 1.
10-year stability of NEO-PI-R factor and facet scales.
| Dependability | Internal Consistency | ||||
|---|---|---|---|---|---|
|
| |||||
| Trait | Stability | Reliability Estimate | Corrected Stability | Reliability Estimate | Corrected Stability |
| Factors | |||||
| Neuroticism | .63 | .91 | .69 | .91 | .69 |
| Extraversion | .71 | .92 | .77 | .88 | .81 |
| Openness | .75 | .93 | .81 | .90 | .83 |
| Agreeableness | .70 | .92 | .76 | .87 | .80 |
| Conscientiousness | .63 | .92 | .68 | .92 | .68 |
|
| |||||
| Mean/Median | .68/.70 | .82/.92 | .74/.76 | .90/.90 | .76/.80 |
|
| |||||
| Facets | |||||
| Anxiety | .50 | .85 | .59 | .76 | .66 |
| Angry Hostility | .57 | .83 | .69 | .82 | .70 |
| Depression | .46 | .90 | .51 | .82 | .56 |
| Self-Consciousness | .57 | .79 | .72 | .72 | .79 |
| Impulsiveness | .57 | .77 | .74 | .68 | .84 |
| Vulnerability | .51 | .85 | .60 | .79 | .65 |
| Warmth | .61 | .86 | .71 | .79 | .77 |
| Gregariousness | .58 | .89 | .65 | .74 | .78 |
| Assertiveness | .59 | .91 | .65 | .79 | .75 |
| Activity | .52 | .78 | .67 | .68 | .76 |
| Excitement Seeking | .64 | .78 | .82 | .62 | 1.03 |
| Positive Emotions | .57 | .86 | .66 | .75 | .76 |
| Fantasy | .71 | .82 | .87 | .82 | .87 |
| Aesthetics | .73 | .91 | .80 | .81 | .90 |
| Feelings | .54 | .82 | .66 | .68 | .79 |
| Actions | .60 | .78 | .77 | .54 | 1.11 |
| Ideas | .71 | .87 | .82 | .80 | .89 |
| Values | .60 | .80 | .75 | .64 | .94 |
| Trust | .67 | .83 | .81 | .85 | .79 |
| Straightforwardness | .56 | .86 | .65 | .70 | .80 |
| Altruism | .63 | .75 | .84 | .74 | .85 |
| Compliance | .63 | .83 | .76 | .74 | .85 |
| Modesty | .50 | .86 | .58 | .71 | .70 |
| Tender-Mindedness | .56 | .70 | .80 | .61 | .92 |
| Competence | .53 | .80 | .66 | .71 | .75 |
| Order | .56 | .90 | .62 | .70 | .80 |
| Dutifulness | .56 | .75 | .75 | .61 | .92 |
| Ach. Striving | .61 | .88 | .69 | .78 | .78 |
| Self-Discipline | .48 | .83 | .58 | .82 | .59 |
| Deliberation | .55 | .77 | .71 | .78 | .71 |
|
| |||||
| Mean/Median | .58/.57 | .83/.83 | .70/.70 | .73/.74 | .80/.79 |
Table 3.
10-year stability of DIPD-IV personality disorder symptom counts.
| Dependability | Internal Consistency | ||||
|---|---|---|---|---|---|
|
| |||||
| Disorder | Stability | Reliability Estimate | Corrected Stability | Reliability Estimate | Corrected Stability |
| Paranoid | .39 | .71 | .55 | .77 | .51 |
| Schizoid | .36 | .52 | .69 | .73 | .49 |
| Schizotypal | .42 | .65 | .65 | .75 | .56 |
| Borderline | .36 | .84 | .43 | .78 | .46 |
| Histrionic | .15 | .65 | .23 | .86 | .17 |
| Narcissistic | .24 | .82 | .29 | .78 | .31 |
| Antisocial | .60 | .92 | .65 | .73 | .82 |
| Avoidant | .42 | .83 | .51 | .81 | .52 |
| Dependent | .23 | .78 | .29 | .81 | .28 |
| Obsessive-Compulsive | .31 | .82 | .38 | .63 | .49 |
|
| |||||
| Mean/Median | .35/.36 | .75/.80 | .47/.47 | .77/.78 | .46/.49 |
Table 2.
10-year stability of SNAP trait and temperament scales.
| Dependability | Internal Consistency | ||||
|---|---|---|---|---|---|
|
| |||||
| Trait | Stability | Reliability Estimate | Corrected Stability | Reliability Estimate | Corrected Stability |
| Negative Temperament | .49 | .86 | .57 | .90 | .54 |
| Mistrust | .66 | .81 | .81 | .89 | .74 |
| Manipulativeness | .52 | .77 | .68 | .79 | .66 |
| Aggression | .57 | .89 | .64 | .88 | .65 |
| Self-harm | .57 | .87 | .66 | .87 | .66 |
| Eccentric Perceptions | .52 | .79 | .66 | .85 | .61 |
| Dependency | .43 | .75 | .57 | .82 | .52 |
| Positive Temperament | .61 | .89 | .69 | .89 | .69 |
| Exhibitionism | .61 | .87 | .70 | .78 | .78 |
| Entitlement | .53 | .80 | .66 | .83 | .64 |
| Detachment | .63 | .77 | .82 | .85 | .74 |
| Disinhibition | .55 | .76 | .72 | .80 | .69 |
| Impulsivity | .56 | .74 | .76 | .77 | .73 |
| Propriety | .65 | .68 | .96 | .82 | .79 |
| Workaholism | .53 | .83 | .64 | .85 | .62 |
|
| |||||
| Mean/Median | .56/.56 | .81/.80 | .70/.68 | .84/.85 | .67/.66 |
A one-way ANOVA comparing the retest-corrected stability estimates for the NEO PI-R facets, SNAP traits, and DIPD-IV PDs was used to test the hypothesis of differential stability across assessment domains directly. Prior to this analysis we transformed the correlations to z-scores using the Fisher r-to-z transformation. This model was significant (F(2, 52) = 10.67, p < .001). A Duncan’s multiple range post-hoc analysis revealed that the interview-based PD stabilities were significantly (p < .05) lower than the stability estimates for the traits, with the SNAP and NEO-PI-R stabilities not significantly differing. A similar model comparing alpha corrected estimates was also statistically significant (F(2, 52) = 13.65, p < .001). However, unlike with retest-corrected estimates, post-hoc tests of the alpha-corrected estimates suggested that the NEO-PI-R facets were significantly more stable than the SNAP traits, which were more stable than the interview-assessed PDs. The apparent discrepancy between findings using retest and alpha-corrected estimates across the NEO-PI-R and SNAP was potentially due to retest reliabilities for the NEO-PI-R (mean = .84) being generally higher than alpha reliabilities (.81) for the SNAP, whereas retest reliabilities (.83) tended to be higher than alpha reliabilities for the NEO-PI-R facets (.73). In consideration of the well-known relation between alpha and scale length and the fact that mean inter-item correlations tend to be similar across the SNAP and NEO-PI-R, the most likely interpretation of differences in alpha-corrected estimates is that they are a function of the SNAP’s relatively longer scales. Given greater theoretical confidence in dependability (Chmielewski & Watson, 2009; McCrae et al., 2011) and the likelihood that alpha-corrected estimates were affected by scale length, we concluded that the SNAP traits and NEO facets were similarly stable, and that both are more stable than PDs.
The final set of analyses tested the potential moderating roles of age and baseline functioning on personality trait and disorder stability. There were no significant (p < .05) interactive effects for baseline GAF on the stability of any trait or PD, as might be found if relatively lower stability in the DIPD-IV PDs were due to regression to the mean. There were no main effects or interactive effects of age on any of the FFM or SNAP traits. Age exerted a significant (p < .05) main effect, after controlling for baseline values, on obsessive compulsive (β = −.12), narcissistic (β = −.12) and antisocial (β = −.10) PDs. These coefficients indicate that older people had lower scores at follow-up on these three disorders, given their baseline scores, than did younger people. More pertinent to the focus of this paper, age moderated the stability of four disorders: dependent (β = .13), histrionic (β = −.15), narcissistic (β = −.17), and antisocial (β = −.11). These values indicate that histrionic, narcissistic, and antisocial symptoms are somewhat more stable among younger individuals, whereas dependent symptoms are somewhat more stable among relatively older individuals.
Discussion
This study compared the rank-order stability of personality features, corrected for retest dependability and internal consistency, from three prominent personality models in a clinical sample over a 10-year follow-up interval. The overall findings are presented in Figure 1, and can be summarized as follows: a) self-attributed traits are more stable than interview-assessed personality disorders, b) this difference holds after correcting for dependability and internal consistency estimates, and c) dependability and internal consistency corrections generally yielded similar results.
Figure 1.
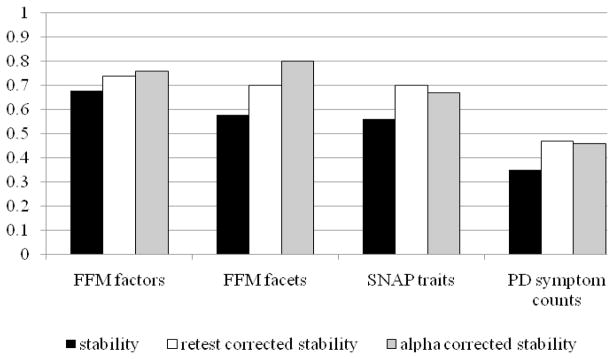
Mean 10-year rank-order stability values for personality traits and disorders.
Psychometric Explanations of Variable Stability Estimates across Traits and Disorders
What explains the lower stability of PDs relative to traits? Although it has been suggested that CLPS findings of unexpectedly low PD stability (e.g., Grilo et al., 2004; Shea et al., 2002) were due to PD assessment unreliability (e.g., Chmielewski & Watson, 2009), our analyses here revealed that PD stability remained lower than trait stability even after correcting for both retest reliability and internal consistency. This finding is consistent with the hypothesis that PD symptoms, as evaluated by interviewers, reflect characteristic maladaptations that are predisposed by traits but are also more behaviorally specific than traits. This hypothesis would suggest that symptoms would tend to vary more over time than traits as a function of environmental dynamics. The observation from our previous work (Morey et al., 2007; in press) that PDs and traits demonstrate similar levels of criterion-related validity using methodologically-balanced (i.e., including both interview-based and self-reported criterion variables) outcomes further supports this view and counters suggestions that PD stability findings in CLPS were influenced by measurement unreliability, as psychometrically inferior scales should generally perform worse than superior scales in a predictive context.
A related concern involves the possibility that the CLPS assessment of PDs by diagnostic interview included false positives due to the ostensible effects of distressed mood on personality assessment (Chmielewski & Watson, 2009). This could lead to differential regression to the mean across true and false positive cases such that true cases may experience lower remission rates than false cases, and this in turn could potentially affect rank-order stability in addition to mean-level stability. However, previous results from the CLPS data suggest that NEO PI-R traits and DIPD-IV PDs are not differentially affected by baseline mood (Morey et al., 2010). The results from the current study also allay this concern, as the PDs for which participants were selected into the CLPS study (borderline, avoidant, obsessive-compulsive, and schizotypal) had similar stabilities (average dependability-corrected stability = .49) as the PDs that were not selection criteria (.45). If regression to the mean were operative, it would be anticipated to impact selected PDs relatively more than non-selected PDs. That baseline functioning did not moderate stability for any trait or PD further discredits the hypothesis that the relatively lower rank-order instability in PDs observed in CLPS was due to measurement invalidity.
Substantive Explanations of Varying Stability Estimates across Traits and Disorders
There are several substantive reasons to expect that self-attributed traits might yield more stable estimates over extended periods than PD criteria. One set of explanations involves the different content of the DSM and trait models of personality and personality pathology. Stability differences may have occurred because the DSM-IV symptoms reflect a blend of pathological traits and more state-like behaviors (e.g., McGlashan et al., 2005), whereas the SNAP and FFM models more purely reflect traits, and are less saturated with behaviorally specific content. Indeed, the SNAP PD scales are more stable, at least over two years, than the DIPD-IV PD symptom counts (Samuel et al., 2011).
PD interviews such as the DIPD-IV require clinicians to ask individuals for specific behavioral examples of their symptoms, the clinical significance of these symptoms, and how they play out in day-to-day life. Although respondents are asked to describe behavior in general and over the course of the previous two years, this frame of reference could magnify the importance of recent and more easily-remembered experiences, and thus lead respondents to and interviewers to emphasize more contextualized elements of behavior. Conversely, SNAP items are generally context free, such as “I like showing off” and “Lying is easy for me to do”3. The nature of such questions perhaps prompts reports of more global evaluations of stable personality traits that could lead to dysfunction rather than pulling for examples of pathological behavior in specific, and possibly more recent or localized, contexts.
Interviews and questionnaires may also be differentially useful for assessing various aspects of personality and related pathology content. For example, in a previous CLPS study (Hopwood et al., 2008), our group found that the DIPD-IV and a self-report assessment (Personality Diagnostic Questionnaire-4) for borderline PD that was matched in terms of item content were similarly valid for predicting functional outcomes, but also that each had unique strengths. Specifically, the interview seemed somewhat more valid for more observable behavior (e.g., impulsive or self-harming behavior) but the self-report measure seemed more valid for more inferential symptoms (e.g., emptiness, identity problems). Interestingly, McGlashan et al. (2005) reported that impulsive behaviors were among the most stable interview criteria and identity problems were among the least stable. Thus, it is possible that interviewers provide less reliable and valid ratings of some aspects of PD (e.g., those that require more inference) than others.
It is also possible that different assessment methods are more amenable to the assessment of more or less stable personality features, independent of their content. For example, interviewers might be inclined to attend more closely to contextual factors that influence symptomatology, despite instructions to consider enduring aspects of personality. Clinical interviewers are trained to solicit examples of a person’s behavior in addition to attributions about general behavioral tendencies, and to make judgments about whether those examples constitute significant symptomatology. Conversely, self-report questionnaires allow the respondent to rate themselves on general tendencies. To the degree that it may be identity-reaffirming to see one’s personality as basically stable, self-report methods could also contribute to a level of stability over time that over-estimates objective trait stability, given that self-reports are not direct measures of personality traits per se but they rather measure how people see themselves (McCrae & Costa, 1982).
Unlike self-reports, interviews require the perceptions of a clinician to filter the report of the interviewee. Because in this study different clinicians interviewed participants at baseline and follow-up, the clinicians may have noticed or rated different aspects of personality dysfunction. Thus it is possible that variance across raters, perhaps interacting with the duration of time between interviews or interviewee state effects, lowered stability estimates somewhat. However, even if such factors were operating, these influences were not sufficiently strong to affect dependability, internal consistency, or validity coefficients (Morey et al., 2007, in press) relative to self-report questionnaires.
Limitations and Future Directions
This study was limited in a number of ways that suggest the need for further research. The main methodological limitation involved the high rate of unavailable data at the 10-year follow-up. Although maximum likelihood estimated stability values suggested the potentially biasing impact of missing data was limited, it is possible that the results would not generalize to individuals whose data were unavailable at the follow-up, and thus not generalize to other samples as well. It is also noteworthy that persisters showed more severe psychopathology, a finding that is worthy of more focused consideration. Despite this limitation, the CLPS data are unique in providing assessments of three measures of personality and PD assessed over 10 years and thus informative for debates about personality stability despite this limitation. Moreover, Roberts and DelVecchio (2000) reported that “across hundreds of longitudinal studies, we did not find that attrition distorted the resulting trait consistency” (p. 19).
A more methodologically balanced study could test the possibility that the observed effects were driven by measurement method. For instance, interviews might lead to lower stability estimates of personality than self-report questionnaires in general. It would be ideal to have interviews and questionnaires that were matched precisely on content. For example, it would have been useful to have interviews that assessed the content of the SNAP and NEO-PI-R, and a self-report measure collected longitudinally that assessed the content of the DIPD-IV. It would also be informative for future researchers to evaluate personality stability using other methods, such as informant reports (Klonsky & Oltmanns, 2002), performance-based measures (Meyer & Viglione, 2008), or laboratory approaches (Durbin et al., 2009).
Finally, more effective methods are needed for conceptualizing how measurement problems affect stability estimates. While correcting for short-term dependability is a useful way forward, it is limited in a number of ways. One example is that such corrections give less reliable measures an advantage in terms of stability estimates, in that dividing by smaller numbers leads to larger corrections. Retest dependability also assumes that the temporal difference between dependability and stability are equivalent across personality constructs, even though some personality features that can be assessed reliably (e.g., negative affectivity) are less stable than others (e.g., positive affectivity). Some PD symptoms, such as cutting behavior in borderline personality disorder, may be quite transient, and in this way be unlike some highly stable normative traits. Retest estimates were particularly limited in this study because they came from different kinds of samples across instruments. Internal consistency estimates performed similarly to dependabilities and are problematically associated with scale length, rendering internal consistency values less than optimal as a correction for reliability corrections. Intensive short-term longitudinal studies and latent variable modeling can be used to provide estimates of dependability in the presence of measurement error and help to empirically address concerns about the appropriate interval length (e.g., Anusic, Lucas, & Donnellan, 2012). The implications of this research for controlling measurement unreliability should certainly inform future investigations of personality stability.
Conclusion
In summary, this study showed that personality traits were substantially more consistent than PDs in a clinical sample followed over ten years, both before and after correcting for retest dependability and internal consistency values. These results suggest that there is a continuum of stability in normal and pathological personality features, with PD symptoms reflecting relatively more contextualized and dynamic characteristic adaptations and self-attributed traits, whether normal or pathological, reflecting more stable basic tendencies. Personality traits are most useful for predicting aggregated behaviors, whereas symptoms occur in contextualized processes. Both are important and complementary for understanding personality processes and personality pathology and this evidence, coupled with evidence of their incremental validity (Hopwood & Zanarini, 2010b; Morey et al., 2007, in press) suggest the value of using multiple methods to assess both normal and pathological personality features for predicting behavior.
Acknowledgments
This study was approved by the CLPS Publication Committee and supported by NIMH grants MH 50837, 50838, 50839, 50840, 50850, 073708, and 080221. We thank C. Emily Durbin, Ph.D., for her helpful comments on an earlier draft, and Lee Anna Clark, Ph.D. and the University of Minnesota Press for their permission to reprint reliability estimates from the SNAP manual.
Footnotes
Two CLPS studies provided data that were considered in the meta-analysis, but both focused on the stabilities of PDs assessed by diagnostic interview from baseline to 2 year follow-up. Grilo et al (2004) reported remission and stability rates for categorical and dimensional PD diagnoses and Shea et al (2002) reported one-year PD remission rates, mean symptom count changes, and rank-order PD stability.
Note that this study did not use the finalized version of the Positive Temperament and Disinhibition scales (L.A. Clark, personal communication, April 1, 2011).
These examples paraphrase actual SNAP items.
Contributor Information
Christopher J. Hopwood, Michigan State University
Leslie C. Morey, Texas A & M University
M. Brent Donnellan, Michigan State University
Douglas B. Samuel, Purdue University
Carlos M. Grilo, Yale School of Medicine
Thomas H. McGlashan, Yale School of Medicine
M. Tracie Shea, Veteran’s Affairs Medical Center, Providence RI, Warren Alpert Medical School of Brown University
Mary C. Zanarini, McLean Hospital and Harvard Medical School
John G. Gunderson, McLean Hospital and Harvard Medical School
Andrew E. Skodol, University of Arizona School of Medicine and the Sunbelt Collaborative
References
- American Psychiatric Association. Diagnostic and Statistical Manual of Mental Disorders. 4. Washington DC: Author; 2000. text revised. [Google Scholar]
- Anusic I, Lucas RE, Donnellan MB. Dependability of personality, life satisfaction, and affect in short-term longitudinal data. Journal of Personality. 2012;80:33–58. doi: 10.1111/j.1467-6494.2011.00714.x. [DOI] [PubMed] [Google Scholar]
- Ardelt M. Still stable after all these years? Personality stability theory revisited. Social Psychology Quarterly. 2000;63:392–405. [Google Scholar]
- Asendorpf JB. Beyond stability: Predicting inter-individual differences in intra- individual change. European Journal of Personality. 1992;6:103–117. [Google Scholar]
- Caspi A, Roberts BW. Personality change and continuity across the life course. In: Pervin LA, John OP, editors. Handbook of Personality Theory and Research. Vol. 2. New York: Guilford Press; 1999. pp. 300–326. [Google Scholar]
- Chmielewski M, Watson D. The heterogeneous structure of schizotypal personality disorder: Item-level factors of the schizotypal personality questionnaire and their associations with obsessive-compulsive disorder symptoms, dissociative tendencies, and normal personality. Journal of Abnormal Psychology. 2008;117:364–376. doi: 10.1037/0021-843X.117.2.364. [DOI] [PubMed] [Google Scholar]
- Chmielewski M, Watson D. What is being assessed and why it matters: The impact of transient error on trait research. Journal of Personality and Social Psychology. 2009;97:186–202. doi: 10.1037/a0015618. [DOI] [PubMed] [Google Scholar]
- Clark LA. Manual for the Schedule of Nonadaptive and Adaptive Personality. Minneapolis: University of Minnesota Press; 1993. [Google Scholar]
- Cohen J. A power primer. Psychological Bulletin. 1992;112:155–159. doi: 10.1037//0033-2909.112.1.155. [DOI] [PubMed] [Google Scholar]
- Costa PT, Jr, McCrae RR. NEO Personality Inventory-Revised Professional Manual. Odessa, FL: Psychological Assessment Resources; 1992. [Google Scholar]
- Durbin CE, Klein DN. Ten-year stability of personality disorders among outpatients with mood disorders. Journal of Abnormal Psychology. 2006;115:75–84. doi: 10.1037/0021-843X.115.1.75. [DOI] [PubMed] [Google Scholar]
- Durbin CE, Schalet BD, Hayden EP, Simpson J, Jordan PL. Hypomanic personality traits: A multi-method exploration of their association with normal and abnormal dimensions of personality. Journal of Research in Personality. 2009;43:898–905. [Google Scholar]
- Ferguson CJ. A meta-analysis of normal and disordered personality across the life span. Journal of Personality and Social Psychology. 2010;98:659–667. doi: 10.1037/a0018770. [DOI] [PubMed] [Google Scholar]
- Funder DC. Global traits: A neo-Allportian approach to personality. Psychological Science. 1991;2:31–39. [Google Scholar]
- Grilo CM, Sanislow CA, Gunderson JG, Pagano ME, Yen SY, Zanarini MC, et al. Two-year stability and change of schizotypal, borderline, avoidant, and obsessive-compulsive personality disorders. Journal of Consulting and Clinical Psychology. 2004;72:767–775. doi: 10.1037/0022-006X.72.5.767. [DOI] [PMC free article] [PubMed] [Google Scholar]
- Harkness AR, Lilienfeld SO. Individual differences science for treatment planning: Personality traits. Psychological Assessment. 1997;9:349–360. [Google Scholar]
- Harkness AR, McNulty JL. Implications of personality individual differences science for clinical work on personality disorders. In: costa PT Jr, Widiger TA, editors. Personality disorders and the five-factor model of personality. 2. Washington, DC: American Psychological Association; 2002. [Google Scholar]
- Hopwood CJ, Morey LC, Ansell EB, Grilo CM, Sanislow CA, McGlashan TH, Markowitz JC, Gunderson JG, Yen S, Shea MT, Skodol AE. The convergent and discriminant validity of five-factor traits: Current and prospective social, work, and recreational dysfunction. Journal of Personality Disorders. 2009;23(5):466–476. doi: 10.1521/pedi.2009.23.5.466. [DOI] [PMC free article] [PubMed] [Google Scholar]
- Hopwood CJ, Morey LC, Edelen MO, Shea MT, Grilo CM, Sanislow CA, McGlashan TH, Daversa MT, Gunderson JG, Zanarini MC, Markowitz JC, Skodol AE. A comparison of interview and self-report methods for the assessment of borderline personality disorder criteria. Psychological Assessment. 2008;20:81–85. doi: 10.1037/1040-3590.20.1.81. [DOI] [PubMed] [Google Scholar]
- Hopwood CJ, Newman DA, Donnellan MB, Markowitz JC, Grilo CM, Sanislow CA, McGlashan TH, Skodol AE, Shea MT, Gunderson JG, Zanarini MC, Morey LC. The stability of personality traits in individuals with borderline personality disorder. Journal of Abnormal Psychology. 2009;118:806–815. doi: 10.1037/a0016954. [DOI] [PMC free article] [PubMed] [Google Scholar]
- Hopwood CJ, Zanarini MC. Borderline personality traits and disorder: predicting prospective patient functioning. Journal of Consulting and Clinical Psychology. 2010a;78:585–589. doi: 10.1037/a0019003. [DOI] [PMC free article] [PubMed] [Google Scholar]
- Hopwood CJ, Zanarini MC. Five factor trait instability in borderline relative to other personality disorders. Personality Disorders: Theory, Research, and Treatment. 2010b;1:58–66. doi: 10.1037/a0018230. [DOI] [PMC free article] [PubMed] [Google Scholar]
- Keller MB, Lavori PW, Friedman B, Nielsen E, Endicott J, McDonald-Scott P, Andreasen NC. The Longitudinal Interval Follow-Up Evaluation: a comprehensive method for assessing outcome in prospective longitudinal studies. Archives of General Psychiatry. 1987;44:540–548. doi: 10.1001/archpsyc.1987.01800180050009. [DOI] [PubMed] [Google Scholar]
- Klonsky ED, Oltmanns TF. Informant-reports of personality disorder: Relations to self-reports and future research directions. Clinical Psychology: Science and Practice. 2002;9:300–311. [Google Scholar]
- Lucas RE, Donnellan MB. Personality development across the life span: Longitudinal analyses with a national sample from Germany. Journal of Personality and Social Psychology. 2011;101:847–861. doi: 10.1037/a0024298. [DOI] [PubMed] [Google Scholar]
- McCrae RR, Costa PT., Jr Self-concept and the stability of personality: Cross-sectional comparisons of self-reports and ratings. Journal of Personality and Social Psychology. 1982;43:1282–1292. [Google Scholar]
- McCrae RR, Costa PT., Jr The stability of personality: Observations and evaluations. Current Directions in Psychological Science. 1994;3:173–175. [Google Scholar]
- McCrae RR, Costa PT., Jr Trait explanations in personality psychology. European Journal of Personality. 1995;9:231–252. [Google Scholar]
- McCrae RR, Costa PT., Jr . Personality in Adulthood: A five-factor theory perspective. NY: The Guilford Press; 2003. [Google Scholar]
- McCrae RR, Kurtz JE, Yamagata S, Terracciano A. Internal consistency, retest reliability, and their implications for personality scale validity. Personality and Social Psychology Review. 2011;15:28–50. doi: 10.1177/1088868310366253. [DOI] [PMC free article] [PubMed] [Google Scholar]
- McGlashan TH, Grilo CM, Skodol AE, Gunderson JG, Shea MT, Morey LC, Zanarini MC, Stout RL. The Collaborative Longitudinal Personality Disorders Study: Baseline Axis I/II and II/II co-occurrence. Acta Psychiatrica Scandinavica. 2000;102:256–264. doi: 10.1034/j.1600-0447.2000.102004256.x. [DOI] [PubMed] [Google Scholar]
- McGlashan TH, Grilo CM, Sanislow CA, Ralevski E, Morey LC, Gunderson JG, Skodol AE, Shea MT, Zanarini MC, Bender D, Stout RL, Yen S, Pagano M. Two-year prevalence and stability of individual DSM-IV criteria for schizotypal, borderline, avoidant, and obsessive-compulsive personality disorders: toward a hybrid model of Axis II disorders. American Journal of Psychiatry. 2005;162:883–889. doi: 10.1176/appi.ajp.162.5.883. [DOI] [PMC free article] [PubMed] [Google Scholar]
- Meyer GJ, Viglione DJ. An introduction to Rorschach assessment. In: Archer RP, Smith SR, editors. Personality Assessment. NY: Routledge; 2008. [Google Scholar]
- Morey LC, Hopwood CJ, Gunderson JG, Skodol AE, Shea MT, Yen S, Stout RL, Zanarini MC, Grilo CM, Sanislow CA, McGlashan TH. Comparison of alternative models for personality disorders. Psychological Medicine. 2007;37:983–994. doi: 10.1017/S0033291706009482. [DOI] [PubMed] [Google Scholar]
- Morey LC, Hopwood CJ, Markowitz JC, Gunderson JG, Grilo CM, McGlashan TH, Shea MT, Yen S, Sanislow CA, Ansell EB, Skodol AE. Comparison of alternative models for personality disorders, II: 6-, 8- and 10-year follow-up. Psychological Medicine. doi: 10.1017/S0033291711002601. in press. [DOI] [PMC free article] [PubMed] [Google Scholar]
- Morey LC, Shea MT, Markowitz JC, Stout RL, Hopwood CJ, Gunderson JG, Grilo CM, McGlashan TH, Yen S, Sanislow CA, Skodol AE. State effects of major depression on the assessment of personality and personality disorder. American Journal of Psychiatry. 2010;167:528–535. doi: 10.1176/appi.ajp.2009.09071023. [DOI] [PMC free article] [PubMed] [Google Scholar]
- Peterson DR. The clinical study of social behavior. New York: Appleton-Century- Crofts; 1968. [Google Scholar]
- Roberts BW, Caspi A. Personality development and the person-situation debate: It’s déjà vu all over again. Psychological Inquiry. 2001;12:104–109. [Google Scholar]
- Roberts BW, DelVecchio WF. The rank-order consistency of personality from childhood to old age: A quantitative review of longitudinal studies. Psychological Bulletin. 2000;126:3–25. doi: 10.1037/0033-2909.126.1.3. [DOI] [PubMed] [Google Scholar]
- Roberts BW, Mroczek DK. Personality trait stability and change. Current Directions in Psychological Science. 2008;17:31–35. doi: 10.1111/j.1467-8721.2008.00543.x. [DOI] [PMC free article] [PubMed] [Google Scholar]
- Roberts BW, Walton K, Viechtbauer W. Personality changes in adulthood: Reply to Costa & McCrae (2006) Psychological Bulletin. 2006;132:29–32. doi: 10.1037/0033-2909.132.1.29. [DOI] [PubMed] [Google Scholar]
- Samuel DB, Hopwood CJ, Ansell EB, Morey LC, Sanislow CA, Markowitz JC, Yen S, Shea MT, Skodol AE, Grilo CM. The temporal stability of self-reported and interview-based personality disorder. Journal of Abnormal Psychology. doi: 10.1037/a0022647. in press. [DOI] [PMC free article] [PubMed] [Google Scholar]
- Samuel DB, Widiger TA. A meta-analytic review of the relationships between the five-factor model and DSM-IV-TR personality disorders: a facet level analysis. Clinical Psychology Review. 2008;28:1326–1342. doi: 10.1016/j.cpr.2008.07.002. [DOI] [PMC free article] [PubMed] [Google Scholar]
- Shea TM, Stout RS, Gunderson J, Morey LC, Grilo CM, McGlashan T, et al. Short-term diagnostic stability of schizotypal, borderline, avoidant, and obsessive-compulsive personality disorders. American Journal of Psychiatry. 2002;159:2036–2041. doi: 10.1176/appi.ajp.159.12.2036. [DOI] [PubMed] [Google Scholar]
- Skodol AE, Gunderson JG, McGlashan TH, Dyck IR, Stout RL, Bender DS, Grilo CM, Shea MT, Zanarini MC, Morey LC, Sanislow CA, Oldham JG. Functional Impairment in Patients with Schizotypal, Borderline, Avoidant, or Obsessive-Compulsive Personality Disorder. American Journal of Psychiatry. 2002;159:276–283. doi: 10.1176/appi.ajp.159.2.276. [DOI] [PubMed] [Google Scholar]
- Vaidya JG, Gray EK, Haig JR, Morczek DK, Watson D. Differential stability and individual growth trajectories of big five and affective traits during young adulthood. Journal of Personality and Social Psychology. 2008;76:267–304. doi: 10.1111/j.1467-6494.2007.00486.x. [DOI] [PMC free article] [PubMed] [Google Scholar]
- Weissman M, Bothwell S. The assessment of social adjustment by patient self-report. Archives of General Psychiatry. 1976;33:1111–1115. doi: 10.1001/archpsyc.1976.01770090101010. [DOI] [PubMed] [Google Scholar]
- Widiger TA. CIC, CLPS, and MSAD. Journal of Personality Disorders. 2005;19:586–593. doi: 10.1521/pedi.2005.19.5.586. [DOI] [PubMed] [Google Scholar]
- Wright AGC, Pincus AL, Lenzenweger MF. Development of personality and the remission and onset of personality pathology. Journal of Personality and Social Psychology. 2011;101:1351–1358. doi: 10.1037/a0025557. [DOI] [PMC free article] [PubMed] [Google Scholar]
- Zanarini MC, Skodol AE, Bender D, Dolan R, Sanislow C, Schaefer E, Morey LC, Grilo CM, Shea MT, McGlashan TH, Gunderson JG. The Collaborative Longitudinal Personality Disorders Study: reliability of Axis I and II diagnoses. Journal of Personality Disorders. 2000;14:291–299. doi: 10.1521/pedi.2000.14.4.291. [DOI] [PubMed] [Google Scholar]
- Zanarini MC, Frankenburg FR, Sickel AE, Yong L. The Diagnostic Interview for DSM-IV Personality Disorders (DIPD-IV) Belmont, Mass: McLean Hospital; 1996. [Google Scholar]