Abstract
Extracellular Adenosine-5′-triphosphate (ATP) is an important multi-functional molecule which can mediate numerous physiological activities by activating purinergic P2 receptors. The objective of this study was to develop a novel optical ATP sensor for in-situ extracellular ATP measurement in biological tissues. The optical ATP sensor was made by applying two layers of sol-gel coating to the end of an optical fiber probe end. The first layer contained ruthenium complex for sensing changes in oxygen concentration which resulted from oxidation of ATP by glycerol kinase and glycerol 3-phosphate oxidase entrapped in the second layer. It was demonstrated that the optical ATP sensor was capable of detecting ATP concentration at a broad range of 10−3 mM to 1.5 mM. A compensation method was established to enable the optical sensor to determine ATP concentration at different oxygen levels. This study also demonstrated the capability of ATP sensor to measure extracellular ATP content in biological tissues (i.e., porcine intervertebral disc). In addition, it was shown that the optical ATP sensor was not affected by pH and derivatives of extracellular ATP. Therefore, the newly developed optical ATP sensor is a good option for in-situ extracellular ATP measurement.
Keywords: Biosensor, ATP, Optical, Compensation methods, Ruthenium complex
INTRODUCTION
Adenosine-5′-triphosphate (ATP) is an important multi-functional molecule which was first discovered in 1929 by Karl Lohmann and has long been recognized as “the molecular unit of currency” (Knowles 1980; Lohmann 1929). ATP has two phosphate groups which release energy when hydrolyzed, and this is the energy source for the metabolic activities of ubiquitous organisms (Knowles 1980). When it is released to the extracellular environment, ATP can mediate numerous physiological activities by activating purinergic P2 receptors (ligand-gated ion channel) (Cook et al. 1997) which are widely distributed in the nervous system, muscle, bone, endothelia and epithelia (Burnstock 2000; North 2002). In the nervous system, ATP acts as a transmitter of the senses of pain (Cook et al. 1997), temperature (Souslova et al. 2000), and mechanical loading (Cockayne et al. 2000; Vlaskovska et al. 2001) by activating P2X receptors. ATP also plays an essential role in diseases, such as particular ischemia (Bush et al. 2000) and Parkinson’s disease (Przedborski and Vila 2001). In addition, ATP can initiate and modulate calcification of cartilaginous tissues (Felix and Fleisch 1976; Golub 2011; Hsu and Anderson 1996). It was found that 1 mM of ATP can promote tissue calcification, while higher ATP concentrations (e.g., 4 mM) can inhibit calcification (Hsu et al. 1999). Therefore, the sensing of extracellular ATP in-vivo has recently attracted increasing interest (Brown and Dale 2002; Schneider et al. 1999; Seminario-Vidal et al. 2009; Trautmann 2009). However, the lack of efficient direct measurement techniques limits future studies of the comprehensive role of ATP.
The luciferin-luciferase method for measuring ATP content is well known for its high sensitivity and has been widely applied for ATP analysis (Rong et al. 2003). However, it is only feasible to apply this method for ATP measurement in solution (Brown and Dale 2002). Recently, amperometric ATP biosensors were developed to detect ATP using multi-enzymatic reactions (Compagnone and Guilbault 1997; Katsu et al. 1994; Kueng et al. 2004; Llaudet et al. 2005). The biosensor containing glucose oxidase and hexokinase was able to determine ATP concentration in the presence of glucose with a detection sensitivity of 10nM (Kueng et al. 2004). In that biosensor, glucose was catalyzed by hexokinase in the presence of ATP, which reduced the production of hydrogen dioxide from oxidation of glucose by glucose oxidase. Recent studies developed amperometric ATP biosensor based on sequential enzymatic reactions of glycerol kinase (GK) and glycerol 3-phosphate oxidase (G3POX), which broke down ATP and produced hydrogen dioxide (Katsu et al. 1994; Llaudet et al. 2005). In those biosensors, ATP concentration was determined by measuring electrical current using a polarized platinum electrode which oxidized hydrogen dioxide to oxygen and water. However, since those amperometric biosensors can be affected by many other compounds that naturally exist in biological tissues such as ascorbate and glucose (Kueng et al. 2004; Llaudet et al. 2005), it could potentially be problematic when they are used for in-vivo measurements. To avoid this problem, in this study, an optical ATP biosensor was developed using an optical oxygen sensing technique, based on fluorescence quenching of excited ruthenium complexes, which determined changes in oxygen concentration during enzymatic ATP breakdown. A compensation method was also developed to enable the new ATP optical biosensor to determine ATP concentration at different oxygen levels after calibration tests.
EXPERIMENTS
Materials
1. Tetramethoxysilane (TMOS), methyltrimethoxysilane (Me-TriMOS), GK, G3POX, poly (ethylene glycol) (PEG), glycerol and Tris (4,7-diphenyl-1,10-phenanthroline) ruthenium (II) bis (hexafluorophosphate) complex were obtained from Sigma (St. Louis, MO, USA). Adenosine 5′-triphosphate sodium salt purchased from Sigma (St. Louis, MO, USA) was used for making standard solution. Cyanoacrylate glue was obtained from Pacer Technology (Rancho Cucamonga, CA, USA). NeoFox phase measurement systems were purchased from Ocean Optic Co. (Dunedin, FL, USA). L-ascorbic acid was purchased from Sigma (St. Louis, MO, USA).
Fabrication of ATP optical sensor
(a) Chemical mechanism
The mechanism of the ATP optical biosensor developed in this study was based on the following sequence of enzymatic reactions (Murphy and Galley 1994):
| (1) |
| (2) |
As shown in these enzymatic reactions, ATP can be catalyzed by GK to ADP in the presence of glycerol and yields glycerol-3-phosphatewhich is further oxidized into dihydroxyacetone phosphate by G3POX. During the second chemical reaction, oxygen is consumed. Therefore, the ATP concentration can be determined by measuring changes in oxygen concentration.
(b) Design of the ATP optical sensor
The ATP biosensor was fabricated by coating two sol-gel layers on the tip of an optical fiber (Figure 1). In the first layer (i.e., oxygen sensing layer), ruthenium complexes were entrapped in silicate matrix which was fixed to the end of the optical fiber using cyanoacrylate glue (Figure 1). This layer was used to detect change in oxygen concentration. On the top of the first layer, a layer of silicate matrix containing G3POX and GK was coated (i.e., enzyme layer), yielding the ATP optical biosensor. Glycerol and PEG were also included in the silicate matrix to stabilize the activity of the enzymes (Llaudet et al. 2005). During the measurement, a semi-permeable silicate matrix allowed ATP to diffuse into the enzyme layer and induce enzymatic reactions described in the reactions (1) and (2). Since, due to chemical reactions, change in the oxygen concentration in silicate matrix can alter the quenching of ruthenium complexes and thus change the decay time of fluorescence emission (Lakowicz 2006; Lippitsch et al. 1988). ANeoFox® phase measurement system was used to determine the decay time of fluorescence emission of ruthenium complexes in this study. The precision of decay time measurement is 0.000084μs. To test and calibrate the ATP sensor, a linear relationship between the inverse of decay time and the standard ATP concentration was examined (see the section of calibration test).
Figure 1.
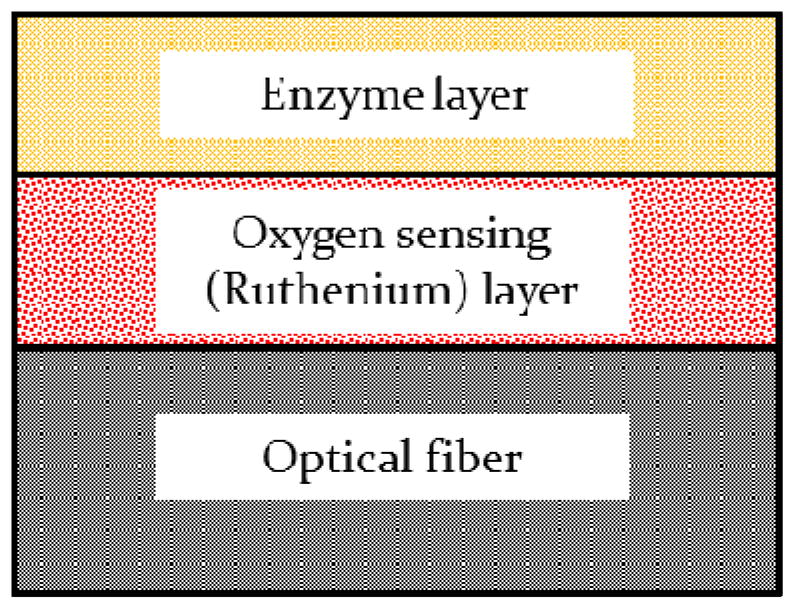
Cross sectional view of the ATP sensor
(c) Preparation of the oxygen sensing layer
The oxygen sensing layer was prepared based on a modified version of the protocols previously described in literature (McEvoy et al. 1996; McNamara et al. 1998; Xiong et al. 2010). Briefly, a silicate solution was made by mixing 7μl of MeTri MOS, 13 μl of TMOS, 60μl of de-ionized water and 1μl of 40mM HCl. The ratio of the reagents is essential for coating pore size and morphology. Then the silicate solution was sonicated for at least 15 minutes and stirred for 1 hour. These processes are critical to yield a firm and crack-free coating layer. A solution of ruthenium complexes was made by dissolving ruthenium complexes in methanol (5.4 μg/μl). This ruthenium complex solution was mixed with equal amounts of the silicate solution and phosphate buffer solution (PBS) at pH 7.5. Immediately after applying a very thin layer of cyanoacrylate glue on the end of the optical fiber, one microliter of the ruthenium complex-silicate mixture was spread on the top of the cyanoacrylate glue layer. Cyanoacrylate glue was used to provide a firm adhesion of the ruthenium complex-silicate layer on the optical fiber and prevent detachment of the coating during measurement. The coated optical fiber was left in ambient condition for 10 minutes before being stored at 4°Covernight. Once the coating became solid, the probe was ready for coating the second enzyme layer or was used for measurement of oxygen concentration.
(d) Preparation of the enzyme layer
Similar to the oxygen sensing layer, a silicate solution was prepared as described in the previous section and used to entrap enzymes in the second layer (Figure 1). GK and G3POX were dissolved in PBS with a supplement of PEG and glycerol. The enzyme concentration depends on the ATP concentration range to be measured, varying from 500–1500 units/ml of each. PEG is well known for its ability to form crosslinks (Kulkarni et al. 2005) which help to immobilize enzymes and maintain enzymatic activities. The silicate solution and the enzyme solution were then mixed at a 1:1 ratio. One microliter of the enzyme-silicate mixture was immediately spread on top of the oxygen sensing layer to complete the ATP biosensor. The biosensor was ready for ATP measurement after overnight storage in a 4°C environment away from light. To maintain enzymatic activity, the biosensor was stored in PBS with 2 mM glycerol after re-hydration.
Calibration test of the ATP sensor
Oxygen sensing is based on the fluorescence quenching of ruthenium complex in the presence of oxygen which can be described by the Stern-Volmer equation:
| (3) |
where τ0 and τ are the decay times in the absence and presence of oxygen, respectively, Ksv is the Stern-Volmer quenching constant, and [O2] is the oxygen concentration. The decrease in the oxygen concentration (Δ[O2]) due to the enzymatic reactions was assumed to be linearly proportional to the ATP concentration ([ATP]):
| (4) |
where k is the enzymatic reaction parameter which is a function of initial oxygen level and enzyme concentration. In the presence of ATP, the quenching of ruthenium complex in the coating can be described by:
| (5) |
When the reference oxygen level ([O2]) and the enzyme concentration in the coating remain constant, the enzymatic reaction parameter k can be assumed to be a constant. Based on Eq. 5, a linear relationship between the inverse of decay time and the ATP concentration can be derived as:
| (6) |
where and .
In the calibration test, the ATP biosensor was connected to the NeoFox phase measurement system which determined the decay time of fluorescence emission at the wavelength of 600 nm by exciting ruthenium complexes with an impulse light (44 kHz) at the wavelength of 465 nm. The resolution of decay time measurement was 10−4 sec. The biosensor was immersed in the PBS containing 2 mM glycerol in a beaker. A magnetic stirring bar was used to stir the solution to distribute all solutes uniformly. After a reference decay time was established, a stock ATP solution of 1 mM was added to achieve designated ATP concentrations in the PBS. The decay time was measured for individual ATP concentrations to determine the linear relationship described in Eq. 6. The stability of the ATP sensor was also studied. The responses of three sensors to zero and 200 μM ATP were measured for five consecutive days. The sensors were stored in PBS contain 2 mM glycerol at 4°C between measurements. The stability of the ATP sensor was analyzed by comparing the difference in the inverse of decay time between the responses to zero and 200 μM ATP.
Examination of the effects of pH on the ATP biosensor
pH in biological tissues may be different from that in the in-vitro calibration condition. This difference may affect the in-situ measurement of the biosensor. Therefore, it is necessary to either calibrate the biosensor under the same conditions as biological tissues or develop a method to compensate for the possible effect that might be introduced by the difference in pH. In this study, the effect of pH on the biosensor measurement was examined by adding an acidic solution to alter the pH in the PBS solution during the calibration test described in the previous section. Then, the measurements of the ATP biosensor at different pH was recorded and normalized for comparison.
Examination of the effects of ADP, AMP, adenosine, and ascorbate on the ATP biosensor
Extracellular ATP is often hydrolyzed into ADP, AMP, or adenosine by ectonucleotidases (Meghji et al. 1992). Those adenine nucleotides may coexist with ATP in biological tissues. In addition, previous study showed that ascorbate affects ATP measurement of amperometric biosensors (Katsu et al. 1994; Kueng et al. 2004; Llaudet et al. 2005). Therefore, the effects of ADP, AMP, adenosine and ascorbate on the ATP biosensor were examined on three sensors in this study.
Compensation of the ATP biosensor under different oxygen levels
As described in Eq. 6, a linear relationship between the inverse of decay time and the ATP concentration can be established at the same initial oxygen level. Due to differences in tissue material properties, tissue oxygenation varies among different biological tissues. In order to measure ATP concentration under different oxygen levels, a compensation method was developed based on the following mathematical background. It was assumed that the chemical reaction parameter k in Eq. 6 is a function of the oxygen level [O2]:
| (7) |
where C and D are the material constants. After Ksv, τ0, C, and D are experimentally determined, Eq. 6 can be used to determine the ATP concentration (i.e., [ATP]) based on the measurements of the oxygen level (i.e., [O2]) and the delay time (i.e., τ). To test this compensation method, Ksv, τ0, C, and D for the ATP biosensor were determined from two calibration tests conducted at the oxygen levels of 10% and 20%. Experimental data obtained from another calibration test at the oxygen level of 15% were used to verify the compensation method. An oxygen regulated incubator was used to provide desired oxygen conditions.
In situ measurement of extracellular ATP in porcine intervertebral disc
To test the capability of the ATP biosensor to measure ATP level in biological tissue, the measurement of extracellular ATP was performed on lumbar intervertebral discs of 12 month-old pigs obtained within 3 hours of sacrifice. Functional spinal units (FSUs) were isolated as described in our previous study (Fernando et al. 2011). The harvested FSUs were then placed and cultured in custom built chambers overnight at 37°C with continuous circulation of culture medium. After overnight culture, a transversal cut was made at the mid-disc height of the FSUs and the nucleus pulposus region was exposed to the ambient condition (20% oxygen level). In order to avoid temperature effect, the ATP measurement was performed using the ATP biosensor when the temperature of the tissues was reduced to the same level as the calibration test of the sensors (i.e., ambient temperature). The temperature of tissues was monitored using a thermometer. An extra sensor was prepared without the second enzyme layer for determining in-situ oxygen level at the same locations. Calibration of the sensors was performed at the oxygen levels of 10% and 20%. In addition, based on our pilot study, the decay time returned to original value at zero ATP level after the sensors were washed in PBS solution with stirring for 10 minutes between measurements. This was applied to prevent carry over effect.
RESULTS
Calibration test of the ATP biosensor
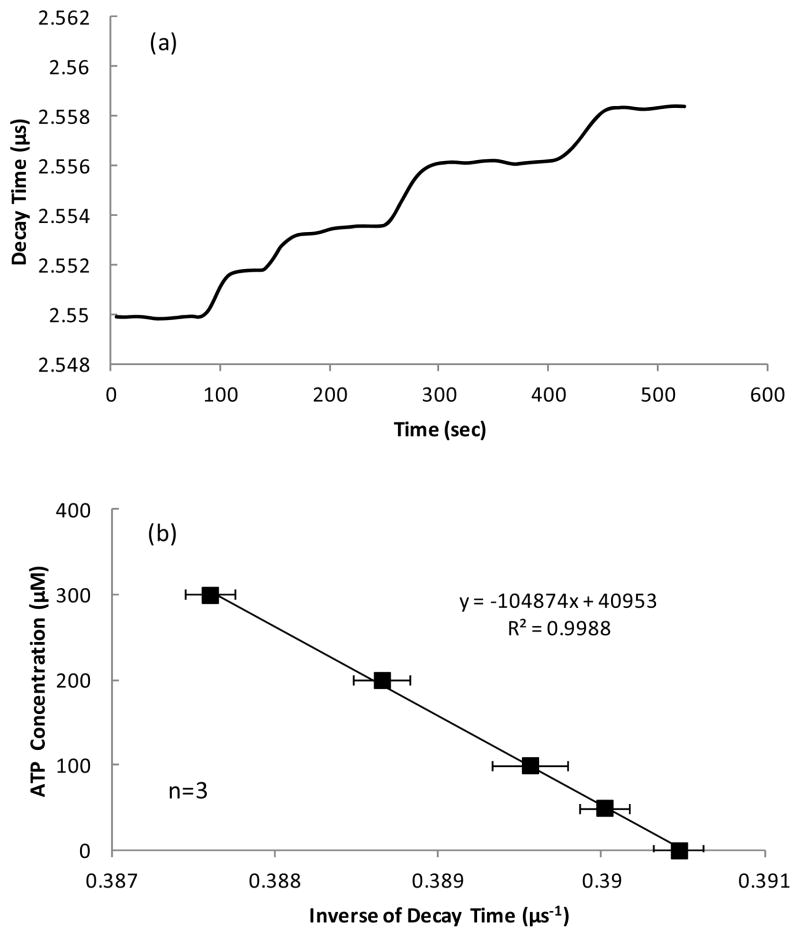
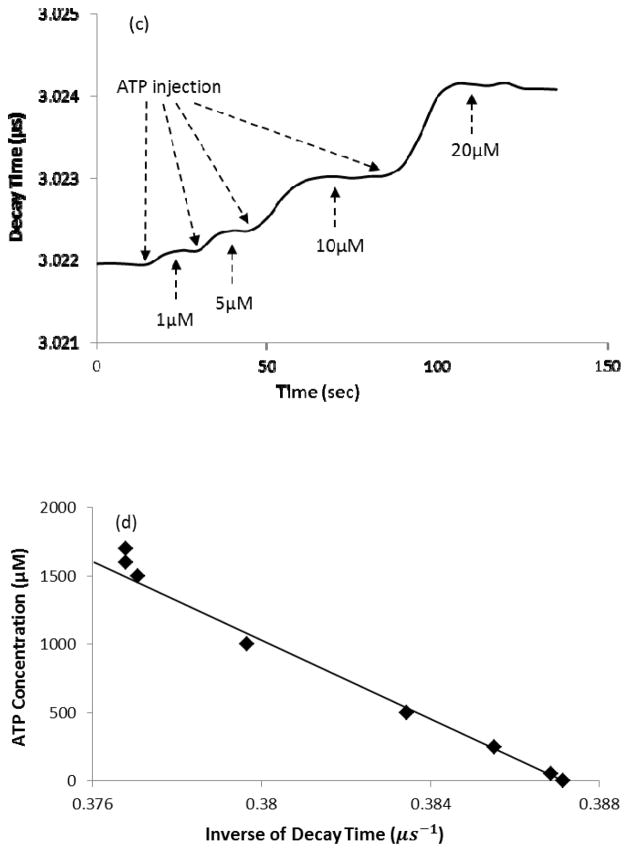
In the calibration test, when ATP diffused into the enzyme layer of the biosensor, catalysis of ATP decreased local oxygen concentration and thus increased the decay time of fluorescence emitted by theruthenium complexes. Typical response and calibration curve of the ATP biosensor for different ATP concentrations are shown in Figure 2. The rising part of the decay time in the response curve of the ATP biosensor reflected diffusion of ATP into the enzyme layer and initiation of the chemical reactions which reduced the local oxygen partial pressure to a certain level (Figure 2a). The inverse of decay time was linearly proportional to the ATP concentration (Figure 2b) as described in Eq. 6. As shown in Figure 2b, the calibration was performed 3 times within 6 hours and small standard deviations indicated the sensor had a good repeatability. By changing the concentration of enzymes, the ATP sensor can be used for different measuring ranges. Based on our experiments, the ATP biosensor had a low detecting limit of 10−3 mM (Figure 2c) and saturated at 1.5 mM (Figure 2d).
Figure 2.
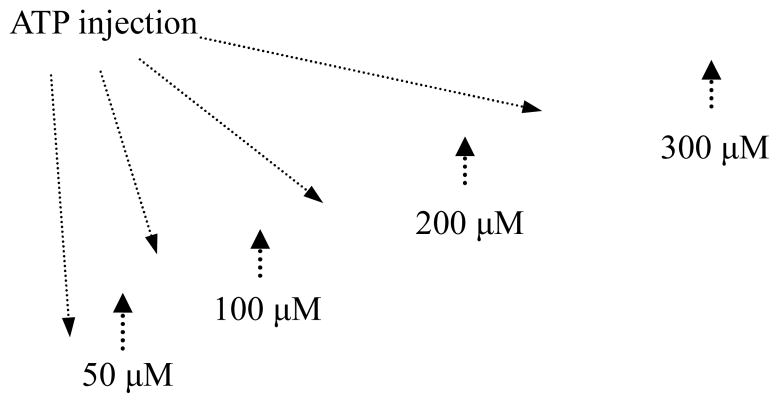
(a) A typical decay time curve of the ATP sensor in response to the ATP concentrations of 50, 100, 200, and 300 μM and (b) the corresponding calibration curve (mean values ± standard deviation); (c) A typical sensor response at low ATP levels (1, 5, 10 and 20 μM) and (d) a representative calibration curve showing a linear relationship between the inverse of decay time and the ATP concentration up to 1.5 mM.
The effects of ADP, AMP, adenosine, ascorbate and pH on the ATP biosensor
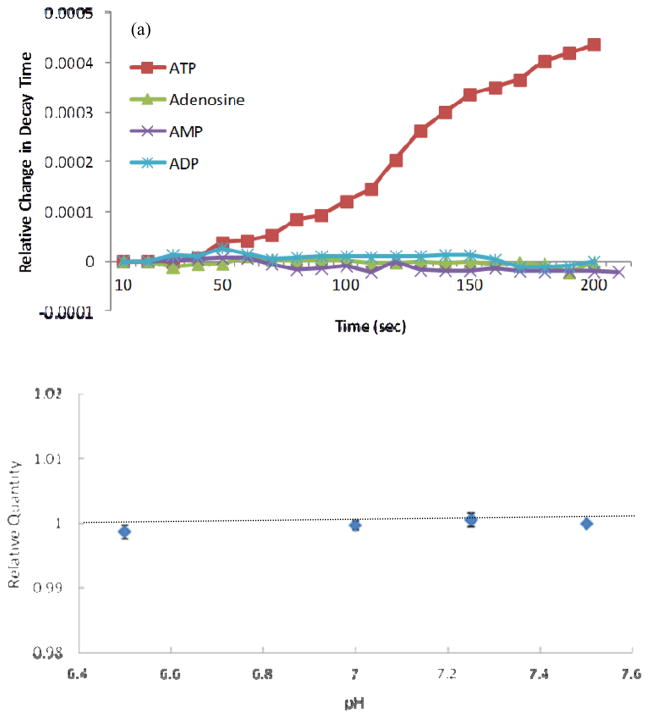
To examine the effect of ADP, AMP, and adenosine, three ATP biosensors were first equilibrated in the PBS solution without ATP and other adenine nucleotides and then a stock solution of either ADP, AMP, or adenosine was added to a final concentration of 200 mM in the PBS and the decay time was recorded. It was found that the ATP biosensors developed in this study exhibited no responses to adenosine, AMP and ADP (Figure 3a). Similarly, ascorbate (400 μM) did not exhibit any effect on the ATP biosensors (data not shown).
Figure 3.
(a) The typical reaction of the ATP sensor to ADP, AMP and adenosine of 200 μM compared to ATP of 100 μM; (b) Normalized signal of the ATP sensor in response to 100 μM ATP at different pH conditions (n=3). The data were normalized to the response at pH 7.5 and are expressed as mean values ± standard deviation in (b).
For the pH test, the responses of three ATP biosensors were tested at the ATP concentration of 100 μM. The values of pH were chosen based on pH in the normal organism tissues which mostly varies from 6.5–7.5 (Gerweck and Seetharaman 1996). No significant effects of pH were found on the ATP biosensors (Figure 3b). This is consistent with the previous study (Llaudet et al. 2005).
Compensation of the ATP biosensor under different oxygen levels
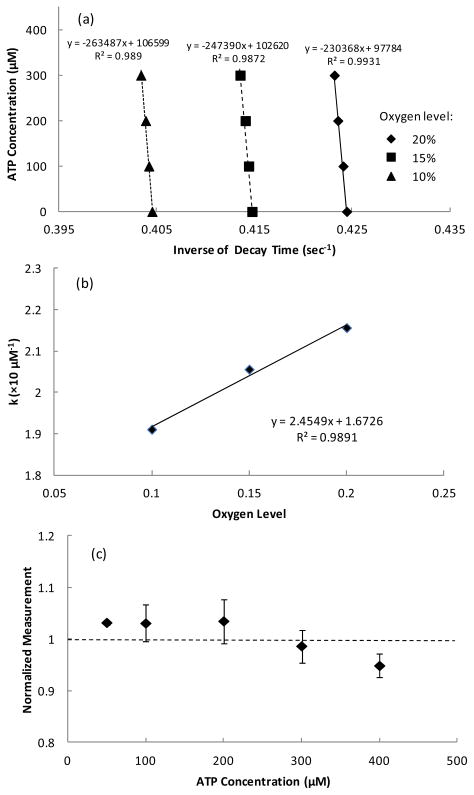
To verify the compensation method proposed in this study, Ksv, τ0, C, and D for the ATP biosensor determined from the calibration tests at oxygen levels of 10% and 20% were used to predict the experimental data obtained at the oxygen level of 15% (Figure 4a). After the parameter A (the slope of calibration curve) at different oxygen levels was determined from the calibration tests (Figure 4a) and the decay times obtained at zero ATP concentration from different oxygen levels were used to determine Ksv and τ0 using Eq. 3, the parameter k was calculated based on Eq. 6. A linear relationship between the parameter k and the oxygen concentration was found between 10% and 20% oxygen levels (Figure 4b) as described in Eq. 7. Furthermore, the errors in the ATP measurement by the compensation method for the oxygen level of 15% were found to be less than 5% at different ATP levels (Figure 4c).
Figure 4.
(a) Typical calibration curves obtained at different oxygen concentration and (b) the corresponding linear relationship between the parameter k and oxygen concentration. (c) Accuracy of the oxygen compensation method on determination of ATP concentration at 15% oxygen level using the parameters obtained from the calibration tests at 10% and 20% oxygen levels (n=3). The data were normalized to the corresponding ATP concentration and expressed as mean values ± standard deviation in (c).
Sensor Stability
The responses of three sensors to 200 μM ATP solution were examined for five consecutive days. The signal strength of florescence, which is defined as the difference between the inverse of decay times measured at 0 and 200 μM ATP, gradually decreased and fell to about 65% at day 5 compared to day 1 (Figure 5). This may mainly attribute to the diffuse out of enzyme loosely entrapped at the top of the coating layer (Kueng et al. 2004).
Figure 5.
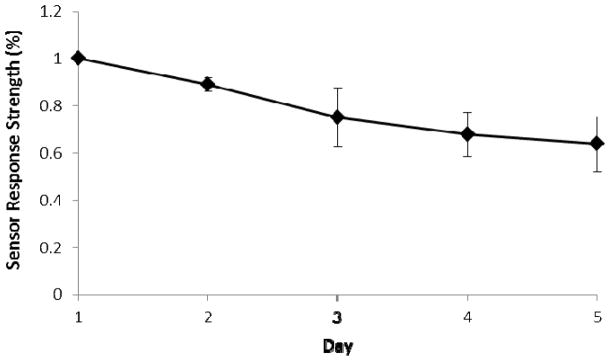
Stability of the ATP biosensor. The signal strength of floresscence is defined as the difference between the inverse of decay times measured at 0 and 200 μM ATP. The data are expressed as mean values ± standard deviation.
Measurement of extracellular ATP in porcine intervertebral disc
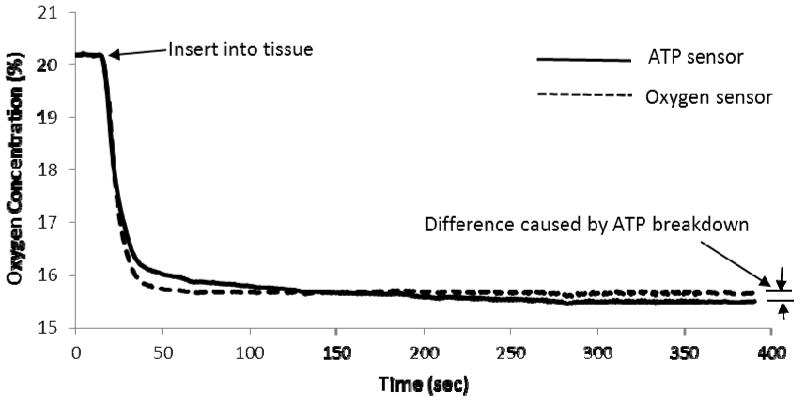
Typical responses of the oxygen and ATP sensors during the extracellular ATP measurement in the nucleus pulposus region of the porcine intervertebral disc were shown in Figure 6. After the tissue was exposed to the ambient condition (i.e., 20% oxygen) for a certain time (about 10 min), the oxygen level was still less than the ambient oxygen level (20%)(Figure 6). The differences in oxygen measurement between the ATP and oxygen sensors indicated oxygen consumption by enzymatic ATP breakdown and were used to determine ATP concentration using Eq. 4 with k determined from the calibration tests at 10% and 20% oxygen levels. The extracellular ATP concentration in the nucleus pulposus region of the porcine intervertebral disc was 190 ± 30 μM (n=3).
Figure 6.
Typical responses of the oxygen and ATP sensors during the extracellular ATP measurement in the porcine intervertebral disc.
DISCUSSION
This study successfully developed a new optical biosensor for in-situ ATP measurement, which was demonstrated by the calibration test and the extracellular ATP measurement in theporcine intervertebral disc. The optical ATP biosensor utilizes the principle of fluorescence emission of ruthenium complexes which does not exhibit any common electro active interferences by naturally occurring compounds (e.g., ascorbate) as described in previous studies of amperometric biosensors (Katsu et al. 1994; Kueng et al. 2004; Llaudet et al. 2005). Therefore, the optical ATP biosensor provides a good alternative method for ATP measurements especially for in-vivo and in-situ measurements.
When the optical ATP biosensor is immersed in a solution containing certain ATP levels, ATP diffuses into the coating layer through the microspores and is catalyzed by enzymes. The process of diffusion is driven by a concentration gradient. Since the concentration gradient is determined by normalizing the concentration difference between the solution and the enzyme layer of the ATP biosensor by the thickness of coating, the response time of the biosensor inversely depends on the coating thickness. Therefore, the response of the ATP biosensor can be further improved by decreasing the thickness of coating. Furthermore, since the rate of oxygen consumption in the enzymatic reactions depends on the concentration of enzymes, the sensitivity of the ATP biosensor can be enhanced by increasing the enzyme concentration in the coating layer.
In the extracellular ATP measurement of porcine intervertebral discs, the oxygen level in the tissue still remained low (Figure 6) after the temperature of the tissue was equilibrated with the ambient condition (i.e., 25°C and 20%oxygen level). It suggested that the oxygen solubility in biological tissues is different from the condition in the calibration test. Therefore, the oxygen compensation method established in the study is a key component for precise in-situ ATP measurement. By using this method, the optical ATP biosensor was able to determine the extracellular ATP content in the intervertebral disc.
The ambient air temperature for calibration is often around 25 °C and the body temperature is around 37 °C. Since the principle of oxygen sensing using ruthenium complexes involves energy transfer, previous studies have demonstrated that Stern-Volmer quenching constant (Ksv) and τ0 are dependent on temperature (Lakowicz 2006; Morris et al. 2007). In addition, the enzyme activities could be affected by temperature. Therefore, the temperature effects on k, τ0 and Ksv need to be compensated if the temperature at the measurement sites is different from that in the calibration test.
Luciferin-luciferase assay has long been used for determining the extracellular ATP content (Leach 1981). This method has many advantages such as ability to detect ATP at low concentration (Spielmann et al. 1981). However, luciferin-luciferase assay also requires strict conditions and operations and many factors can cause contamination to the assay which limits its application in in-vivo/in situ measurements. Additionally, luciferin-luciferase assay is not feasible for real time monitoring ATP content change (Lundin 2000). Electrochemical ATP sensors with high sensitivity were developed by other researchers (Kueng et al. 2004; Llaudet et al. 2005). However, these sensors measured ATP by detecting current produced during chemical reaction and thus can be affected by other charged molecules such as ascorbic acid and urinate (Miele and Fillenz 1996). For example, ascorbate has an concentration range of 200–400 mM in human tissue and can generate up to 100 nA of current when using an electrode with 0.5 mm length and 50 μm diameter (Llaudet et al. 2005; Rice 2000). In addition, the chemical reaction required in electrochemical ATP sensors may be affected by substances in body tissues. For instance, the ATP sensor developed by Kueng et al. requires glucose to be present at a known concentration. In human tissues, however, glucose content varies from different tissue and at different time points during a day (Daly et al. 1998; Maggs et al. 1995). These factors make electrochemical ATP sensors difficult to be used for in vivo/in situ ATP measurement. The design of our sensor, however, has advantages in in vivo/in situ ATP measurement and potential for real time monitoring changes in ATP level. Furthermore, it was reported that that extracellular ATP concentration can reach several hundred micromolars at tumor interstitium (Pellegatti et al. 2008), while extracellular ATP concentrations are around 4 mM in rabbit central nervous system during systematic inflammatory response (Gourine et al. 2007). Therefore, the new ATP sensor developed in our study can be used to monitor ATP level in those in-vivo conditions.
CONCLUSION
A new optical ATP biosensor was successfully developed with less chemical interferences. The compensation method was also established to enable the new biosensor to detect ATP at different oxygen levels. This study demonstrated that the newly developed optical biosensor is feasible for in-situ extracellular ATP measurement.
Highlights.
A novel ATP biosensor developed based on optical oxygen sensing technique and enzymatic ATP breakdown.
The new biosensor can detect the ATP concentrations ranged from 10−3 mM to 1.5 mM.
A compensation method for different oxygen levels was proposed and tested.
An in situ measurement of extracellular ATP level in intervertebral disc was presented.
Acknowledgments
This study was supported by the grant (AR056101) from the NIH. The authors would like to thank Dr. Weiyong Gu for providing a NeoFox® system for this study.
Footnotes
Publisher's Disclaimer: This is a PDF file of an unedited manuscript that has been accepted for publication. As a service to our customers we are providing this early version of the manuscript. The manuscript will undergo copyediting, typesetting, and review of the resulting proof before it is published in its final citable form. Please note that during the production process errors may be discovered which could affect the content, and all legal disclaimers that apply to the journal pertain.
References
- Brown P, Dale N. Spike-independent release of ATP from Xenopus spinal neurons evoked by activation of glutamate receptors. The Journal of physiology. 2002;540(Pt 3):851–860. doi: 10.1113/jphysiol.2001.013193. [DOI] [PMC free article] [PubMed] [Google Scholar]
- Burnstock G. P2X receptors in sensory neurones. British journal of anaesthesia. 2000;84(4):476–488. doi: 10.1093/oxfordjournals.bja.a013473. [DOI] [PubMed] [Google Scholar]
- Bush KT, Keller SH, Nigam SK. Genesis and reversal of the ischemic phenotype in epithelial cells. The Journal of clinical investigation. 2000;106(5):621–626. doi: 10.1172/JCI10968. [DOI] [PMC free article] [PubMed] [Google Scholar]
- Cockayne DA, Hamilton SG, Zhu QM, Dunn PM, Zhong Y, Novakovic S, Malmberg AB, Cain G, Berson A, Kassotakis L, Hedley L, Lachnit WG, Burnstock G, McMahon SB, Ford APDW. Urinary bladder hyporeflexia and reduced pain-related behaviour in P2X(3)-deficient mice. Nature. 2000;407(6807):1011–1015. doi: 10.1038/35039519. [DOI] [PubMed] [Google Scholar]
- Compagnone D, Guilbault GG. Glucose oxidase/hexokinase electrode for the determination of ATP. Anal Chim Acta. 1997;340(1–3):109–113. [Google Scholar]
- Cook SP, Vulchanova L, Hargreaves KM, Elde R, McCleskey EW. Distinct ATP receptors on pain-sensing and stretch-sensing neurons. Nature. 1997;387(6632):505–508. doi: 10.1038/387505a0. [DOI] [PubMed] [Google Scholar]
- Daly ME, Vale C, Walker M, Littlefield A, Alberti KG, Mathers JC. Acute effects on insulin sensitivity and diurnal metabolic profiles of a high-sucrose compared with a high-starch diet. The American journal of clinical nutrition. 1998;67(6):1186–1196. doi: 10.1093/ajcn/67.6.1186. [DOI] [PubMed] [Google Scholar]
- Felix R, Fleisch H. Pyrophosphatase and ATPase of isolated cartilage matrix vesicles. Calcified tissue research. 1976;22(1):1–7. doi: 10.1007/BF02010340. [DOI] [PubMed] [Google Scholar]
- Fernando HN, Czamanski J, Yuan TY, Gu WY, Salahadin A, Huang CYC. Mechanical Loading Affects the Energy Metabolism of Intervertebral Disc Cells. Journal of Orthopaedic Research. 2011;29(11):1634–1641. doi: 10.1002/jor.21430. [DOI] [PMC free article] [PubMed] [Google Scholar]
- Gerweck LE, Seetharaman K. Cellular pH gradient in tumor versus normal tissue: Potential exploitation for the treatment of cancer. Cancer Res. 1996;56(6):1194–1198. [PubMed] [Google Scholar]
- Golub EE. Biomineralization and matrix vesicles in biology and pathology. Seminars in immunopathology. 2011;33(5):409–417. doi: 10.1007/s00281-010-0230-z. [DOI] [PMC free article] [PubMed] [Google Scholar]
- Gourine AV, Dale N, Llaudet E, Poputnikov DM, Spyer KM, Gourine VN. Release of ATP in the central nervous system during systemic inflammation: real-time measurement in the hypothalamus of conscious rabbits. J Physiol-London. 2007;585(1):305–316. doi: 10.1113/jphysiol.2007.143933. [DOI] [PMC free article] [PubMed] [Google Scholar]
- Hsu HH, Anderson HC. Evidence of the presence of a specific ATPase responsible for ATP-initiated calcification by matrix vesicles isolated from cartilage and bone. The Journal of biological chemistry. 1996;271(42):26383–26388. doi: 10.1074/jbc.271.42.26383. [DOI] [PubMed] [Google Scholar]
- Hsu HH, Camacho NP, Anderson HC. Further characterization of ATP-initiated calcification by matrix vesicles isolated from rachitic rat cartilage. Membrane perturbation by detergents and deposition of calcium pyrophosphate by rachitic matrix vesicles. Biochimica et biophysica acta. 1999;1416(1–2):320–332. doi: 10.1016/s0005-2736(98)00235-1. [DOI] [PubMed] [Google Scholar]
- Katsu T, Yang XR, Rechnitz GA. Amperometric Biosensor for Adenosine-5′-Triphosphate Based on a Platinum-Dispersed Carbon-Paste Enzyme Electrode. Anal Lett. 1994;27(7):1215–1224. [Google Scholar]
- Knowles JR. Enzyme-catalyzed phosphoryl transfer reactions. Annual review of biochemistry. 1980;49:877–919. doi: 10.1146/annurev.bi.49.070180.004305. [DOI] [PubMed] [Google Scholar]
- Kueng A, Kranz C, Mizaikoff B. Amperometric ATP biosensor based on polymer entrapped enzymes. Biosens Bioelectron. 2004;19(10):1301–1307. doi: 10.1016/j.bios.2003.11.023. [DOI] [PubMed] [Google Scholar]
- Kulkarni AR, Hukkeri VI, Sung HW, Liang HF. A novel method for the synthesis of the PEG-crosslinked chitosan with a pH-independent swelling behavior. Macromol Biosci. 2005;5(10):925–928. doi: 10.1002/mabi.200500048. [DOI] [PubMed] [Google Scholar]
- Lakowicz JR. Principles of fluorescence spectroscopy. 3. Springer; New York: 2006. [Google Scholar]
- Leach FR. ATP determination with firefly luciferase. J Appl Biochem. 1981;3(51):7. [Google Scholar]
- Lippitsch ME, Pusterhofer J, Leiner MJP, Wolfbeis OS. Fibre-Optic Oxygen Sensor with the Fluorescence Decay Time as the Information Carrier. Anal Chim Acta. 1988;205(1–2):1–6. [Google Scholar]
- Llaudet E, Hatz S, Droniou M, Dale N. Microelectrode biosensor for real-time measurement of ATP in biological tissue. Analytical chemistry. 2005;77(10):3267–3273. doi: 10.1021/ac048106q. [DOI] [PubMed] [Google Scholar]
- Lohmann K. Über die Pyrophosphatfraktion im Muskel. Naturwissenschaften. 1929;17(31):624–625. [Google Scholar]
- Lundin A. Methods in Enzymology. Academic Press; 2000. Use of firefly luciferase in at p-related assays of biomass, enzymes, and metabolites; pp. 346–370. [DOI] [PubMed] [Google Scholar]
- Maggs DG, Jacob R, Rife F, Lange R, Leone P, During MJ, Tamborlane WV, Sherwin RS. Interstitial fluid concentrations of glycerol, glucose, and amino acids in human quadricep muscle and adipose tissue. Evidence for significant lipolysis in skeletal muscle. The Journal of clinical investigation. 1995;96(1):370–377. doi: 10.1172/JCI118043. [DOI] [PMC free article] [PubMed] [Google Scholar]
- McEvoy AK, McDonagh CM, MacCraith BD. Dissolved oxygen sensor based on fluorescence quenching of oxygen-sensitive ruthenium complexes immobilized in sol-gel-derived porous silica coatings. The Analyst. 1996;121(6):785–788. [Google Scholar]
- McNamara KP, Li XP, Stull AD, Rosenzweig Z. Fiber-optic oxygen sensor based on the fluorescence quenching of tris (5-acrylamido, 1,10 phenanthroline) ruthenium chloride. Anal Chim Acta. 1998;361(1–2):73–83. [Google Scholar]
- Meghji P, Pearson JD, Slakey LL. Regulation of extracellular adenosine production by ectonucleotidases of adult rat ventricular myocytes. The American journal of physiology. 1992;263(1 Pt 2):H40–47. doi: 10.1152/ajpheart.1992.263.1.H40. [DOI] [PubMed] [Google Scholar]
- Miele M, Fillenz M. In vivo determination of extracellular brain ascorbate. Journal of neuroscience methods. 1996;70(1):15–19. doi: 10.1016/S0165-0270(96)00094-5. [DOI] [PubMed] [Google Scholar]
- Morris KJ, Roach MS, Xu WY, Demas JN, DeGraff BA. Luminescence lifetime standards for the nanosecond to microsecond range and oxygen quenching of ruthenium (II) complexes. Analytical chemistry. 2007;79(24):9310–9314. doi: 10.1021/ac0712796. [DOI] [PubMed] [Google Scholar]
- Murphy LJ, Galley PT. Measurement in-Vitro of Human Plasma Glycerol with a Hydrogen-Peroxide Detecting Microdialysis Enzyme Electrode. Analytical chemistry. 1994;66(23):4345–4353. doi: 10.1021/ac00095a035. [DOI] [PubMed] [Google Scholar]
- North RA. Molecular physiology of P2X receptors. Physiological reviews. 2002;82(4):1013–1067. doi: 10.1152/physrev.00015.2002. [DOI] [PubMed] [Google Scholar]
- Pellegatti P, Raffaghello L, Bianchi G, Piccardi F, Pistoia V, Di Virgilio F. Increased Level of Extracellular ATP at Tumor Sites: In Vivo Imaging with Plasma Membrane Luciferase. Plos One. 2008;3(7) doi: 10.1371/journal.pone.0002599. [DOI] [PMC free article] [PubMed] [Google Scholar]
- Przedborski S, Vila M. MPTP: a review of its mechanisms of neurotoxicity. Clin Neurosci Res. 2001;1(6):407–418. [Google Scholar]
- Rice ME. Ascorbate regulation and its neuroprotective role in the brain. Trends in neurosciences. 2000;23(5):209–216. doi: 10.1016/s0166-2236(99)01543-x. [DOI] [PubMed] [Google Scholar]
- Rong WF, Gourine AV, Cockayne DA, Xiang ZH, Ford APDW, Spyer KM, Burnstock G. Pivotal role of nucleotide P2X(2) receptor subunit of the ATP-gated ion channel mediating ventilatory responses to hypoxia. J Neurosci. 2003;23(36):11315–11321. doi: 10.1523/JNEUROSCI.23-36-11315.2003. [DOI] [PMC free article] [PubMed] [Google Scholar]
- Schneider SW, Egan ME, Jena BP, Guggino WB, Oberleithner H, Geibel JP. Continuous detection of extracellular ATP on living cells by using atomic force microscopy. Proceedings of the National Academy of Sciences of the United States of America. 1999;96(21):12180–12185. doi: 10.1073/pnas.96.21.12180. [DOI] [PMC free article] [PubMed] [Google Scholar]
- Seminario-Vidal L, Lazarowski ER, Okada SF. Assessment of extracellular ATP concentrations. Methods Mol Biol. 2009;574:25–36. doi: 10.1007/978-1-60327-321-3_3. [DOI] [PubMed] [Google Scholar]
- Souslova V, Cesare P, Ding YN, Akopian AN, Stanfa L, Suzuki R, Carpenter K, Dickenson A, Boyce S, Hill R, Nebenius-Oosthuizen D, Smith AJH, Kidd EJ, Wood JN. Warm-coding deficits and aberrant inflammatory pain in mice lacking P2X(3) receptors. Nature. 2000;407(6807):1015–1017. doi: 10.1038/35039526. [DOI] [PubMed] [Google Scholar]
- Spielmann H, Jacob-Müller U, Schulz P. Simple assay of 0.1–1.0 pmol of ATP, ADP, and AMP in single somatic cells using purified luciferin luciferase. Anal Biochem. 1981;113(1):172–178. doi: 10.1016/0003-2697(81)90061-0. [DOI] [PubMed] [Google Scholar]
- Trautmann A. Extracellular ATP in the immune system: more than just a “danger signal”. Science signaling. 2009;2(56):pe6. doi: 10.1126/scisignal.256pe6. [DOI] [PubMed] [Google Scholar]
- Vlaskovska M, Kasakov L, Rong WF, Bodin R, Bardini M, Cockayne DA, Ford APDW, Burnstock G. P2X(3) knock-out mice reveal a major sensory role for urothelially released ATP. J Neurosci. 2001;21(15):5670–5677. doi: 10.1523/JNEUROSCI.21-15-05670.2001. [DOI] [PMC free article] [PubMed] [Google Scholar]
- Xiong Y, Xu J, Zhu DQ, Duan CF, Guan YF. Fiber-optic fluorescence sensor for dissolved oxygen detection based on fluorinated xerogel immobilized with ruthenium (II) complex. J Sol-Gel Sci Techn. 2010;53(2):441–447. [Google Scholar]


