

Abstract
Placental trophoblast invasion involves a cellular transition from epithelial to mesenchymal phenotype. Cytotrophoblasts undergo epithelial to mesenchymal transition (EMT) when differentiating into extravillous trophoblasts and gain the capacity of invasion. In this research, we investigated the role of DNA methylation in trophoblasts during this EMT. First, using BeWo and HTR8/SVneo cell lines as models of cytotrophoblast and extravillous trophoblast, respectively, we analyzed the gene expression and DNA methylation status of the known epithelial marker genes, E-Cadherin and Cytokeratin7. We found that, in HTR8/SVneo cells, both genes were silenced and their promoters hypermethylated, as compared with the high-level gene expression and promoter hypomethylation observed in BeWo cells. This result suggests that dynamic DNA methylation of epithelial marker genes plays a critical role in the trophoblast EMT process. To verify these results, we treated HTR8/SVneo cells with 5-aza-dC, a known inhibitor of DNA methyltransferase, for three days. 5-aza-dC treatment significantly increased the expression of epithelial marker genes and slightly decreased the expression of mesenchymal genes, as detected by qRT-PCR, immunocytochemistry and Western blot. Furthermore, 5-aza-dC treated HTR8/SVneo cells changed their morphology from mesenchymal into epithelial phenotype, indicating that 5-aza-dC induced mesenchymal to epithelial transition. Lastly, we examined the effect of 5-aza-dC on trophoblast migration and invasion capacity. We applied 5-aza-dC to HTR8/SVneo cells in trans-well cell migration and invasion assays and found that 5-aza-dC treatment decreased trophoblast migration and invasion capacity. In conclusion, DNA methylation of epithelial marker genes represents a potential molecular mechanism for the process of trophoblast EMT.
Keywords: DNA methylation, Epithelial-to-Mesenchymal Transition, Trophoblast Invasion
Introduction
Placental trophoblast invasion is associated with the transition from epithelial to mesenchymal phenotype [1; 2]. In the tips of anchoring villi, cytotrophoblasts (CTs) undergo epithelial to mesenchymal transition (EMT) to differentiate into extravillous trophoblasts (EVTs), gaining the capacity to invade the decidua. Defective EMT in placental trophoblast is one of the pathologies associated with preeclampsia [2; 3].
In the EMT of trophoblast invasion, silencing of epithelial genes and activation of mesenchymal genes are critical steps. E-Cadherin (gene name: CDH1) is a Ca2+ dependent cell-cell adhesion molecule expressed in epithelial cells. As a integral membrane glycoprotein linking to the cytoskeleton via its intracellular ligands, termed Catenins, E-Cadherin is thought to stabilize epithelial architecture. In the EMT of trophoblast invasion, down-regulation of E-Cadherin has been reported in both in vivo and in vitro trophoblast invasion models [4]. In that report, E-Cadherin is down-regulated in EVTs compared with CTs in placenta. Furthermore, it has been reported that up-regulation of E-Cadherin in EVTs is associated with the defective trophoblast EMT and shallow placentation seen in preeclamptic placenta [5]. Like E-Cadherin, Cytokeratin 7 (CK7, gene name: KRT7) is a known epithelial marker which acts as intermediate filaments within epithelia [6] and is highly expressed in placental trophoblasts.
DNA methylation is one of the major mechanisms of epigenetic gene regulation. It is well studied that DNA methylation can repress E-Cadherin expression via promotor hypermethylation, particularly in cancer cell EMT and metastasis [7; 8]. DNA methylation status is maintained in vivo by DNA Methyltransferase (DNMTs). Treatment with 5-aza-dC, an inhibitor of DNMTs, has been shown to reactivate E-Cadherin expression in mesenchymal cancer cells and induce the transition from mesenchymal into epithelial morphology (MET) [9]. In a previous study, it has been reported that 5-aza-dC treatment induced E-Cadherin expression and decreased migration in the trophoblast cell line BeWo (CT-like) [10]. However, to date, no studies have been published examining the molecular mechanism of the 5-aza-dC treatment regulating EMT related genes in trophoblast. Therefore, in this research, we investigated the DNA methylation status of the epithelial genes (E-Cadherin and CK7) in trophoblast EMT using the human cell lines, HTR8/SVneo (EVT- like) and BeWo (CT-like), as a trophoblast EMT model. This study shows that 5-aza-dC treatment in HTR8/SVneo cells induces a mesenchymal to epithelial transition (MET) change and suggests that DNA methylation plays a critical role in EMT.
Materials and Methods
Cell culture and 5-aza-dC treatment
Two trophoblast cell lines, BeWo (ATCC) and HTR8/SVneo (gift from Dr. C. Graham), were cultured in DMEM/F12 supplemented with 10% FBS, 2 mmol/L L-glutamine and 1% Pen/Strep. For 5-aza-dC treatment, 5 × 10³ BeWo and HTR8/SVneo cells were plated in wells of 24-well dishes before treatment. Doses ranging from 0.1 to 5 μM of 5-aza-dC (Sigma) were added to the culture media for 3 days. Medium was refreshed every other day for 3 days prior to harvesting cells for RNA, DNA and protein analysis.
Sodium bisulfite genomic sequencing
Genomic DNA from cultured cells was extracted as previously described [11]. In brief, the DNA methylation-Gold kit (Zymo Research) was used according to manufacturer’s instructions to bisulfite treat genomic DNA, followed by amplification via nested PCR (2 rounds of 30 cycles) using primers listed in Table 1. PCR products were then cloned into pTopo TA vector (Invitrogen), and ten to twelve clones from each sample were selected for sequencing.
Table 1.
Primers for Bisulfite genomic sequencing primers and Luciferase reporter assays
| Gene symbol | NCBI GI/ID | Primer sequence (5′ to 3′) | Position to TSS | |
|---|---|---|---|---|
| E-Cadherin | 6615 | OutF | GTTGATTGGTTGTGGTC(T)GGTAGGTG | −98 |
| InF | GAATTGTAAAGTATTTGTGAGTTTG | +11 | ||
| InR | AATACCTACAACAACAACAACAAC | +117 | ||
| OutR | CAAATCAAAAAATCCG(A)AAATACC | +194 | ||
| CK7 | 6591 | OutF | TTTTGTTTGGATTGAAAGTTTGG | −100 |
| InF | TTTTAGGAGGGGTTTGGTAGTAGAGAA | −40 | ||
| InR | TAACTAAACC(G/A)AAATAAACCTAAC | +100 | ||
| OutR | AAAACTAAAATAAATAAACATAATAACTA | +150 | ||
| CK7 Promoter | F | CCAGGGCCTCAAGGCAACAG | −2000 | |
| R | GGTGGCTGGGCCGGGATGGAC | +127 |
Combined Bisulfite Restriction Analysis (COBRA) of E-Cadherin and CK7 proximal promoter regions
For E-Cadherin and CK7 proximal region, 10μl of PCR products was added to a 10μl of mixture containing 1 μL of HinfI or BsuUI (5 units) (NEB) and 2 μL of restriction buffer (10×). After gentle mixing, the mixtures were incubated for overnight at 37°C(for HinfI) and 65 °C (for BstUI) respectively. After running these digested PCR products on a 2% agarose gel, the images were analyzed using Quantity One software (Bio-Rad).
Luciferase reporter assay
Luciferase reporter assay was performed according to published procedure [12]. Briefly, CK7 gene promoter regions, −2000 to +127 relative to its transcription start site (TSS), was cloned into pGL3-Basic vector (Promega), upstream of firefly luciferase coding sequence via PCR and subsequent ligation. Primers are listed in Table 1. In vitro methylation of pGL3-CK7 plasmids was performed by incubation with SssI methylase (New England Labs) for 3 hrs. The resistance of methylated plasmids to BstUI digestion was used to verify the success of in vitro methylation. HTR8/SVneo cells plated at 5×10⁴ cells per well in a 96-well plate were transiently transfected with 0.1 μg of methylated and non-methylated plasmids, along with 0.005 μg of the internal control plasmid (pRL-TK vector, expressing Renilla luciferase using the Lipofectimine 2000 transfection reagent (Invitrogen, CA). 24 hours post-transfection, the activities of both luciferases were determined using the Dual-Luciferase Reporter System (Promega) according to the manufacturer’s instructions. Assays were performed 3 times each in duplicate and promoter activity determined by the ratio of the two luciferase activities.
Invasion and migration assay
2×10⁴ HTR8/SVneo cells were seeded in the upper side of transwell chambers with or without Matrigel-coating (BD Biosciences) for invasion and migration assay respectively. The medium used in upper well was: DMEM/F12 with 0.1% BSA with or without 2.5 μM 5-aza-dC whereas in bottom well: DMEM/F12 with 20% FBS. 22 hours later, cells were stained with 0.09% Crystal violet solution. Non-invading/migrating cells on the upper side of the transwell were carefully removed by cotton swab. Invading/migrating cells on the lower surface of the membrane were photographed and total cell number counted in three independent fields in a blinded manner. These assays were performed in triplicate.
Analysis of mRNA expression by Quantitative RT-PCR
Total RNA was prepared using RNA easy kit (Qiagen, CA) according to manufacturer’s protocol. Trace level DNA was eliminated with RNase-free DNase I (Qiagen, CA) pre-treatment. Total RNA was reverse-transcribed into cDNA with Superscript II First-Strand Synthesis System for quantitative RT-PCR (Invitrogen, CA). The Power SYBR Green PCR reagent (ABI, CA) was used for Real Time Quantitative PCR with Delta Ct analysis in at least three biological replicates. Primers are listed in Table 2.
Table 2.
Primers for quantitative RT-PCR
| Gene symbol | NCBI GI/ID | Primer sequence (5′ to 3′) | position | |
|---|---|---|---|---|
| E-Cadherin | GI:169790842 | F | TGACTACTTGAACGAATGGG | 2701 |
| R | GGAAGGGAGCTGAAAAACCAC | 2885 | ||
| Beta-Catenin | GI:148233337 | F | GTTCGCCTTCACTATGGACT | 1721 |
| R | AGGTGCATGATTTGCGGGAC | 1846 | ||
| KRT7 | GI:67782364 | F | GCCAGTCGCAGGAGTGCCCG | 1511 |
| R | TGGGACCAGGCATGGGAGGC | 1620 | ||
| VIM | GI:240849334 | F | GACGGTTGAAACTAGAGATGGAC | 1748 |
| R | CTTGCGCTCCTGAAAAACTGC | 1925 | ||
| DSC3 | GI:148539845 | F | GGAAGAGGATCTCCAGCTGG | 2721 |
| R | ATTGTAGCACTGTGACATTATCTC | 2863 | ||
| JGD4 | GI:145699104 | F | AGGAAGTCTGAGTGGGTGTG | 1251 |
| R | TCAAACGATCCTCCTGCCTG | 1353 | ||
| SPTAN1 | GI:306966130 | F | CTCTCACTTTCCACTGTAACCT | 7649 |
| R | CCCCACAGTGACATGATGATTG | 7762 | ||
| Actin | GI:168480144 | F | CAGCAGATGTGGATCAGCAAG | 1141 |
| R | TTGTCAAGAAAGGGTGTAACGC | 1252 | ||
| Cadherin18 | NM_001167667 | F | GAGAGATGGGCGTGTGCGGA | 2201 |
| R | TTGCCAGGAGAATGAGAACAC | 2310 |
Immunocytochemistry and Western blot
Cells were fixed in 4% paraformaldehyde (PFA) for 20 mins. Then, the cells were permeabilized with 0.3% Triton X-100 in PBS for 20 mins, blocked with PBS with 4% BSA for half hour, and incubated with antibodies against E-Cadherin, VIM, CK7, CK18, or beta-Catenin for two hours (antibody source listed in Table 3). Next, cells were incubated 1 hour with a FITC- or Rhodamine-conjugated secondary antibody mounted with an anti-fade mounting solution containing DAPI (Invitrogen) and examined with fluorescence optics (Nikon TS100).
Table 3.
Antibody list used for IHC and Western blot
| Antibody | Company | Catalog | Used in |
|---|---|---|---|
| E-Cadherin | Santa Cruz | SC-71008 | IHC and Western Blot |
| VIM | Zymed | 18-0052 | IHC and Western Blot |
| CK7 | DAKO | M7018 | IHC and Western Blot |
| Cdx2 | Abcam | M3540 | IHC |
| CK18 | Proteintech | 10830-1-AP | IHC |
| Beta-Catenin | BD | 610154 | IHC |
For Western blot, proteins were isolated using RIPA buffer with protease inhibitor cocktail (invitrogen) and quantitied using BCA kit (Thermo Scientific). 10 μg proteins were loaded per lane and the antibodies used for Western Blot are listed in Table 3.
Statistical analysis
The Student T-Test was used for the statistical analysis of luciferase reporter assay, invasion and migration assay, and real-time PCR. A p-value of less than 0.05 was considered statistically significant.
Results
Distinct DNA methylation pattern between Cytotrophoblast (CT) and extravillous trophoblast cells (EVT)
To test the role of DNA methylation in the EMT events occurring during trophoblast invasion, whereby the cytotrophoblast (CT-epithelial morphology) transforms into extravillous trophoblast (EVT-mesenchymal morphology) [2], we used the human CT-like cell line, BeWo, and the human EVT-like cell line, HTR8/SVneo. The cellular morphology and immunostaining of E-Cadherin (CDH1), Cytokeratin 7 (CK7) and Vimentin (VIM-mesenchymal marker) in BeWo and HTR8/SVneo cells were shown in Fig 1a and b. These results showed that E-Cadherin and CK7 were expressed in BeWo but not in HTR8/SVneo cells, whereas VIM was expressed in HTR8/SVneo but not in BeWo cells and suggests that EMT is required for the trophoblast invasion process. Further, we analyzed the DNA methylation status of known epithelial marker genes (E-Cadherin and CK7) in both BeWo and HTR8/SVneo cells. Because DNA methylation status surrounding the transcription start site (TSS) is closely associated with transcriptional activity [13], we performed sodium bisulfite genomic sequencing of both proximal promoters (E-Cadherin +11 to +117; CK7 −40 to +100 bp, relative to their TSS respectively). We found that E-Cadherin and CK7 were hypomethylated in BeWo cells (Fig 1c), but hypermethylated in HTR8/SVneo cells, which is consistent with their protein expression patterns shown in Fig 1b. To verify this result, we repeated this DNA methylation analysis in other trophoblast cell lines: SW71 (gift Dr. G. Mor and a model of EVT) and JEG3 (purchased from ATCC, a model of CT). As shown in Fig S1, both genes were more highly methylated in the SW71 cells as compared with the JEG3 cells. To investigate the effect of DNA methylation on CK7 gene regulation, we cloned the human CK7 promoter (−2000 to +127 relative to the transcription start site-TSS) into the pGL-3 basic vector upstream of the firefly luciferase coding sequence (Fig 1d). Then, we performed in vitro DNA methylation of the CK7 promoter using SssI methylase and evaluated its effect on promoter activity in HTR8/SVneo cells. This in vitro DNA methylation caused significant suppression of CK7 promoter-mediated firefly luciferase activity (down-regulated to 11% of unmethylated group as shown in Fig 1E). These results provided evidence that, similar to E-Cadherin [7], transcription of CK7 was also associated with its promoter DNA methylation. In summary, these results suggested that DNA methylation plays a role in the EMT of trophoblast invasion.
Figure 1.

Differences in morphology, protein expression and DNA methylation status between BeWo and HTR8/SVneo cells suggest that the differentiation process from cytotrophoblast (CT) to extravillous trophoblast (ECT) is accompanied by Epithelial-to-Mesenchymal transition (EMT). A, The morphology of HTR8/SVneo and BeWo cells. B, Immunocytochemical analysis of E-Cadherin, VIM and CK7 in these cells. Original picture is 200X. C, DNA methylation of proximal promoter of E-Cadherin and CK7 gene. The CpG sites from +11 to +111 bps (relative to transcription start site) of E-Cadherin gene and from −40 to +100 bps of CK7 gene were included in bisulfite genomic sequencing assay respectively. The top panel showed genomic regions of E-Cadherin and CK7 genes. DNA methylation data was analyzed by quantification tool for methylation analysis online software (http://quma.cdb.riken.jp/). DNA methylation of CpG sites were represented by cycles, with open cycles and close cycles describing unmethylated and methylated CpG sites respectively, and the “x” decoding non-sequenced CpG sites. D, Schematic diagram of pGL3-CK7 construct used in luciferase reporter assay. E, Effect of in vitro DNA methylation of CK7 promoter activity in HTR8/SVneo cells. Data is presented as mean ± SEM.
Inhibition of DNMTs induced mesenchymal-epithelial transition (MET)-like change and decreased invasion/migration capacity in EVT
To investigate the importance of DNA methylation-regulated gene expression during the EMT of trophoblast invasion, we applied 2.5 μM 5-aza-dC (a known DNMT inhibitor) to the culture of HTR8/SVneo cells, the cell model of EVT. After 3 days, treated HTR8/SVneo cells changed their morphology from mesenchymal shape (spindle-shape) to epithelial shape (round shape with loss of polarity) (Fig 2a). 5-aza-dC treatment with concentrations ranging from 0.1 μM to 5 μM had a similar effect on HTR8/SVneo cells (Data not shown). Furthermore, we evaluated the effect of 5-aza-dC on trophoblast invasion and migration capacity using Matrigel-coated or non-coated transwell chambers. As shown in Figure 2b, 5-aza-dC treatment decreased HTR8/SVneo invasion (down to 58 %) and migration (down to 76 %, significant) as compared to vehicle-treated control cells.
Figure 2.

5-aza-dC (DNMTs inhibitor) treatment induces changes in morphology and invasion/migration capacity indicative of MET. A. Morphology of 5-aza-dC treated HTR8/SVneo cells. Original picture is 200X. The white lines indicate cell boundary. B. 5-aza-dC treatment compromises cell invasion and migration capabilities. Data is presented as mean ± SEM. Asterisk (*) denotes statistically significant differences between 5-aza-dC treatment vs. control group.
MET related gene expression in 5-aza-dC treated HTR8/SVneo cells
To study the molecular mechanism of 5-aza-dC induced MET in HTR8/SVneo cells, we used real time PCR to investigate the effect of various doses of 5-aza-dC on mRNA levels of the following epithelial-specific genes: adherent junction genes, E-Cadherin, beta-Catenin and Cadherin18; gap junction:, JGD4 and SPTAN1; cell adhesion genes, DSC3; cytokeratin, CK7; as well as the mesenchymal genes, VIM and CDH2. We found that the effect of 5-aza-dC on gene expression was dose-dependent, with higher doses yielding increased changes in gene expression. At 5 μM of 5-aza-dC treatment, all epithelial genes were significantly up-regulated, as compared with the vehicle-treated controls, whereas the mesenchymal genes showed a decreasing trend that failed to reach statistical significance (Fig 3a). Furthermore, we examined the protein expression of Cytokeratin18 (CK18), CK7, E-Cadherin, and beta-Catenin following 2.5 μM 5-aza-dC treatment in HTR8/SVneo cells by immunocytochemistry (ICC) (Fig 3b) and observed a dramatic up-regulation of CK18, CK7, and beta-Catenin. Surprisingly, E-Cadherin protein could not be detected in 5-aza-dC treated cells via ICC, although its mRNA level was previously shown to be induced by this treatment (as shown in Fig 3a). To confirm these results, we also used Western blot analysis, with normalization to Actin levels, to examine protein levels of E-Cadherin, CK7, and VIM. As shown in Fig 3c, CK7 was dramatically up-regulated; VIM is slightly down-regulated; and E-Cadherin expression was absent in 5-aza-dC treated HTR8/SVneo cells. In summary, 5-aza-dC treatment in HTR8/SVneo cells caused up-regulation of epithelial-specific genes and a trend toward down-regulation of mesenchymal-specific genes, suggesting that 5-aza-dC induced MET in EVT.
Figure 3.

5-aza-dC treatment increases epithelial- and decreases mesenchymal-gene expression levels. A. Gene transcription levels in 5-aza-dC treated HTR8/SVneo cells detected by qRT-PCR, normalized to the housekeeping gene, beta-actin, and data presented as the mean ± SEM. Asterisk (*) denotes statistically significant difference between 5-aza-dC treatment vs. control group. B. Protein levels of CK18, CK7, beta-Catenin and E-Cadherin were examined by immunocytochemistry. Original picture is 200X. C. Protein levels of E-Cadherin, CK7 and VIM were examined by Western blot.
Inhibition of DNMTs did not induced MET in IMR90 cells
To investigate whether these 5-aza-dC induced changes in gene expression are specific to trophoblast cells or merely a mesenchymal-cell specific phenomenon, we examined the effect of 5-aza-dC on the well-characterized mesenchymal fibroblast cell line IMR90 cells, and observed no morphological changes post-treatment (data not shown). We further investigated the re-activation of CK7 (which is dramatically induced by 5-aza-dC treatment in HTR8/SVneo cells, shown in Fig 3) in treated IMR90 cells and found that CK7 reactivation occurred only sporadically (only 1 to 2 cells out of three fields), dramatically less than in the HTR8/SVneo cells shown in Fig 4. These results suggest that the 5-aza-dC effect seen in HTR8/SVneo cells cannot be broadly applied to other mesenchymal cells.
Figure 4.
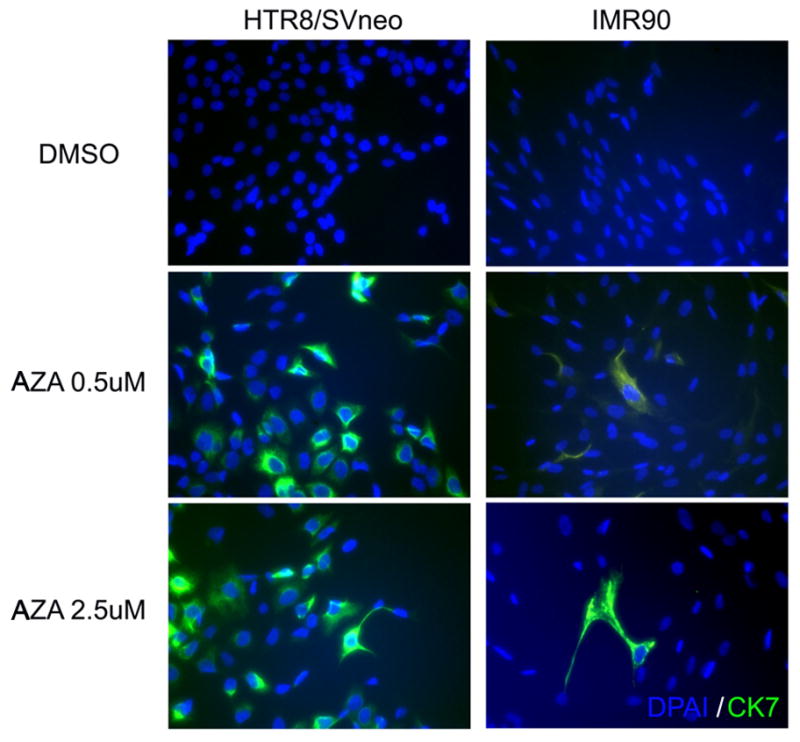
5-aza-dC efficiently induces CK7 protein levels in HTR8/SVneo, but not in IMR90 fibroblasts, as detected by immunocytochemistry. Original picture is 200X.
Discussion
Trophoblast invasion represents an important topic in the placental function studies as defective trophoblast invasion is a major pathological characteristic of the preeclamptic placenta. A large body of evidence has shown that an epithelial to mesenchymal transition (EMT) occurs during trophoblast invasion as cytotrophoblasts (CTs) differentiate into extravillous trophoblasts (EVTs). Impaired EMT is associated with preeclampsia and other trophoblast-related diseases, including intrauterine growth restriction (IUGR) and Choriocarcinoma [5; 14; 15].
The DNA methylation profile of the placental trophoblast has been previously described [16; 17; 18]. For example, Novakovic et al used an Illumina Methylation27 array to analyze the global DNA methylation pattern of several kinds of trophoblast [17]. These data have greatly extended our knowledge of DNA methylation patterns in trophoblasts; however, this technique (array) has its limits, as only 2 or 3 CpG sites per gene can be detected. Therefore, for studies targeting specific trophoblast genes, the bisulfite-sequencing technique can produce more reliable data. Furthermore, while array technology can provide genome wide descriptive data of DNA methylation in trophoblast, the function of these DNA methylations still needs to be investigated.
In this study, we used the bisulfite-sequencing method to investigate the DNA methylation of the epithelial genes, E-Cadherin and CK7, and found distinct differences between the CT and EVT cell models. Both epithelial marker genes are hypomethylated in CT and hypermethylated in EVT. Moreover, we observed that down-regulation of DNA methylation via 5-aza-dC treatment in the EVT model caused re-activation of epithelial genes and a trend toward down-regulation of mesenchymal gene expression (Fig 3). Furthermore, in response to 5-aza-dC treatment, cellular morphology changed into an epithelia-like type (Fig 2), suggesting the occurrence of mesenchymal-to epithelial transition (MET), the reverse process of EMT. These results suggest that DNA methylation plays a critical role during trophoblast EMT by repressing epithelial gene expression and inducing the morphological changes associated with an invasive phenotype. In this study, we also observed that 5-aza-dC treatment decreased the invasion and migration capacity of HTR8/SVneo cells, suggesting a direct link between DNA methylation status and biofunction. Based on these results and other studies which have linked preeclampsia with compromised trophoblast invasive capacity [5], we hypothesize that improper DNA methylation of placental trophoblast cells is associated with the defective trophoblast invasion and shallow placentation seen in preeclampsia.
Up-regulation of epithelial genes is required for MET. In our 5-aza-dC induced MET model, the epithelial genes E-Cadherin, CK7 and Cadherin18 are all up-regulated at the transcription level (Fig 3). Furthermore, CK7 and CK18 were also dramatically induced at the protein level. However, E-Cadherin protein levels were undetectable by either ICC and Western blot, suggesting that this MET may be driven by over-expression of cytokeratins. The absence of E-Cadherin at the protein level may also be attributed to our relatively short 5-aza-dC treatment duration (3 days treatment) as a previous report of MET documents the treatment mesenchymal cancer cells with 5-aza-dC for 15 days prior to observing E-Cadherin expression [9]. In the current study, our 5-aza-dC treatment on HTR8/SVneo cells was limited to three days to prevent 5-aza-dC cellular toxicity.
Our results deepen our previous understanding of the effect of DNA methylation on gene expression with respect to trophoblast invasion capacity. Previously, it has been reported that 5-aza-dC treatment decreases BeWo cell invasion capacity via increasing E-Cadherin expression and the mechanism is assumed that 5-aza-dC treatment causes demethylation of E-Cadherin promoter and gene activation [10]. Present research showed that E-Cadherin is hypomethylated in BeWo cells; hence, 5-aza-dC effect on in E-Cadherin expression in BeWo cells may be indirect, for example, 5-aza-dC treatment could up-regulate E-Cadherin inducers, such as WNT7a [19], then these inducers further activate E-Cadherin expression. Results from this study deepen our understanding of the effect of DNA methylation on gene expression with respect to trophoblast EMT, demonstrate that epithelial genes of EVT cells are silenced by DNA methylation and reveal that inhibition of DNA methylation can induce a MET process.
Supplementary Material
Highlights.
Distinct DNA methylation between cytotrophoblast and extravillous trophoblast
5-aza-dC treatment increase epithelial gene expression in HTR8/SVneo cells
5-aza-dC treatment cause mesenchymal to epithelial transition
Acknowledgments
Funding: This work was supported by the National Institute of Child Health and Human Development (Grant number: 3U54HD040093-09S1). The funders had no role in study design, data collection and analysis, decision to publish, or preparation of the manuscript.
We acknowledge Dr Trixie Smith and Ms Susan Ferguson for critically reading the manuscript and providing constructive criticisms.
Footnotes
Declaration of interest: There is no conflict of interest that could be perceived as prejudicing the impartiality of the research reported.
Author contribution
Conceived and designed the experiments: K.W., Y.C., R.L.. Performed the experiments: Y.C., K.W. Analyzed the data: Y.C., K.W.. Contributed reagents/materials/analysis tools: Y.C., K.W., R.L.. Wrote the paper: K.W. Y.C. R.L..
Publisher's Disclaimer: This is a PDF file of an unedited manuscript that has been accepted for publication. As a service to our customers we are providing this early version of the manuscript. The manuscript will undergo copyediting, typesetting, and review of the resulting proof before it is published in its final citable form. Please note that during the production process errors may be discovered which could affect the content, and all legal disclaimers that apply to the journal pertain.
References
- 1.Vicovac L, Aplin JD. Epithelial-mesenchymal transition during trophoblast differentiation. Acta Anat (Basel) 1996;156:202–16. doi: 10.1159/000147847. [DOI] [PubMed] [Google Scholar]
- 2.Kokkinos MI, Murthi P, Wafai R, Thompson EW, Newgreen DF. Cadherins in the human placenta--epithelial-mesenchymal transition (EMT) and placental development. Placenta. 2010;31:747–55. doi: 10.1016/j.placenta.2010.06.017. [DOI] [PubMed] [Google Scholar]
- 3.Blechschmidt K, Mylonas I, Mayr D, Schiessl B, Schulze S, Becker KF, Jeschke U. Expression of E-cadherin and its repressor snail in placental tissue of normal, preeclamptic and HELLP pregnancies. Virchows Arch. 2007;450:195–202. doi: 10.1007/s00428-006-0343-x. [DOI] [PubMed] [Google Scholar]
- 4.Zhou Y, Fisher SJ, Janatpour M, Genbacev O, Dejana E, Wheelock M, Damsky CH. Human cytotrophoblasts adopt a vascular phenotype as they differentiate. A strategy for successful endovascular invasion? J Clin Invest. 1997;99:2139–51. doi: 10.1172/JCI119387. [DOI] [PMC free article] [PubMed] [Google Scholar]
- 5.Zhou Y, Damsky CH, Fisher SJ. Preeclampsia is associated with failure of human cytotrophoblasts to mimic a vascular adhesion phenotype. One cause of defective endovascular invasion in this syndrome? J Clin Invest. 1997;99:2152–64. doi: 10.1172/JCI119388. [DOI] [PMC free article] [PubMed] [Google Scholar]
- 6.Herrmann H, Bar H, Kreplak L, Strelkov SV, Aebi U. Intermediate filaments: from cell architecture to nanomechanics. Nat Rev Mol Cell Biol. 2007;8:562–73. doi: 10.1038/nrm2197. [DOI] [PubMed] [Google Scholar]
- 7.Yoshiura K, Kanai Y, Ochiai A, Shimoyama Y, Sugimura T, Hirohashi S. Silencing of the E-cadherin invasion-suppressor gene by CpG methylation in human carcinomas. Proc Natl Acad Sci U S A. 1995;92:7416–9. doi: 10.1073/pnas.92.16.7416. [DOI] [PMC free article] [PubMed] [Google Scholar]
- 8.Saito Y, Takazawa H, Uzawa K, Tanzawa H, Sato K. Reduced expression of E-cadherin in oral squamous cell carcinoma: relationship with DNA methylation of 5′ CpG island. Int J Oncol. 1998;12:293–8. doi: 10.3892/ijo.12.2.293. [DOI] [PubMed] [Google Scholar]
- 9.Hemberger M, Udayashankar R, Tesar P, Moore H, Burton GJ. ELF5-enforced transcriptional networks define an epigenetically regulated trophoblast stem cell compartment in the human placenta. Hum Mol Genet. 2010;19:2456–67. doi: 10.1093/hmg/ddq128. [DOI] [PubMed] [Google Scholar]
- 10.Rahnama F, Shafiei F, Gluckman PD, Mitchell MD, Lobie PE. Epigenetic regulation of human trophoblastic cell migration and invasion. Endocrinology. 2006;147:5275–83. doi: 10.1210/en.2006-0288. [DOI] [PubMed] [Google Scholar]
- 11.Wang K, Chen Y, Chang EA, Knott JG, Cibelli JB. Dynamic epigenetic regulation of the Oct4 and Nanog regulatory regions during neural differentiation in rhesus nuclear transfer embryonic stem cells. Cloning Stem Cells. 2009;11:483–96. doi: 10.1089/clo.2009.0019. [DOI] [PubMed] [Google Scholar]
- 12.Hattori N, Imao Y, Nishino K, Hattori N, Ohgane J, Yagi S, Tanaka S, Shiota K. Epigenetic regulation of Nanog gene in embryonic stem and trophoblast stem cells. Genes Cells. 2007;12:387–96. doi: 10.1111/j.1365-2443.2007.01058.x. [DOI] [PubMed] [Google Scholar]
- 13.Sengupta PK, Smith EM, Kim K, Murnane MJ, Smith BD. DNA hypermethylation near the transcription start site of collagen alpha2(I) gene occurs in both cancer cell lines and primary colorectal cancers. Cancer Res. 2003;63:1789–97. [PubMed] [Google Scholar]
- 14.Sun YY, Lu M, Xi XW, Qiao QQ, Chen LL, Xu XM, Feng YJ. Regulation of epithelial-mesenchymal transition by homeobox gene DLX4 in JEG-3 trophoblast cells: a role in preeclampsia. Reprod Sci. 2011;18:1138–45. doi: 10.1177/1933719111408112. [DOI] [PubMed] [Google Scholar]
- 15.Fu J, Lv X, Lin H, Wu L, Wang R, Zhou Z, Zhang B, Wang YL, Tsang BK, Zhu C, Wang H. Ubiquitin ligase cullin 7 induces epithelial-mesenchymal transition in human choriocarcinoma cells. J Biol Chem. 2010;285:10870–9. doi: 10.1074/jbc.M109.004200. [DOI] [PMC free article] [PubMed] [Google Scholar]
- 16.Tolmacheva EN, Kashevarova AA, Skriabin NA, Lebedev IN. DNA methylation profile in human placental tissues. Mol Biol (Mosk) 2011;45:538–45. [PubMed] [Google Scholar]
- 17.Novakovic B, Gordon L, Wong NC, Moffett A, Manuelpillai U, Craig JM, Sharkey A, Saffery R. Wide-ranging DNA methylation differences of primary trophoblast cell populations and derived cell lines: implications and opportunities for understanding trophoblast function. Mol Hum Reprod. 2011;17:344–53. doi: 10.1093/molehr/gar005. [DOI] [PMC free article] [PubMed] [Google Scholar]
- 18.Grigoriu A, Ferreira JC, Choufani S, Baczyk D, Kingdom J, Weksberg R. Cell specific patterns of methylation in the human placenta. Epigenetics. 2011;6:368–79. doi: 10.4161/epi.6.3.14196. [DOI] [PMC free article] [PubMed] [Google Scholar]
- 19.Ohira T, Gemmill RM, Ferguson K, Kusy S, Roche J, Brambilla E, Zeng C, Baron A, Bemis L, Erickson P, Wilder E, Rustgi A, Kitajewski J, Gabrielson E, Bremnes R, Franklin W, Drabkin HA. WNT7a induces E-cadherin in lung cancer cells. Proc Natl Acad Sci U S A. 2003;100:10429–34. doi: 10.1073/pnas.1734137100. [DOI] [PMC free article] [PubMed] [Google Scholar]
Associated Data
This section collects any data citations, data availability statements, or supplementary materials included in this article.