Abstract
Aims
To examine the ability of FPG and/or 2-hr glucose to confirm diabetes and to determine the proportion of participants with HbA1c ≥6.5%.
Methods
Diabetes confirmation rates were calculated after a single elevated FPG and/or 2-hr glucose on an oral glucose tolerance test (OGTT) using a confirmatory OGTT performed within 6 weeks.
Results
772 (24%) participants had elevated FPG or 2-hr glucose on an OGTT that triggered a confirmation visit. There were 101 triggers on FPG alone, 574 on 2-hr glucose alone, and 97 on both. Only 47% of participants who triggered had confirmed diabetes. While the confirmation rate for FPG was higher than that for 2-hr glucose, the larger number of 2-hr glucose triggers resulted in 87% of confirmed cases triggering on 2-hr glucose. Confirmation rates increased to 75% among persons with FPG ≥126 mg/dl and HbA1c ≥6.5%.
Conclusions
Only half of persons with elevated FPG and IGT were subsequently confirmed to have diabetes. At current diagnostic levels, more persons trigger on 2-hr glucose than on FPG, but fewer of these persons have their diagnoses confirmed. In individuals with FPG ≥126 mg/dl and HbA1c ≥6.5%, the confirmation rate was increased.
Keywords: diabetes mellitus, screening, epidemiology
Introduction
The implications of screening for diabetes using fasting plasma glucose (FPG) versus 2-hour plasma glucose have been debated for decades (Rushforth et al., 1979). Studies comparing results of these two approaches for identifying glucose abnormalities typically used a single oral glucose tolerance test (OGTT). Results from these studies consistently show that FPG and 2-hr glucose definitions for diabetes lack concordance, and that 2-hr glucose identifies a larger number of individuals with abnormal glucose than FPG according to criteria in effect at the time (Carter et al., 2006; Flegal et al., 1991; Harris et al., 1987; Harris et al., 1998; Lee et al., 1995; Mooy et al, 1995; Resnick et al., 2001; Wingard et al., 1990). Recent criteria, which reduced the level defining an abnormal FPG, result in only a slightly more comparable number of abnormal tests defined by FPG versus 2-hr glucose (ADA, 2007). Although these studies provide information on interrelationships between FPG and 2-hr glucose, none has ascertained diabetes in a manner consistent with current clinical practice recommendations, which, in the absence of classic signs and symptoms, require repeat glucose testing on a different day (ADA, 2007). Other weaknesses of previous studies include the lack of individuals with a clinical profile consistent with an elevated risk of diabetes, and the absence of measurements not typically collected during an OGTT, such as HbA1c.
Furthermore, an International Expert Committee has recommended the use of HbA1c, beyond its current use as a tool to monitor glucose control among persons with established diabetes, as a means for diagnosing diabetes, with a value of ≥6.5% as a diagnostic level (International Expert Committee, 2009). The American Diabetes Association adopted this recommendation, but also specified that diagnoses could be made by FPG or 2-hr glucose, as before (ADA, 2010). However, the approach using glucose measurements is likely to remain a common approach to making the diagnosis, especially in countries where HbA1c is not readily available.
The Diabetes Prevention Program (DPP) followed practice recommendations closely with respect to repeat glucose testing to confirm new cases of diabetes in DPP participants who were selected based on their increased risk of developing diabetes (DPP, 1999). The DPP therefore provides a rare opportunity to examine the utility of repeat FPG and 2-hr glucose measures among individuals similar to those most likely to be screened for diabetes in clinical practice. Accordingly, the objective of this report is to examine the ability of FPG and 2-hr glucose to confirm a case of diabetes according to American Diabetes Association criteria among adults at high risk for diabetes. Further, we have used concurrent HbA1c measurements to determine the proportion of individuals diagnosed using glucose criteria that have an HbA1c ≥6.5% or ≥7.0%.
Subjects
The Diabetes Prevention Program
The DPP was a randomized clinical trial of prevention of type 2 diabetes in persons at high risk of the disease (DPP, 1999). The study design (DPP, 1999; DPP, 2002b), recruitment (DPP, 2002a), measurement methods (DPP, 2000), and characteristics of randomized participants (DPP, 2000) have been described previously in detail. Briefly, eligibility criteria included age ≥25 years, body mass index (BMI) ≥24 kg/m2 (≥22 kg/m2 only in Asian Americans), and FPG levels between 95–125 mg/dl (≤125 mg/dl only in American Indian clinics) in addition to impaired glucose tolerance (IGT, 2-hr glucose of 140–200 mg/dl). The objective of the DPP inclusion criteria was to identify a cohort of participants at high risk for diabetes. Participants were excluded if they had conditions or took medicines that would impair their ability to participate. All participants gave informed consent and signed documents approved by the Institutional Review Board at each center. Eligible participants received standard advice on healthy diet and physical activity and were randomized to one of three study arms: a) intensive lifestyle modification (ILS) with a goal of ≥150 minutes/week of activity and ≥7% loss of body weight; b) metformin 850 mg twice a day; or c) matching placebo. The main results of the DPP have been reported, with the lifestyle and metformin interventions reducing the incidence of diabetes by 58% and 31%, respectively (DPP, 2002c).
Materials and Methods
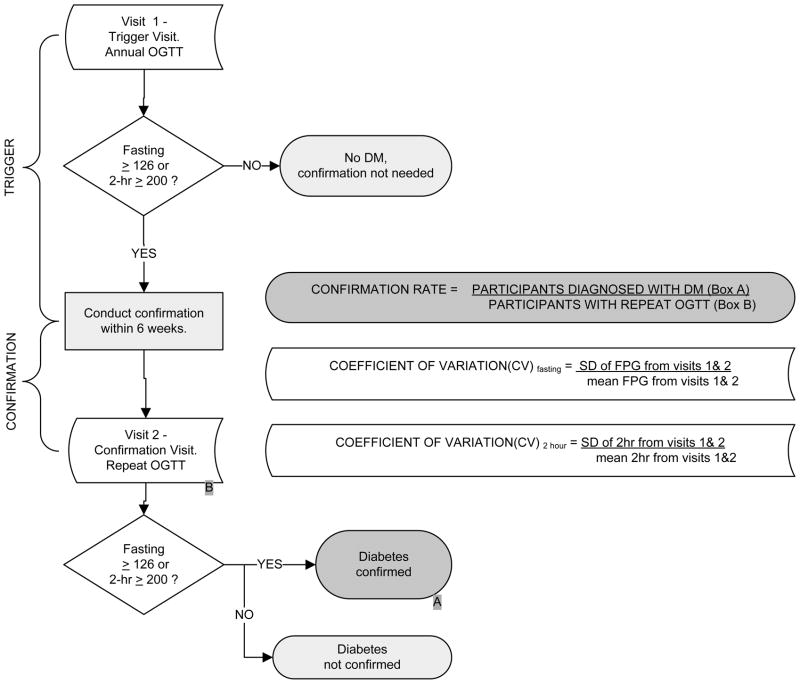
The primary outcome was the diagnosis of diabetes, which required confirmation on a second visit. A “trigger visit” that required confirmation of the diagnosis of diabetes was defined as an annual visit at which a provisionally diagnostic FPG (≥126 mg/dl) or 2-hr glucose (≥200 mg/dl) measure was observed on an OGTT (Figure 1a). In addition to FPG and 2-hr glucose, HbA1c was also measured during these annual visits using a dedicated ion-exchange high-performance liquid chromatography instrument (Variant; BioRad, Hercules, CA) (Ellis et al., 1984), but was not used for determining eligibility or defining the primary outcome. During the trial, participants were called back for a “confirmation visit”, to be performed within 6 weeks of the trigger visit, if they triggered on either their fasting or 2-hour post-glucose load plasma glucose. The clinical centers remained masked to the triggering results, in that the coordinating center also requested re-testing of some participants who had not triggered. Clinical centers were encouraged not to intensify the intervention for the participants who were called back for repeat tests. A repeat OGTT was performed at this confirmation visit, and the diagnosis of diabetes was confirmed by either FPG ≥126 mg/dl or 2-hr glucose ≥200 mg/dl. Thus, for each DPP participant with a trigger visit, two sets of FPG and 2-hr glucose values were available. For a participant that triggered but did not get a diagnosis of diabetes during the confirmation visit, even though there was a chance of triggering again, only data from their first trigger visit was included in the analysis. Participants in the placebo and metformin arms of the study were instructed not to take their study medications on the day of the clinic visit.
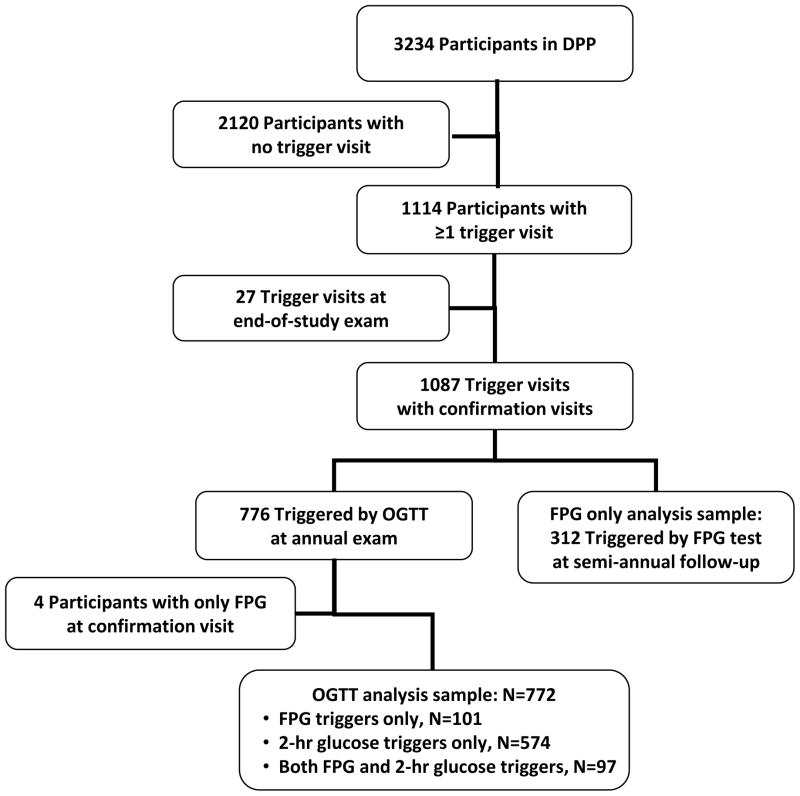
Figure 1. Key variables and sample.
a. Schematic Diagram of Diabetes Confirmation and Definitions of Key Variables
b. Identification of the analysis sample
In addition to annual visits when an OGTT was performed, DPP participants also came to the clinic for 6-month visits, when FPG was measured (Figure 1b). Participants triggering on FPG at a 6-month visit returned to the clinic for a confirmation visit when FPG was again measured. Thus the 6-month visits provided supplementary information on diabetes confirmation based solely on FPG.
The outcome of interest in this report is the proportion of DPP participants with elevated FPG or 2-hr glucose values detected by an OGTT at an annual visit that was confirmed as diabetes on a repeat OGTT. Confirmation rates were calculated for both FPG and 2-hr glucose (Figure 1a) overall and by study treatment arm, as well as by ethnicity (Caucasian vs. not) and by gender.
Statistical Analysis
For each individual, the coefficient of variation (CV) was calculated as the standard deviation of the trigger and the confirmation visit FPG or 2-hr glucose values divided by the corresponding mean of the trigger and the confirmation visit values of FPG or 2-hr glucose. Participant characteristics, determined at the trigger visit, are described using means (SD) for quantitative variables and percentages for qualitative variables. Comparisons among groups were performed using categorical data modeling for qualitative variables and generalized linear models for quantitative variables, after adjusting for treatment and further adjustment for sex and age. The contingency chi-square test was used to compare confirmation rates in different subgroups. Analyses were conducted using the Statistical Analysis System (SAS; Version 9.1, Cary, NC) and a two-sided p-value <0.05 was considered statistically significant.
Results
Among the 3,234 participants enrolled in the DPP, 772 (24%) had first an increase in FPG to levels ≥126 mg/dl or 2-hr glucose to levels ≥200 mg/dl on an annual OGTT, a level that triggered a confirmation visit for diabetes. There were 101 triggers on FPG alone, 574 on 2-hr glucose alone, and 97 on both measures (Figure 1b).
Table 1 shows clinical and demographic characteristics of the sample by type of glucose trigger, at the time of the first trigger. A number of differences were observed across the three groups, with the group triggering on both FPG and 2-hr glucose having the least favorable measures for a number of factors, including diastolic blood pressure, fasting and 2-hr glucose, HbA1c, HDL cholesterol and triglycerides, after adjusting for treatment. After further adjustment for sex and age at the trigger visit, HDL cholesterol and waist circumference among males were no longer significant but all other significant results were maintained (data not shown).
Table 1.
Characteristics of Diabetes Prevention Program participants with a glucose trigger at the corresponding annual trigger visit, by trigger type, N=772 participants
| Characteristic | Trigger on FPG alone N=101 | Trigger on 2-hour glucose alone N=574 | Trigger on FPG and 2- hr glucose N=97 | p-valuea | |||
|---|---|---|---|---|---|---|---|
| Mean or n | s.d. or % | Mean or n | s.d. or % | Mean or n | s.d. or % | ||
| Age (years) | 51.4 | 10.6 | 54.4 | 11.0 | 50.8 | 10.3 | 0.002 |
| Ethnicity - n (%) | 0.072 | ||||||
| Caucasian | 55 | 54.5 | 304 | 53.0 | 47 | 48.5 | |
| African American | 22 | 21.8 | 95 | 16.5 | 27 | 27.8 | |
| Hispanic | 18 | 17.8 | 102 | 17.8 | 17 | 17.5 | |
| Asian/American Indian | 6 | 5.9 | 73 | 12.7 | 6 | 6.2 | |
| Females - n (%) | 68 | 67.3 | 422 | 73.5 | 56 | 57.7 | 0.004 |
| BMI (kg/m2) | 36.7 | 8.9 | 32.8 | 6.3 | 37.5 | 7.8 | <0.001 |
| Waist circumference (cm) | |||||||
| Males | 107.2 | 21.4 | 105.9 | 12.7 | 113.4 | 13.4 | 0.041 |
| Females | 111.5 | 16.7 | 100.3 | 14.5 | 114.3 | 18.1 | <0.001 |
| Systolic blood pressure (mmHg) | 123 | 13 | 125 | 16 | 128 | 14 | 0.139 |
| Diastolic blood pressure (mmHg) | 77 | 9 | 76 | 9 | 80 | 10 | 0.001 |
| Fasting glucose (mg/dl) | |||||||
| All treatment arms | 133.1 | 12.3 | 107.3 | 9.5 | 140.7 | 29.0 | <0.001 |
| Placebo | 132.7 | 15.5 | 109.5 | 9.0 | 141.5 | 31.6 | <0.001 |
| Metformin | 133.1 | 9.8 | 104.6 | 9.4 | 139.9 | 27.3 | <0.001 |
| Intensive Lifestyle | 133.7 | 10.9 | 109.1 | 9.0 | 139.4 | 22.4 | <0.001 |
| 2-hour (mg/dl) | 159.8 | 31.8 | 218.9 | 17.4 | 242.3 | 48.9 | <0.001 |
| HbA1c (%) | 6.21 | 0.54 | 6.03 | 0.48 | 6.83 | 0.95 | <0.001 |
| Fasting insulin (μU/ml) | 41.3 | 23.8 | 26.7 | 16.3 | 38.7 | 17.0 | <0.001 |
| Total cholesterol (mg/dl) | 201.2 | 41.1 | 199.8 | 33.2 | 202.3 | 33.8 | 0.655 |
| LDL cholesterol (mg/dl) | 124.3 | 34.2 | 120.5 | 29.7 | 124.1 | 33.3 | 0.324 |
| HDL cholesterol (mg/dl) | 44.2 | 10.6 | 46.3 | 12.4 | 40.9 | 9.9 | <0.001 |
| Triglycerides (mg/dl) | 158.0 | 94.7 | 163.2 | 89.9 | 185.7 | 103.9 | 0.060 |
| Duration in study (days) | 741 | 382 | 661 | 315 | 693 | 362 | 0.073 |
p-value is for test of differences in means or proportions across glucose trigger groups, adjusted for treatment.
An additional 312 participants triggered first at a 6-month visit when only FPG was measured and returned to the clinic for a confirmation visit when FPG was again measured. This group of participants was similar as far as clinical and demographic characteristics at the trigger visit to those that triggered on FPG at their annual visit (data not shown).
Of the 772 participants with a trigger visit on an OGTT, 47.3% (n=365) were confirmed to have diabetes. Of the 365 confirmed cases, 66% triggered on 2-hr glucose alone, 13% on FPG alone, and 21% triggered on both measures. Thus, 87% of confirmed cases triggered on 2-hr glucose while only 34% triggered on FPG.
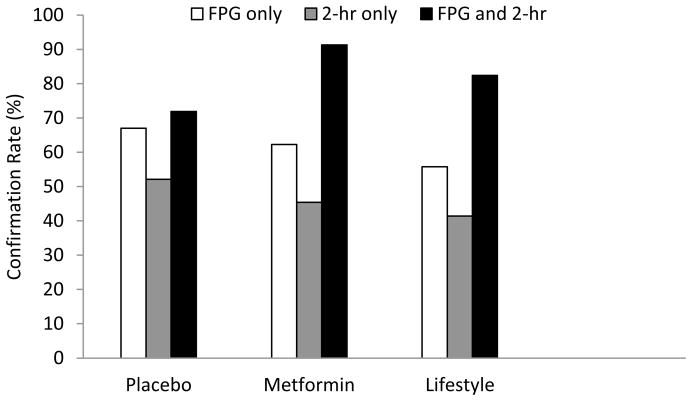
In addition, out of the 772 participants with a trigger visit, 300 (38.9%), 306 (39.6%), and 166 (21.5%) were in the placebo, metformin, and lifestyle arms, respectively. Figure 2a shows groupings of glucose trigger groups and diabetes confirmation rates by treatment arm. The confirmation rate of FPG (triggering on FPG regardless of the 2-hr glucose value) in predicting a confirmed case of diabetes was 63.1% across all treatment arms, and ranged from 55.8% in the ILS group to 67.0% in the placebo group (Table 2a). By contrast, the confirmation rate for 2-hr glucose (triggering on 2-hr glucose regardless of the FPG value) was 47.1% across all treatment arms, ranging from 41.4% in the ILS group to 52.1% in the placebo group. Although the confirmation rate for FPG in each treatment arm exceeded that of 2-hr glucose in absolute terms, this difference was not statistically significant. In the subset of participants who triggered on both FPG and 2-hr glucose, the confirmation rate was significantly better than among those who triggered on only FPG or only 2-hr glucose: 78.4% across all treatment arms, ranging from 71.9% in the placebo arm to 91.3% in the metformin arm (Table 2). With the exception of the group with simultaneous triggers on both glucose measures in the placebo group, the diabetes confirmation rate in the ILS arm was the lowest within each glucose trigger group. Confirmation rates were generally higher in Caucasians and in males (Table 2b–c) though without reaching statistical significance.
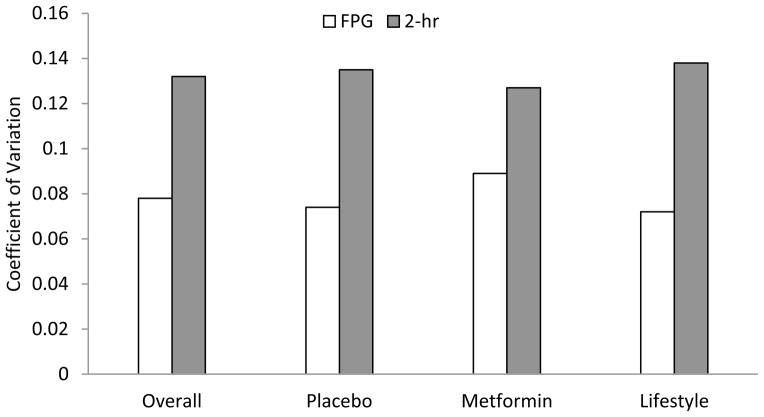
Figure 2. Diabetes confirmation rates and coefficient of variation.
a. Diabetes confirmation rates according to trigger type and treatment arm.
b. Coefficient of variation for FPG and 2-hr glucose by treatment arm.
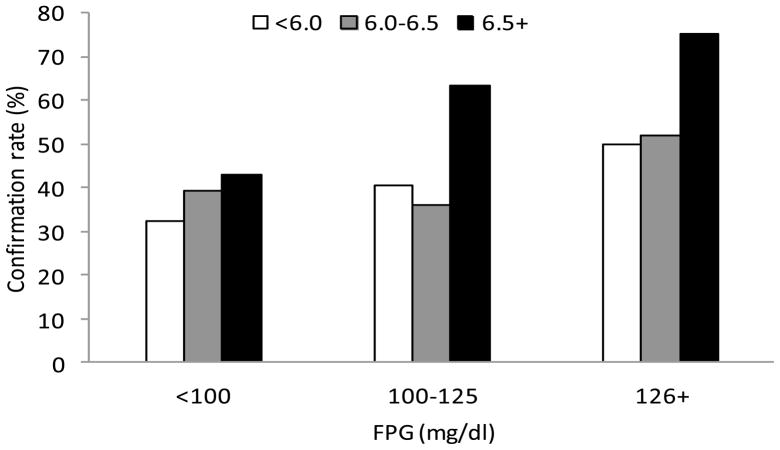
c. Diabetes confirmation rates by FPG and HbA1c.
Table 2a.
Distribution of first trigger types and confirmed cases, by treatment arm, N=773 participants
| All | Placebo | Metformin | Intensive Lifestyle | |||||
|---|---|---|---|---|---|---|---|---|
| N | Confirmed % (n) | N | Confirmed % (n) | n | Confirmed % (n) | n | Confirmed % (n) | |
| FPG (regardless of 2-hr) | 198 | 63.1 (125) | 94 | 67.0 (63) | 61 | 62.3 (38) | 43 | 55.8 (24) |
| 2-hr glucose (regardless of FPG) | 671 | 47.1 (316) | 263 | 52.1 (137) | 268 | 45.2 (121) | 140 | 41.4 (58) |
| Both | 97* | 78.4 (76) | 57 | 71.9 (41) | 23 | 91.3 (21) | 17 | 82.4 (14) |
97 participants triggered on both FPG and 2-hr glucose
Table 2b.
Distribution of first trigger types and confirmed cases, by treatment arm, N=773 participants, by Caucasian or not ethnicity
| All | Placebo | Metformin | Intensive Lifestyle | |||||||||||||
|---|---|---|---|---|---|---|---|---|---|---|---|---|---|---|---|---|
| Caucasian | Not-Caucasian | Caucasian | Not-Caucasian | Caucasian | Not-Caucasian | Caucasian | Not-Caucasian | |||||||||
| N | Confirmed % (n) | n | Confirmed % (n) | n | Confirmed % (n) | n | Confirmed % (n) | n | Confirmed % (n) | n | Confirmed % (n) | n | Confirmed % (n) | n | Confirmed % (n) | |
| FPG (regardless of 2-hr) | 102 | 69.6 (71) | 96 | 56.3 (54) | 49 | 73.5 (36) | 45 | 60.0 (27) | 31 | 64.5 (20) | 30 | 60.0 (18) | 22 | 68.2 (15) | 21 | 42.9 (9) |
| 2-hr glucose (regardless of FPG) | 351 | 47.6 (167) | 320 | 46.6 (149) | 133 | 51.9 (69) | 130 | 52.3 (68) | 143 | 46.2 (66) | 125 | 44.0 (55) | 75 | 42.7 (32) | 65 | 40.0 (26) |
| Both* | 47 | 83.0 (39) | 50 | 74.0 (37) | 28 | 75.0 (21) | 29 | 69.0 (20) | 11 | 90.9 (10) | 12 | 91.7 (11) | 8 | 100.0 (8) | 9 | 66.7 (6) |
97 participants triggered on both FPG and 2-hr glucose
Table 2c.
Distribution of first trigger types and confirmed cases, by treatment arm, N=773 participants, by gender
| All | Placebo | Metformin | Intensive Lifestyle | |||||||||||||
|---|---|---|---|---|---|---|---|---|---|---|---|---|---|---|---|---|
| Males | Females | Males | Females | Males | Females | Males | Females | |||||||||
| N | Confirmed % (n) | n | Confirmed % (n) | n | Confirmed % (n) | n | Confirmed % (n) | n | Confirmed % (n) | n | Confirmed % (n) | n | Confirmed % (n) | n | Confirmed % (n) | |
| FPG (regardless of 2-hr) | 74 | 70.3 (52) | 124 | 58.9 (73) | 34 | 73.5 (25) | 60 | 63.3 (38) | 24 | 66.7 (16) | 37 | 59.5 (22) | 16 | 68.8 (11) | 27 | 48.2 (13) |
| 2-hr glucose (regardless of FPG) | 193 | 49.7 (96) | 478 | 46.0 (220) | 77 | 54.6 (42) | 186 | 51.1 (95) | 84 | 45.2 (38) | 184 | 45.1 (83) | 32 | 50.0 (16) | 108 | 38.9 (42) |
| Both* | 41 | 81.9 (34) | 56 | 75.0 (42) | 23 | 73.9 (17) | 34 | 70.6 (24) | 11 | 90.9 (10) | 12 | 91.7 (11) | 7 | 100.0 (7) | 10 | 70.0 (7) |
97 participants triggered on both FPG and 2-hr glucose
As participants also had a FPG measurement at their 6-monthly visits, we repeated our analyses of FPG confirmation rates using the FPG data from the 312 participants who had their first trigger visit at a semi-annual visit. The 40% confirmation rate based on a FPG trigger at the 6-month visit was similar to the 46% observed when using FPG values only from the OGTTs at the annual visits. Calculation of confirmation rates by treatment arm also yielded similar results for FPG at the annual and 6-month visits (data not shown).
The CV for FPG ranged from about 52% to about 70% that of 2-hr glucose across study arms, confirming the well-known smaller variability in repeat measures of FPG compared to 2-hr glucose (Figure 2b).
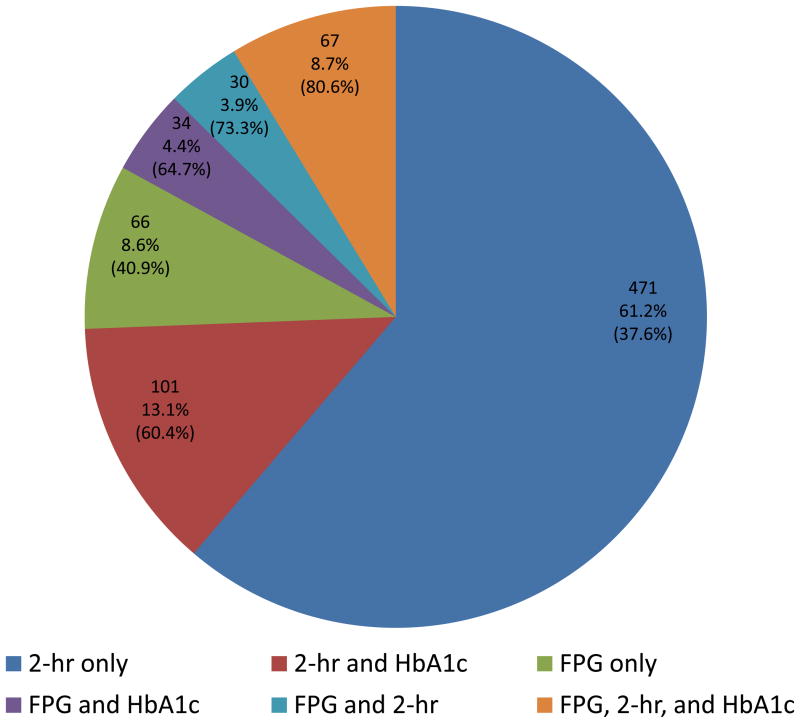
Figure 3 shows diagrammatically the proportion of participants with a trigger visit (out of a total n=769 having all FPG, 2-hr glucose and HbA1c values available) that had elevated FPG, 2-hr glucose, HbA1c or any combination of these at their trigger visit. For example 67 of these participants had all three values elevated, which represents 8.7% of those who triggered based on fasting and/or 2-hr glucose levels and 54 of those (80.6%) were confirmed of having diabetes at the confirmation visit based again on fasting and/or 2-hr glucose values.
Figure 3.
Pie chart of the number (proportion) of individuals triggering a confirmation visit based on 2-hr glucose ≥200 mg/dl and/or FPG ≥126 mg/dl, further subdivided based on HbA1c ≥6.5%. Included in parenthesis is the proportion that was actually confirmed of having diabetes at the confirmation visit.
To determine whether the addition of HbA1c levels to FPG improved the prediction of confirmation of diabetes, we determined the confirmation rates in participants who had FPG <100, 100–125 and ≥126 mg/dl at their trigger visit, according to their level of HbA1c. In general, confirmation rates of diabetes were higher with higher HbA1c, within each category of FPG (Figure 2c). Although some subgroups in this analysis were small, confirmation rates of 63% and 75% were observed for HbA1c at or above 6.5% among persons who had FPG of 100–125 mg/dl and ≥126 mg/dl, respectively. This indicates that when 2-hr glucose is not available, adding HbA1c to FPG as a screening measure increased the diabetes confirmation rate from 63% when using only FPG ≥126 mg/dl to 75% when using a combination of FPG ≥126 mg/dl and HbA1c ≥6.5%. Confirmation rates increased further and were 67% and 81% for HbA1c at or above 7.0% among persons who had FPG of 100–125 mg/dl and ≥126 mg/dl, respectively.
Discussion
The DPP recruited individuals with elevated fasting glucose, IGT, and overweight/obesity, a clinical profile that conveys an elevated risk of developing diabetes. Thus it provides a rare opportunity to evaluate recommendations for diabetes screening relevant to high-risk persons in clinical practice. Several key findings merit emphasis: (1) of 772 individuals who triggered on FPG or 2-hr glucose and had a confirmation visit, only 47.3% (n=365) were diagnosed with diabetes based on glucose data from a confirmation visit within 6 weeks; (2) triggers on 2-hr glucose (n=671) occurred 3.4 times as often as those on FPG (n=198), and (3) only 34% of confirmed cases of diabetes were initially identified with FPG compared with 87% of cases initially identified by 2-hr glucose; however, 2-hr glucose triggers present a greater test-retest variability. Diabetes confirmation rates were lowest in the ILS group, consistent with the DPP trial results that participants assigned to ILS experienced the lowest risk of developing confirmed diabetes.
Less than half of these high-risk individuals who triggered on an OGTT were actually confirmed to have diabetes on a second test indicating that a single glucose measure, whether FPG or 2-hr, is not a reliable indicator of diabetes status among obese individuals with glucose intolerance. This supports current guidelines that a repeat glucose test must be performed to confirm a diagnosis of diabetes. Even though high-risk individuals may be expected to have somewhat more consistent elevations in plasma glucose than others (Mooy et al., 1996), our data confirm substantial test-retest variability in glucose measures.
Another important implication of the low proportion of confirmed cases of diabetes on repeat testing is that diabetes prevalence is most likely overestimated in national surveys and other large epidemiologic studies that utilize a single glucose tolerance test (Harris et al., 1987; Harris et al., 1998; Cowie et al., 2003). However, since the use of repeat testing in population studies would be cost prohibitive in many settings, our findings suggest that diabetes estimates based on a single OGTT should be interpreted with caution when these data are used to estimate the public health burden of diabetes. It is important to emphasize that most cases of confirmed diabetes in high-risk DPP participants were initially identified by an elevated 2-hr glucose measurement, a test that is often not performed in clinical practice; the prevalence of diabetes in many population studies is based on only the FPG, thus underestimating the burden of diabetes. Use of FPG alone for diabetes screening under diagnoses diabetes as defined by the combined FPG and 2-hr glucose criteria. By contrast, use of the 2010 ADA diagnostic criteria (ADA, 2010), by which a diagnosis can be made by any one of FPG, 2-hr glucose, or HbA1c, will increase the prevalence of diabetes if all three measures are used in the same individual.
Major criteria for selecting a diabetes screening tool are that it be able to have a high fraction of those screening positive having a confirmed diagnosis (positive predictive value), correctly identify persons with diabetes (sensitivity), and also correctly identify persons without diabetes (specificity). Our data suggest that in people with IGT and elevated fasting glucose there is a higher proportion of confirmed cases triggering on 2-hr glucose, and hence the OGTT is a better tool than FPG alone for presumptive diabetes diagnosis; however, a key limitation is that the 2-hr glucose results in more false positives on initial screening than FPG. In practice, false positives would lead to additional health care expenditures associated with repeat testing, as well as inconvenience for the patient. However, these costs and inconvenience may represent an acceptable tradeoff relative to the public health benefit associated with increased ascertainment of diabetes which may lead to benefits of early intervention and better management. Results from future clinical trials may provide definitive answers to important questions regarding these complex issues.
It should be remembered that DPP was not a population-based study, but instead identified persons at high risk of developing diabetes -- persons with the metabolic and anthropometric profile associated with diabetes. These are the individuals who are most likely to be identified as being potentially at high risk for diabetes when seen by primary care physicians, and it is in this context that our results should be interpreted. Another advantage of the DPP was the high proportion of ethnic minority participants, with treatment arms being balanced by race/ethnicity; when proportions of race/ethnicity were compared across trigger groups, there were no statistical differences observed. Thus, the racial and ethnic diversity of the DPP cohort did not influence our results.
Despite the insensitivity of FPG in identifying a majority of diabetic individuals, there is practical interest in finding ways to utilize information obtained from a single fasting blood draw to identify individuals with diabetes. One way to achieve this goal is to identify combinations of FPG and HbA1c that are highly predictive of a confirmed case of diabetes. While our analysis of diabetes confirmation rates by FPG and HbA1c categories often resulted in small subgroups, they nevertheless provide intriguing data on this important question. As anticipated, in our cohort, within each FPG category, higher HbA1c was associated with higher diabetes confirmation rates. Diabetes confirmation rates of 63% and 75% were observed for HbA1c ≥6.5% among persons who triggered and had FPG of 100–125 mg/dl and ≥126 mg/dl, respectively (these figures were 67% and 81% respectively for HbA1c at or above 7.0%). Using the more recently proposed diagnostic criteria that include HbA1c ≥6.5% (International Expert Committee, 2009), such people already meet diagnostic criteria without the confirmation test. Taken together, these data suggest that consideration should be given to using the combination of FPG and HbA1c for initial diabetes screening when the 2-hr glucose level is unknown. Clearly, when it is not easy to obtain an HbA1c measure, then a confirmation glucose test should be used.
In conclusion, in high risk adults, post challenge glucose was more sensitive than fasting glucose for the confirmed identification of incident diabetes. Because only half of high risk individuals with an initial elevation in glucose were confirmed to have diabetes, the limitations of a single glucose measure needs further attention whether used for clinical research or clinical practice and consideration should be given to changing current recommendations to require an OGTT for diagnosis of diabetes. However, in the absence of 2-hr glucose, the addition of an HbA1c measure to FPG increased the diabetes confirmation rate. Consideration should thus be given to using the combination of FPG and HbA1c, when performing an OGTT is impractical, for identifying individuals who should be further evaluated for the diagnosis of diabetes.
Supplementary Material
Acknowledgments
The Investigators gratefully acknowledge the commitment and dedication of the participants of the DPP. The National Institute of Diabetes and Digestive and Kidney Diseases (NIDDK) of the National Institutes of Health provided funding to the clinical centers and the Coordinating Center for the design and conduct of the study; collection, management, analysis, and interpretation of the data. The Southwestern American Indian Centers were supported directly by the NIDDK and the Indian Health Service. The General Clinical Research Center Program, National Center for Research Resources and Department of Veteran Affairs supported data collection at many of the clinical centers. Funding for data collection and participant support was also provided by the Office of Research on Minority Health, the National Institute of Child Health and Human Development, the National Institute on Aging, the Centers for Disease Control and Prevention, The Department of Veterans Affairs and the American Diabetes Association. Bristol-Myers Squibb and Parke-Davis provided medication. This research was also supported, in part, by the intramural research program of the NIDDK. LifeScan Inc., Health O Meter, Hoechst Marion Roussel, Inc., Merck-Medco Managed Care, Inc., Merck and Co., Nike Sports Marketing, Slim Fast Foods Co., and Quaker Oats Co. donated materials, equipment, or medicines for concomitant conditions. McKesson BioServices Corp., Matthews Media Group, Inc., and the Henry M. Jackson Foundation provided support services under subcontract with the Coordinating Center. The opinions expressed are those of the investigators and do not necessarily reflect the views of the Indian Health Service or other funding agencies. A complete list of Centers, investigators, and staff can be found in Appendix I.
Footnotes
Publisher's Disclaimer: This is a PDF file of an unedited manuscript that has been accepted for publication. As a service to our customers we are providing this early version of the manuscript. The manuscript will undergo copyediting, typesetting, and review of the resulting proof before it is published in its final citable form. Please note that during the production process errors may be discovered which could affect the content, and all legal disclaimers that apply to the journal pertain.
References
- 1.American Diabetes Association. Diagnosis and Classification of Diabetes Mellitus. Diabetes Care. 2007;30(Suppl 1):S42–S47. doi: 10.2337/dc07-S042. [DOI] [PubMed] [Google Scholar]
- 2.American Diabetes Association. Diagnosis and Classification of Diabetes Mellitus. Diabetes Care. 2010;33(Suppl 1):S62–S69. doi: 10.2337/dc10-S062. [DOI] [PMC free article] [PubMed] [Google Scholar]
- 3.Carter EA, MacCluer JW, Dyke B, Howard BV, Devereux RB, Ebbesson SO, Resnick HE. Diabetes mellitus and impaired fasting glucose in Alaska Eskimos: the Genetics of Coronary Artery Disease in Alaska Natives (GOCADAN) study. Diabetologia. 2006;49:29–35. doi: 10.1007/s00125-005-0071-9. [DOI] [PubMed] [Google Scholar]
- 4.Cowie CC, Rust KF, Byrd-Holt D, Eberhardt MS, Saydah S, Geiss LS, et al. Prevalence of diabetes and impaired fasting glucose in adults--United States, 1999–2000. Centers for Disease Control and Prevention (CDC) Morb Mortal Wkly Rep. 2003;52:833–837. [PubMed] [Google Scholar]
- 5.The Diabetes Prevention Program Research Group. The Diabetes Prevention Program: Design and methods for a clinical trial in the prevention of type 2 diabetes. Diabetes Care. 1999;22:623–634. doi: 10.2337/diacare.22.4.623. [DOI] [PMC free article] [PubMed] [Google Scholar]
- 6.The Diabetes Prevention Program Research Group. The Diabetes Prevention Program: baseline characteristics of the randomized cohort. Diabetes Care. 2000;23:1619–1629. doi: 10.2337/diacare.23.11.1619. [DOI] [PMC free article] [PubMed] [Google Scholar]
- 7.The Diabetes Prevention Program Research Group. The Diabetes Prevention Program: Recruitment methods and results. Controlled Clinical Trials. 2002;23:157–171. doi: 10.1016/s0197-2456(01)00184-2. [DOI] [PubMed] [Google Scholar]
- 8.The Diabetes Prevention Program Research Group. The Diabetes Prevention Program: Description of lifestyle intervention. Diabetes Care. 2002;25:2165–2171. doi: 10.2337/diacare.25.12.2165. [DOI] [PMC free article] [PubMed] [Google Scholar]
- 9.The Diabetes Prevention Program Research Group. Reduction in the incidence of type 2 diabetes with lifestyle intervention or metformin. N Engl J Med. 2002;346:393–403. doi: 10.1056/NEJMoa012512. [DOI] [PMC free article] [PubMed] [Google Scholar]
- 10.Ellis G, Diamandis EP, Giesbrecht EE, Daneman D, Allen LC. An automated high pressure liquid-chromatographic assay for hemoglobin A1c. Clin Chem. 1984;30:1746–1752. [PubMed] [Google Scholar]
- 11.Flegal KM, Ezzati TM, Harris MI, Haynes SG, Juarez RZ, Knowler WC, et al. Prevalence of diabetes in Mexican Americans, Cubans, and Puerto Ricans from the Hispanic Health and Nutrition Examination Survey, 1982–1984. Diabetes Care. 1991;14:628–638. doi: 10.2337/diacare.14.7.628. [DOI] [PubMed] [Google Scholar]
- 12.Harris MI, Hadden WC, Knowler WC, Bennett PH. Prevalence of diabetes and impaired glucose tolerance and plasma glucose levels in U.S. population aged 20–74 yr. Diabetes. 1987;36:523–534. doi: 10.2337/diab.36.4.523. [DOI] [PubMed] [Google Scholar]
- 13.Harris MI, Flegal KM, Cowie CC, Eberhardt MS, Goldstein DE, Little RR, et al. Prevalence of diabetes, impaired fasting glucose, and impaired glucose tolerance in U.S. adults. The Third National Health and Nutrition Examination Survey, 1988–1994. Diabetes Care. 1998;21:518–524. doi: 10.2337/diacare.21.4.518. [DOI] [PubMed] [Google Scholar]
- 14.The International Expert Committee. International Expert Committee Report on the Role of the A1c Assay in the Diagnosis of Diabetes. Diabetes Care. 2009;32:1–8. doi: 10.2337/dc09-9033. [DOI] [PMC free article] [PubMed] [Google Scholar]
- 15.Lee ET, Howard BV, Savage PJ, Cowan LD, Fabsitz RR, Oopik AJ, et al. Diabetes and impaired glucose tolerance in three American Indian populations aged 45–74 years. The Strong Heart Study. Diabetes Care. 1995;18:599–610. doi: 10.2337/diacare.18.5.599. [DOI] [PubMed] [Google Scholar]
- 16.Mooy JM, Grootenhuis PA, de Vries H, Valkenburg HA, Bouter LM, Kostense PJ, Heine RJ. Prevalence and determinants of glucose intolerance in a Dutch caucasian population. The Hoorn Study. Diabetes Care. 1995;18:1270–1273. doi: 10.2337/diacare.18.9.1270. [DOI] [PubMed] [Google Scholar]
- 17.Mooy JM, Grootenhuis PA, de Vries H, Kostense PJ, Popp-Snijders C, Bouter LM, Heine RJ. Intra-individual variation of glucose, specific insulin and proinsulin concentrations measured by two oral glucose tolerance tests in a general Caucasian population: the Hoorn Study. Diabetologia. 1996;39:298–305. doi: 10.1007/BF00418345. [DOI] [PubMed] [Google Scholar]
- 18.Resnick HE, Shorr RI, Kuller L, Franse L, Harris TB. Prevalence and clinical implications of American Diabetes Association-defined diabetes and other categories of glucose dysregulation in older adults: the health, aging and body composition study. J Clin Epidemiol. 2001;54:869–876. doi: 10.1016/s0895-4356(01)00359-6. [DOI] [PubMed] [Google Scholar]
- 19.Rushforth NB, Miller M, Bennett PH. Fasting and two hour post-load glucose levels for the diagnosis of diabetes. Diabetologia. 1979;16:373–379. doi: 10.1007/BF01223157. [DOI] [PubMed] [Google Scholar]
- 20.Wingard DL, Sinsheimer P, Barrett-Connor E, McPhillips JB. Community-based study of prevalence of NIDDM in older adults. Diabetes Care. 1990;13(Suppl 2):S3–S8. [Google Scholar]
Associated Data
This section collects any data citations, data availability statements, or supplementary materials included in this article.


