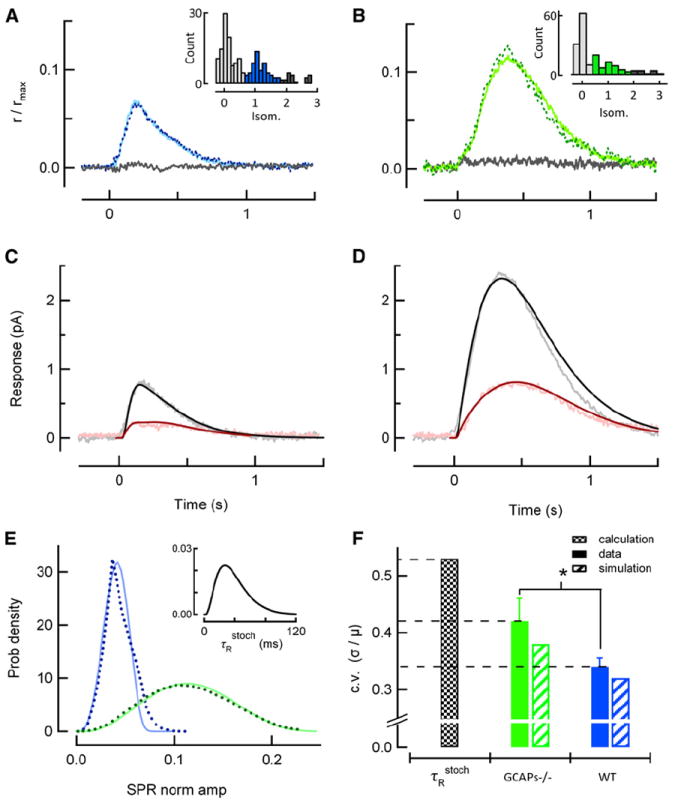
Figure 6. Single-Photon Response Amplitude Is Less Reproducible in the Absence of GCAPs-Mediated Feedback.

(A) Average of identified singletons in a representative WT rod, determined by histogram analysis of 200 dim flash trials (inset; identified singletons highlighted in blue, failures in light gray, amplitudes from multiple R* in dark gray). This average singleton (solid) closely resembles the average SPR determined independently in this rod by variance-to-mean analysis for the entire set of dim flashes (dotted). The gray trace is the average of the responses yielding failures in the histogram.
(B) Same analysis as in (A), but from a representative GCAPs−/− rod in response to 188 repeated dim flashes. Solid green trace plots the average of the 63 identified singletons, corresponding to the green portion of the inset histogram, and closely resembles the average SPR determined independently by variance-to-mean analysis (dotted).
(C and D) Population mean singleton response (gray) and time-dependent standard deviation (pink) calculated from five WT (C) and four GCAPs−/− (D) rods, with mean dark currents of 15.5 ± 1.4 and 16.1 ± 1.2 pA, respectively. The smooth curves are the mean (black) and time-dependent standard deviations (dark red) derived from model simulations of ensembles of SPRs for each genotype.
(E) Probability distributions of calculated stochastic R* lifetimes (inset) and singleton amplitudes (dotted lines) determined from the simulation of 100,000 WT and GCAPs−/− SPRs using the stochastic R* deactivation scheme (Figure S2). Blue and green solid curves are probability density functions of singleton amplitudes predicted by transforming the τRstoch probability density by the theoretical stability curves in Figure 4C and reveal that the mechanisms that generate amplitude stability underlie reproducibility.
(F) Filled bars indicate the experimentally determined c.v. of the GCAPs−/− (green) and WT (blue) singleton amplitudes calculated from rods whose averages are shown in (C) and (D) (asterisk denotes p = 0.02 in Student’s t test comparison). Black checked bar is the c.v. of the calculated τRstoch distribution shown in the inset in (E), and hatched bars indicate coefficients of variation of simulated singleton amplitude distributions shown in (E). Error bars reflect S.E.M.
