Abstract
The purpose of this study was to develop life tables by smoking status removing lung cancer as a cause of death. These life tables are inputs to studies that compare the effectiveness of lung cancer treatments or interventions, and provide a way to quantify time until death from causes other than lung cancer. The study combined actuarial and statistical smoothing methods, as well as data from multiple sources, to develop separate life tables by smoking status, birth cohort, by single year of age, and by sex. For current smokers, separate life tables by smoking quintiles were developed based on the average number of cigarettes smoked per day by birth cohort. The end product is the creation of six non-lung cancer life tables for males and six tables for females: five current smoker quintiles and one for never smokers. Tables for former smokers are linear combinations of the appropriate table based on the current smoker quintile prior to quitting smoking and the never smoker probabilities, plus added covariates for the smoking quit age and time since quitting.
Keywords: Life Tables, Competing Risks, Lung Cancer and Smoking
1. INTRODUCTION
While lung cancer is one of the most significant causes of premature death for smokers, smoking is also strongly associated with death from other causes, such as other cancers, cardiovascular disease, and chronic obstructive pulmonary disease.(1) There have been declines in mortality rates from many of the non-lung cancers over the last three decades, most significantly in cardiovascular disease. A portion of the decrease in death rates from causes other than lung cancer is attributable to smoking cessation and partly to other factors.
A life table is an actuarial approach that estimates age-specific annual probabilities of death. The purpose of this paper is to quantify declines in non-lung cancer mortality in the form of birth cohort life tables as a function of smoking status. This work is useful both in helping to separately quantify the impact of smoking cessation efforts for lung cancer versus other causes of death, as well as to quantify deaths from other causes in the planning or the modeling of lung cancer screening trials among high risk groups. Having a set of mortality rates for causes other than lung cancer allows researchers to model the effects of different interventions for lung cancer, with associated different mortality rates for lung cancer.
Previous research has shown mortality is higher for those who smoke as compared to those who have never smoked.(1,2) In addition, mortality for those who smoked and quit smoking is different from current smokers, and these rates also differ from those who have never smoked.(3) Recently the effects of secondhand smoke on mortality for never smokers have been documented.(2,4) The quantity of cigarettes smoked per day, the length of time a person had smoked, and when the person started smoking have been studied and proven to be contributors to mortality.(1)
One prior approach to modeling excess all-cause mortality due to cigarette smoking was to develop models of all-cause mortality based on age, smoking duration and intensity of smoking as measured by self-reported cigarettes smoked per day. The excess mortality caused by smoking was estimated from prospective mortality study data, by subtracting the rates in current and former smokers from those of never smokers, and was projected for smokers quitting at various ages.(3) This approach was specific for the population and time period studied and required several adjustments to be used to estimate general population risks. A second approach was to use population-based lung cancer death rate data to approximate the contribution of smoking to other cause specific and all-cause mortality.(5,6) Differences in the age distribution of smoking behaviors and the differences in age-specific increases in disease specific risk for lung cancer, in contrast to heart disease and chronic obstructive pulmonary disease, were limitations of this approach.
This paper is an extension of previous work that modified all-cause cohort life tables and created new cohort life tables that represented all-cause mortality with breast cancer removed.(7) Rosenberg developed a simple method to remove breast cancer as a cause of death by using all-cause birth cohort mortality data from the Berkeley Mortality Database(8) based on National Center for Health Statistics census data. Removing lung cancer mortality from all-cause mortality is not as simple as removing breast cancer from all-cause mortality, because of the impact of smoking history on increased mortality for lung cancer, and also due to the increased mortality of cardiovascular disease, chronic obstructive pulmonary disease and other cancers for current and former smokers. As such, we need to condition on smoking status (current, former or never), as well as additional covariates such as quantity smoked per day, length of time smoked, and age at quit if applicable.
In this study we develop life tables for male and female birth cohorts (birth years 1900–1960) through calendar year 2000 as a function of smoking status (never smoker, current smoker by smoking quintile, former smoker by years quit, quit age and average cigarettes per day while smoking). The basic idea is to partition US cohort life tables using various auxiliary data sources for smoking prevalence and the mortality risk of being a smoker or former smoker relative to someone who never smoked. The Methods section summarizes the approach for creating life tables for all-cause mortality after removing lung cancer, integrating smoking status using standard actuarial techniques and generalized additive models. The Results section summarizes the quantities estimated and the Discussion section concludes the paper.
2. DATA SOURCES AND METHODS
2.1. Data
To compute non-lung cancer mortality by sex and by smoking status, we gathered data from a number of sources, described in detail below and summarized in Table I: (1) all-race cohort life tables; (2) all-race lung cancer mortality rates by calendar year and age; (3) white prevalence rates by smoking status for current smokers, former smokers, and those who have never smoked; (4) white mortality rates by smoking status for current smokers, former smokers, and those who have never smoked, and smoking patterns for white former smokers and when they quit smoking; and (5) smoking patterns of white current smokers.
Table I.
Summary of Data Used
| Data | Source | Dates | Stratification | Calendar or Birth Year | Special Notes |
|---|---|---|---|---|---|
| All-race, all-cause mortality | Berkeley Tables, based on US census | 1900–2000 | Every age, every birth year | Birth | |
| All-race lung cancer male/female | NCHS | 1950–2000 | 5-year age groups starting at age 0–4; last group 85+ | Calendar | |
| Prevalence of white smoking | NHIS and Burns et al. 1998 | 1900–1980 | Single age groups starting at age 0; ending age is birth year + age = 1993 | Birth cohort every 5 years | |
| All-cause and lung cancer white male/female | CPS-I (American Cancer Society) | 1959–1962; 1963–1965; 1966–1968; 1969–1972 | 5-year age groups starting at age 35; last group at 80–84 | Calendar | Smoking status each survey |
| All-cause and lung cancer white male/female | CPS-II (American Cancer Society) | 1982–1985; 1986–1988; 1989–1991 | 5-year age groups starting at age 35; last group at 80–84 | Calendar | Smoking status at baseline; Used vital statistics from next survey |
| All-cause and lung cancer white male/female | Nutrition follow-up (American Cancer Society) | 1992–1994; 1995–1997; 1998–2000 | 5-year age groups starting at age 35; last group at 80–84 | Calendar | Smoking status at baseline; Used vital statistics from next survey |
| Cigarettes per day by age for white male/female | NHIS | 1965–2000 | Single age | Calendar |
The all-race, all-cause Berkeley Mortality Database(8) by birth cohort was developed by researchers based on data from the Office of the Chief Actuary in the Social Security Administration(9). The Social Security Administration cohort life table data consisted of separate tables for males and females, for birth years 1900 to 1990 and by 5-year birth cohorts. The Berkeley Mortality Database is a smoothed variation of the census life table data and produced mortality rates by sex, by single year of age, for all birth cohorts 1900 to 2000. Projected death rates and life tables were based on Alternative II forecasts from the 1998 Trustees report.
All-race lung cancer central mortality rates (lung and bronchus including trachea and pleura), separately for males and females in the presence of other causes, were obtained from the National Center for Health Statistics (NCHS) in 5-year age intervals (0 – 4, 5– 9, 10 – 14, 15 – 19, 20 – 24, 25 – 29, 30–34, 35 – 39, 40 – 44, 45 – 49, 50 – 54, 55 – 59, 60 – 64, 65 – 69, 70 −74, 80 – 84, 85+) and by calendar year of death 1950 to 2000.(10) These mortality rates represented the number of deaths from lung cancer divided by the population in the 5-year age group as of July 1 of each calendar year. All-cause central mortality rates by each 5-year age group were also provided for calendar years 1969 to 2000. The lung cancer central mortality rates were adjusted to annual probabilities and converted from a calendar year of death basis to a cohort basis as explained in the Methods section.
Prevalence rates for whites by smoking status were estimated using the National Health Interview Survey (NHIS) from 1965 – 2000.(11) The purpose of the NHIS is to monitor the health of the United States population.
-
Data for whites from the Cancer Prevention Study I and II (CPS-I and CPS-II) and the Nutrition follow-up studies sponsored by the American Cancer Society were used to estimate the relative risk mortality ratios of current smokers to never smokers, and former smokers to never smokers (Section 2.2.2.). (12,13,14) Data from CPS-I and CPS-II were in 5-year age groups starting at age 35, with the last age group at 80 – 84. CPS-I data were also used to develop an excess risk equation for former smokers (see Section 2.2.4), and CPS-II data were also used to estimate the mortality risk of smoking by number of age and number of cigarettes per day (see Section 2.2.3.).
CPS-I enrolled 1 million people from 25 states and started in the Fall 1959 to early 1960. Vital statistics of the participants were obtained in 1960–1965, 1971, and 1972, and supplemental questionnaires were used to obtain smoking status in 1961, 1963, 1965, and 1972. CPS-II involved a study of 1.2 million people with enrollment in 1982 to 1985 in 50 states. Smoking status by individual was only obtained at baseline with vital statistics follow-up biennially until 2002. The Nutrition Follow-up study, with a subgroup of the CPS-II study (184,194 people), contained detailed information on diet and lifestyle factors in addition to mortality follow-up. This subgroup was chosen among baseline cohort members, aged 50–74, who resided in 21 states with population-based state cancer registries. Data from the baseline survey (1992 to 1994) established a person’s smoking status, with follow-up surveys in 1995 to 1997 and 1998 to 2000 used to collect vital statistics. The CPS data were not balanced by race and were predominately based on white participants. These data were used to derive relative risks, as shown in the Methods section, and then were used to calculate mortality rates for all-races.
Data for whites from the NHIS(11) for calendar years 1965 to 2000 were used to link smoking habits (cigarettes per day) with age.
2.2. Methods
A non-parametric approach using a combination of actuarial and statistical smoothing techniques was chosen so as to not impute the stronger assumptions of a parametric model, and rely more on the data to determine the pattern and magnitude of the mortality probabilities.
As described in Rosenberg(7) there are different ways of expressing mortality rates or probabilities. The probability that a person of exact age (x) dies before age (x+1) is labeled qx and is calculated by dividing the number of deaths by the number of persons of exact age (x). The central death rate, mx, relates the number of deaths between ages (x) and (x+1) to the average number of persons living at age (x). Both qx and mx are referred to as mortality rates in the literature and left to the reader to determine which is utilized in a particular study. Over a one-year age interval, the difference between qx and mx is not material, but these differences become larger over a wider interval. Life tables define mortality rates by qx. The method of converting from rates to probabilities is found in Bowers et al. (15)
Table II summarizes the steps taken for the transformation of all-race, all-cause mortality probabilities from the Berkeley Mortality Database to separate life tables by smoking status, showing the data and calculations used for each step. The analysis began with all-cause mortality probabilities for all races combined by sex, by birth cohort, and by age from the Berkeley Mortality Database as shown in Step 0.
Table II.
Guide to Methods Used in this Study
| Step # | Final Result | Data Source(s) | Calculation |
|---|---|---|---|
| 0 | All-race, all-cause single year of age cohort life tables for 1900–1960 birth cohorts years by sex -- truncated in 2000 | Berkeley Mortality Database | Baseline |
| 1 | All-race, all-cause other than lung cancer single year of age cohort life tables for 1900–1960 birth cohorts by sex - truncated in 2000 | US mortality rates for lung cancer by 5 year age-groups for each calendar year 1950–2000 |
|
| 2 | All-race, all-cause other than lung cancer single year of age cohort life tables for 1900–1960 birth cohorts by sex by smoking status (never, current, former) - truncated in 2000 |
|
|
| 3 | Current smokers life table in step #2 partitioned by smoking quintiles |
|
|
| 4 | Former smoker life tables in step #2 partitioned by age quit, number of years quit, and average CPD |
|
|
For this study, we estimated mortality rates through calendar year 2000. All of the steps were completed separately by sex, so with no loss in generality, no further reference to splits by sex will be stated.
2.2.1. Cohort Life Tables for All Causes Other than Lung Cancer
Define as the all-race, all-cause mortality probability of a person born in birth year BY dying between age (x) and age (x + 1).
Step 1 converted the all-race, all-cause mortality probabilities to mortality probabilities removing lung cancer as a cause of death. All-race central death rates for lung cancer mortality rates by calendar year from NCHS were converted to annual mortality probabilities by birth cohort defined as . The probability of death after removing lung cancer as a cause of death, , is the result of Step 1 and is defined as
2.2.2. Life Tables by Smoking Status
Step 2 partitioned these aggregate all-race mortality probabilities removing lung cancer into three groups: current, former, and never smokers. In theory, the aggregate mortality after removing lung cancer is a function of the prevalence and probabilities for each of the three groups as shown in Equation (2.1):
| (2.1) |
where represented the prevalence of current smokers at age (x) from birth year BY. The superscripts “f” and “n” represented former smokers and those who had never smoked, respectively. The ratio was calculated, substituting Equation (2.1) for the denominator. Then this result was modified by dividing both the numerator and denominator on the right-hand side by to yield the following relationship:
| (2.2) |
Each of the ratios on the right-hand side of Equation (2.2) is a relative risk ratio, which is the ratio of the mortality probability of current smokers (or former smokers) to the mortality probability of those who had never smoked. Similar equations were defined for former smokers and never smokers.
Data were gathered and used to calculate the right-hand side of Equation (2.2) and ones for former and never smokers. The relative risks were derived from CPS-I, CPS-II, and Nutritional Follow-up studies. The never smoker, current smoker, and former smoker prevalence estimates were derived from NHIS data. The CPS-I, CPS-II, and Nutritional Follow-up studies involved volunteer enrollees and had a larger proportion of whites than in the US population, while the NHIS study was representative of the US population. We estimated the right-hand side of Equation (2.2) and ones for former and never smokers using data for whites from both data sources to better match these two data sources in terms of racial composition. Assuming that the computed ratios for whites on the right-hand side approximated that for all-races, we multiplied the right-hand side by the all-race, all-cause other than lung cancer mortality probability, , to yield the desired all-race probability of death for current, former, and never smokers other than lung cancer as a cause of death ( ).
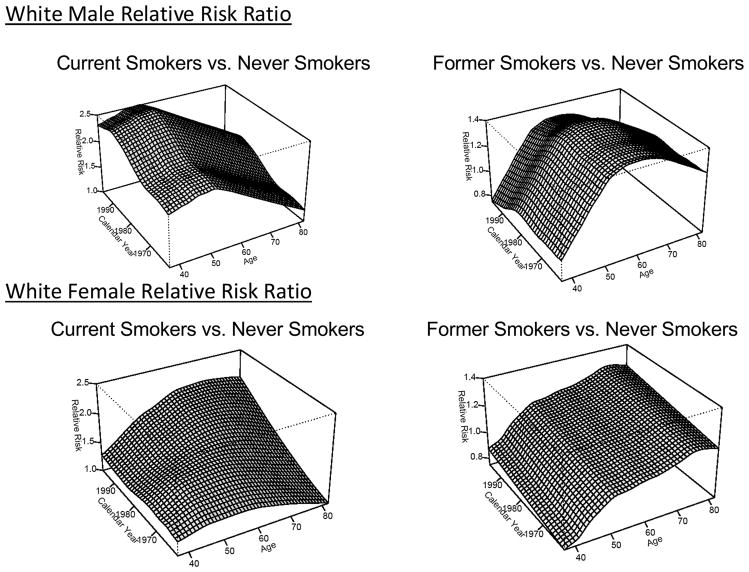
Step 2(a) smoothed the CPS-I, CPS-II, and Nutrition Follow-up data to estimate relative risk ratios over all ages and calendar years. We included CPS-I data where smoking status was obtained (1961, 1963, 1965, and 1972). Smoking status by individual for CPS-II and the Nutritional Follow-up Studies were only obtained at baseline. We estimated rates in calendar year blocks of three or four years (1959–62, 1963–65, 1966–68, 1969–72 from CPS-I and the follow-up surveys; 1982–85, 1986–88 from CPS-II; 1992–94, 1995–97 from the Nutrition Follow-Up surveys), and in five-year age groups. These blocks were selected so that no follow-up was utilized beyond six years after the ascertainment of smoking status from a baseline or follow-up survey. Relative risk ratios were assumed to be 1 before age 40. Ratios were only available where (i) the attained age was greater than or equal to 50 and (ii) the attained age plus the birth year was less than calendar year 2000. See Appendix A.1 for details of the smoothing procedure. Figure 1 shows the white male and female relative risk ratios for (i) current smoker to never smoker in the left-hand graphs, and (ii) former smoker to never smoker in the right-hand graphs. The vertical scales in the graphs are the same by sex.
Figure 1.
Relative Risk Ratios for White Males and White Females
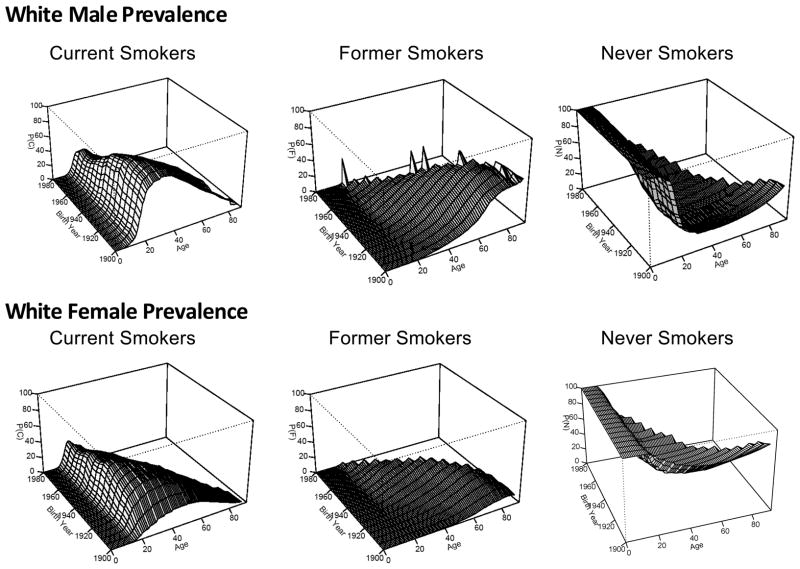
Step 2(b) involved the calculation of the prevalence rates for whites by age and birth year from NHIS surveys for use in Equation (2.2) and ones for former and never smokers. Burns et al.(13) calculated smoking rates by single year of age for the United States for calendar years 1900 to 2001 by sex, race/ethnicity, and five-year birth cohorts (1900 to 1980). Cross-sectional data were used to calculate the prevalence by age for those who had ever smoked, by modeling the raw rates using an exponential model with an offset term from the age of 30. Current prevalence rates at each age were obtained by multiplying the ever-smoking prevalence rates at each age by the proportion of subjects who were still smoking at that age. Figure 2 shows a graphical summary of the prevalence rates for white male current, former, never smokers at the top of the page, while the bottom three graphs are for white females. The vertical scales in the graphs are the same. A greater percentage of younger males smoked in their twenties during the early birth cohorts that has decreased over time. The age which men quit smoking appears to have shifted to younger ages for more recent birth cohorts. The never smoker prevalence shows that most males start smoking by age 20. The prevalence of female smokers is lower than in males. For some birth cohorts women started smoking at considerably older ages than for the corresponding male cohort.
Figure 2.
White Male and White Female Smoking Prevalence Rates
Steps 2(c) and 2(d) combined the relative risks and smoking prevalence rates over all ages and birth years to compute the right-hand side of Equation (2.2) and ones for former and never smokers. These ratios were applied to the all-race results of Step 1(b) to create three separate all-race life tables by smoking status: current, former, never.
Step 3 sub-divided the aggregate current smoker life table to reflect the average number of cigarettes smoked per day. Step 4 modified the aggregate former smoker life table to reflect the age a person quit, the number of years quit, and the average cigarettes smoked per day. These are explained in more detail in the subsections that follow.
2.2.3. Current Smokers Modification
Step 3(a) sub-divided the aggregate current smoker relative risk ratios from Step 2(a) into 5 quintiles to add more specificity for the level of smoking. Based on earlier work used to derive the U.S. smoking histories by birth cohort(16), National Health Interview Surveys were utilized to derive quintiles of smoking levels by demographics. For each cross-sectional NHIS, respondents identified as smokers were stratified by sex, race/ethnicity, birth cohort, and age. These demographic strata were then divided into quintiles based upon the number of cigarettes smoked daily, and the mean number of cigarettes smoked was calculated for each quintile. The mean cigarettes smoked at all ages for each quintile and for each sex/race/birth cohort stratum were smoothed using restricted cubic splines, where the details are summarized in Appendix A.2. For example, for white male smokers born in 1930 and currently aged 50 smoked on average 9.6, 19.8, 22.9, 33.9, and 47.2 cigarettes per day for the first through fifth quintiles respectively. By comparison, white female smokers born in 1930 and currently aged 50 smoked on average 7.0, 15.9, 20.2, 23.2, and 39.0 cigarettes per day for the first through fifth quintiles respectively.
To partition the current smoker life table into five separate tables, one for each smoking quintile, define as the probability that a current smoker in the first quintile aged x, birth year BY, will die of causes other than lung cancer before age x+ 1, with similar definitions for the other quintiles. The aggregate current smoker relative risk was decomposed into the relative risks by quintile as shown in Equation (2.3):
| (2.3) |
While data from CPS-I, CPS-II, and the Nutrition Follow-Up study of CPS-II were utilized to develop estimates of by birth cohort, the data were too sparse to develop estimates of the relative risk ratios by quintile and by birth cohort. Instead we used the aggregate data from CPS-II, as reported in the Chapter 5 Appendices 26, 27, 28, and 30 of the Smoking and Tobacco Control Monograph No. 8 (12) to derive relative risks by cigarettes per day and age. Since these new relative risks are not birth cohort specific, Equation (2.4) shows that the relationship is only an approximation and not dependent on birth cohort.
| (2.4) |
To calibrate the quintile specific relative risks calculated in Equation (2.4) to the overall relative risk for smokers that is cohort specific, we multiplied by a correction factor kx,BY+x. Appendix A.3 summarizes the development of kx,BY+x and other details of the calibration process.
| (2.5) |
Thus the modified quintile, age, and birth cohort specific relative risks were , and .
Finally, Equation (2.2) was modified to reflect the quintiles as
| (2.6) |
Equation (2.6) was used to calculate the current smoker relative risk for each of quintile, with the same rationale for the right-hand side of Equation (2.6) as discussed in Section 2.2.2. The denominator is unchanged from Equation (2.2) due to the calibration of the relative risk ratios. As a final step, (Step 3(f) in Table II), we multiplied each of the 5 sets of relative risk ratios (one for each quintile) developed from the right-hand side of Equation (2.6) by , derived in Step 1(b), to derive five life tables for current smokers based on smoking quintile, age, and birth year ( ).
2.2.4. Former Smokers
Step 4 modified the aggregate former smoker life tables calculated in Step 2(c) to include covariates for the age when smoking stopped, the number of years since quit, and the average cigarettes smoked per day. The former smoker probabilities as defined in Section 2.2.2 were adjusted to reflect the age a person quit, the number of cigarettes smoked on average per day, the quit age, and the time since a person quit smoking.
A methodologically simple way of including these individual-level characteristics was with an excess risk model. Generalized Poisson models were developed in Step 4(a), using CPS-I data for current smokers and those who had never smoked, for white males that was applied to the difference between the mortality probability for current smokers reflecting their smoking quintile just prior to quitting, and the never smoker probability to allow for individual-level modeling of a former smokers mortality including their current age, average cigarettes per day (CPD) for that quintile, and time since quit. The excess risk equation began at 1 (same as current smoker mortality) and approached 0 (mortality for those who never smoked). The equation developed was:
| (2.7) |
where CPD = cigarettes per day is the value reported for their smoking behavior just prior to cessation, QuitAge = age in years when quit smoking and YearsQuit = number of years since quitting.(Burns et al. working paper) The final equation for the excess risk is:
| (2.8) |
This factor was applied to the difference between the current smoker mortality rate and the never smoker rate and then added to the never smoker rate in Step 4(b).
The current smoker and never smoker probabilities are specific to birth cohort. Thus these probabilities were inclusive of generational effects, such as advances in medicine and changes in smoking habits because of their development by age and birth year. Interpolating between the current and never smoker probabilities included these generational effects for former smoker mortality probabilities. An adjustment to reflect the intensity of smoking, the quit age, and the years since the person quit smoking was then applied to the difference to reflect specific former smoker information.
Because the data in CPS-I for females were more limited than for males, we assumed that the magnitude and timing of the change in fraction of excess risk remaining following cessation was the same for males and females even though the absolute death rates in smokers and never smokers were different for males and females.
3. RESULTS
The end result of this study is the creation of six non-lung cancer life tables for males and six tables for females: five current smoker quintiles and one for never smokers. Tables for former smokers are linear combinations of the appropriate table based on the current smoker quintile prior to quitting smoking and the never smoker probabilities, plus added covariates for the smoking quit age and time since quitting. Graphs to illustrate the cumulative mortality probabilities are accessible at Intervention and Surveillance Modeling Network (CISNET) Publication Resources (17) with an easy-to-use program to create life tables based on input specifications. Figures 3 to 5 in this paper provide examples of the results for both males and females.
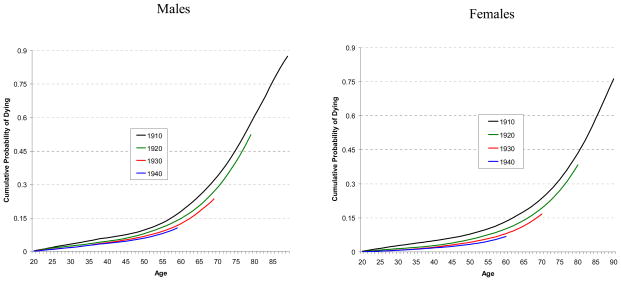
Figure 3.
Comparison of Cumulative Probability of Dying from Causes Other than Lung Cancer from Age 20 by Year of Birth for Never Smokers
Figure 5.
Comparison of Cumulative Probability of Dying from Causes Other than Lung Cancer from Age 20 for 1930 Birth Cohort (1) Never Smoker, (2) Current “Medium” Smoker (Third Quintile) who Starting Smoking at Age 15, and (3) Former Medium Smoker (Third Quintile) who Starting Smoking at Age 15 and Quit as a Medium Smoker at Age 40
Figure 3 shows the cumulative probabilities of death from causes other than lung cancer from aged 20 for never smokers, separately for males and females. The lines represent cohorts born in 1910, 1920, 1930, and 1940. The graphs show that later birth cohorts indicate a reduction of cumulative mortality for causes other than lung cancer. The younger birth cohorts had not reached age 90 by calendar year 2000, the termination year of for this study.
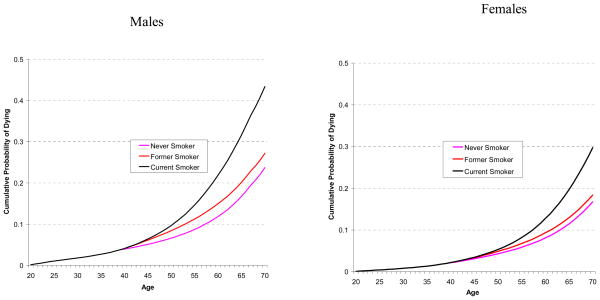
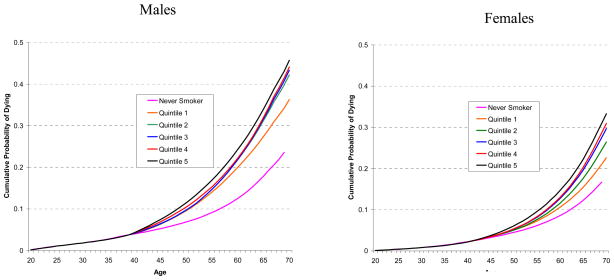
Similarly, Figure 4 shows the cumulative probabilities of death from causes other than lung cancer from aged 20 for current smokers who started smoking at age 15, by smoking quintile. The cumulative mortality for a never smoker is shown as a reference curve. The cumulative mortality probabilities for all curves are identical to age 40, due to the assumption (in Step 2a) that there is no difference in mortality prior to that age. The cumulative mortality curve for the highest quintile is higher than the other quintiles. For males, the middle three quintiles show little difference, while for females there is greater separation between the quintiles. Figure 4 reinforces the idea that smoking raises mortality for causes other than lung cancer.
Figure 4.
Comparison of Cumulative Probability of Dying from Causes Other than Lung Cancer from Age 20 by Smoking Quintile for 1930 Birth Cohort who Starting Smoking at Age 15
Figure 5 shows a comparison of the cumulative probability of death by smoking quintile for a person aged 20, born in 1930, (i) who never smoked, (ii) who started smoking at age 15 in the third quintile and never quit, and (iii) who started smoking at age 15 in the third quintile and quit at age 40. As expected, the current smoker curve is above the former smoker curve, which is above the never smoker curve. What is also apparent from the graph is that at the quit age of 40 years, the former smoker curve is coincident with the current smoker curve, but approaches the curve for the never smoker over time.
4. DISCUSSION
This study used a non-parametric approach and data from multiple sources to create mortality tables removing lung cancer mortality, by birth cohort. The results reflected the residual impact of smoking on mortality from causes other than lung cancer. While the methods used in this study were intricate, the results are easily shown in a life table format. These tables account for both the generational effects of changing patterns of smoking and changing practice of medicine.
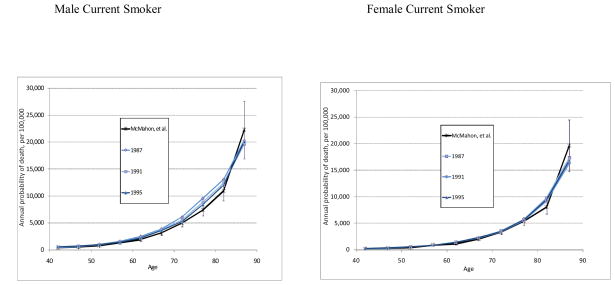
The current, former, and never probabilities of non-lung cancer death were compared against an analysis by McMahon et al.(18) who computed marginal posterior densities of annual probabilities of death, stratified by 5-year age interval, race (white and black), sex, and smoking status (current, former, and never) over calendar years 1987 to 1995. Their Bayesian approach synthesized NHIS demographics, cause of death, time until death, smoking information, and survey weights together with national vital statistics data and results from CPS-II to fit cause-specific hazard models for three causes of death (lung cancer, heart disease, and all other causes), controlling for age, sex, race, and smoking status. Their results for white males and females, for current smokers in aggregate and never smokers, compare favorably to our estimates for the same calendar years. Figure 6 shows a comparison between our results, converted to calendar year for 1987 to 1995. The solid black line for McMahon et al. represents their estimates, along with 95% confidence intervals.
Figure 6.
Comparison of Estimated Probabilties for 3 Calendar Years vs. McMahon, et al.
We made three additional assumptions to create the life tables: (a) the impact of smoking on lung cancer mortality was not seen until age 40 and higher; (b) smoking risk ratios were assumed to be constant for birth cohorts prior to years 1900 – 1909 as birth year 1910 is the earliest birth cohort with observed relative risk ratios by smoking status; and (c) smoking risk ratios were assumed to be constant above age 90. Assumption (a) will not influence the results very much because lung cancer is relatively rare prior to age 40. For assumptions (b) and (c), these early birth cohort only have a minor influence on the overall rates during the calendar years and ages of interest utilized for this monograph (1975–2000, age 30–84).
These methods can be easily adapted to other studies that require competing cause mortality. Any study interested in measuring the impact of new treatments or interventions aimed at reducing lung cancer mortality would need to include the impact of smoking on other cause mortality. The CISNET(19) is one such project whose objective was to use simulation modeling techniques to measure the impact of cancer control interventions on population trends in incidence and mortality. This project yielded life tables that can be easily incorporated into other studies measuring comparative effectiveness of an intervention.
Acknowledgments
Partially supported by NCI contract numbers 263-MQ-319824 and 263-MQ-416726-1, by grant 1UL1RR025011 from the Clinical and Translational Science Award (CTSA) program of the National Center for Research Resources, National Institutes of Health, and by the Intramural Research Program of the National Institute on Aging. We acknowledge Jerry Vaughn of University of California San Diego for his contribution on this paper.
APPENDIX: SMOOTHING AND CALIBRATING THE RELATIVE RISK MORTALITY RATIOS OF CURRENT SMOKERS AND FORMER SMOKERS TO NEVER SMOKERS
A.1. Relative risks of current and former smokers to never smokers
The other cause mortality relative risk ratios of current smokers and former smokers to never smokers were smoothed by a LOESS smoother (locally weighted polynomial regression) by calendar year and age for the study period. (20) The inverse of the variances of the relative risks were used as weights in the smoothing. The amount of smoothness of the fitted curve is controlled by a ‘span’ parameter, which is the proportion of data points in the neighborhood of the point to be adjusted. A larger span value implies a smoother curve. These relative risks were then converted to a birth year basis and applied to the mortality rates.
To smooth the relative risks of current smokers to never smokers we let be the other cause mortality relative risk ratio of current smokers to never smokers at age (x) and calendar year, where the calendar year is the sum of age (x) and birth year (BY), CY = x + BY. A general bivariate LOESS smoother f(x, BY + x) with a default span parameter of 0.67 was fitted. In addition, an additive model (21), a sum of two univariate smoothers g(x) h(BY + x), was also fitted. In the additive model, the optimal span was determined by comparing the residual sum of squares over a possible range of spans 0.4 to 0.8.
A chi-square test was used to determine whether the interaction between age and calendar year was significant. If the interaction was not significant, then the additive model was selected as the final model. There was no significant interaction between age and calendar year (p = 0.16) for the relative risk of current smokers to never smokers for males. Thus an additive model without interaction between age and calendar year was used, where the span parameters were 0.6 for both the age smoother and the calendar year smoother. The interaction between age and calendar year was highly significant (p < 0.01) for the relative risk of current smokers to never smokers for females. In this case, a bivariate smoother with interaction was included, with the default span parameter of 0.67.
For former smokers, smoking histories were combined and were used to smooth the relative risks between former smokers to current smokers. The p-values of testing the interaction for former smokers to never smokers for males was 0.12 and for females was 0.10, both not significant, so an additive smoother was used. The span parameters for males were 0.6 for the age smoother and 0.5 or the calendar year smoother respectively. The span parameters for females were 0.4 for the age smoother and a simple linear relationship was used for the calendar year part because of the sparsity of data.
A.2. Relative risks of current smokers to never smokers by smoking intensity (number of cigarettes)
For the current smokers, we also conducted a more detailed analysis and created a smoothed estimate of the relative risk of current smokers to never smokers by number of cigarettes per day. Figure A.2.1 shows the graphs of the relative risks by age and number of cigarettes per day for white males and females. The person years at risk for never smokers and current smokers by age and number of cigarettes for current smokers were derived for both males and females from the Chapter 5 Appendices 26 and 27 of the Smoking and Tobacco Control Monograph No. 8 (12). The Chapter 5 Appendices 28 and 30 of Monograph No. 8 were used to obtain the number of deaths from all causes by age and from lung cancer by age for both never smokers and smokers, as well as the number of deaths by the number of cigarettes smoked. We assumed that the average number of cigarettes for quintile 1 to quintile 5 is 3, 12, 20, 32 and 40 per day respectively.
Figure A.2.1.
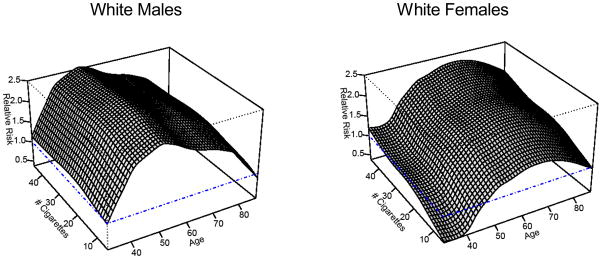
Relative Risks by Age and # Cigarettes per Day for White Males and White Females
The other-cause mortality rates were calculated by dividing the number of deaths by the person-years at risk. The relative risk of current smokers by the number of cigarettes was calculated as the ratio of mortality other than lung cancer for current smokers by number of cigarettes to the mortality other than lung cancer for never smokers. Then the relative risks of current smokers by number of cigarettes were smoothed using the methods described in Section A.1. The p-value to test the interaction term was less than 0.01 for males and 0.10 for females. Thus we used a bivariate LOESS smoother for males and the sum of two univariate smoothers for females. The default span parameter of 0.67 was used for males. The span parameters for females were 0.4 for the age smoother and 0.8 for the number of cigarettes, respectively.
A.3. Calibrating the relative risks of current smokers and never smokers
To calibrate the quintile specific relative risks calculated in Equation (2.4) to the overall relative risk for smokers that is cohort specific, we multiplied by a correction factor kx,BY+x, where age is designated as x and the calendar year by BY+ x. Figure A.3.1 shows the calibration factors of males and females by age and calendar year. Because the calibration is a ratio of smoothed quantities (see Sections A.1 and A.2), the fitted values of kx,BY+x are smoothed as well.
Figure A.3.1.
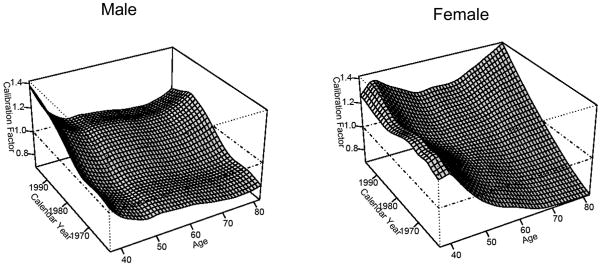
Calibration Factors for Males and Females
After the calibration, the ratio of the quintile-specific other-cause mortality for current smokers to aggregate other-cause mortality was calculated as equation (2.6).
References
- 1.U.S. Department of Health and Human Services. The Health Consequences of Smoking: A Report of the Surgeon General. Atlanta, GA: U.S. Department of Health and Human Services, Centers for Disease Control and Prevention, National Center for Chronic Disease Prevention and Health Promotion, Office on Smoking and Health; 2004. [Google Scholar]
- 2.U.S. Department of Health and Human Services. The Health Consequences of Involuntary Exposure to Tobacco Smoke: A Report of the Surgeon General. Atlanta, GA: U.S. Department of Health and Human Services, Centers for Disease Control and Prevention, Coordinating Center for Health Promotion, National Center for Chronic Disease Prevention and Health Promotion, Office on Smoking and Health; 2006. [Google Scholar]
- 3.Doll R, Peto R, Boreham J, Sutherland I. Mortality from cancer in relation to smoking: 50 years observations on British doctors. Br J Cancer. 2005;92(3):426–9. doi: 10.1038/sj.bjc.6602359. [DOI] [PMC free article] [PubMed] [Google Scholar]
- 4.Behan D, Eriksen M, Lin Y. [Accessed on June 18, 2011];Economic Effects of Environmental Tobacco Smoke. 2005 Available at: http://www.soa.org/research/research-projects/life-insurance/research-economic-effect.aspx.
- 5.Peto R, Lopez AD, Boreham J, Thun M, Heath C, Jr, Doll R. Mortality from smoking worldwide. Br Med Bull. 1996;52(1):12–21. doi: 10.1093/oxfordjournals.bmb.a011519. [DOI] [PubMed] [Google Scholar]
- 6.Murray CJ, Lopez AD. On the comparable quantification of health risks: lessons from the Global Burden of Disease Study. Epidemiology. 1999;10(5):594–605. [PubMed] [Google Scholar]
- 7.Rosenberg MA. Competing Risks. Journal of the National Cancer Institute Monograph. 2006;36:15–19. doi: 10.1093/jncimonographs/lgj004. [DOI] [PubMed] [Google Scholar]
- 8. [Accessed on June 18, 2011];Berkeley Mortality Database. Available at: http://www.demog.berkeley.edu/~bmd/states.html.
- 9.Office of the Actuary. Life Tables for the United States Social Security Area 1900–2080. US Department of Health and Human Services; Aug, 1992. SSA Pub No. 11–11536. [Google Scholar]
- 10.National Center for Health Statistics. [Accessed on June 18, 2011]; Available at: http://www.cdc.gov/nchs/
- 11.National Health Interview Survey. [Accessed on June 18, 2011]; Available at: http://www.cdc.gov/nchs/nhis.htm.
- 12.Burns D, Garfinkel L, Samet J. [Accessed on June 18, 2011];Smoking and Tobacco Control Monograph. 1996 (8) Available at: http://cancercontrol.cancer.gov/tcrb/monographs/8/index.html.
- 13.Burns D, Lee L, Shen Z, Gilpin B, Tolley D, Vaughn J, Shanks T. Cigarette smoking behavior in the United States. In: Burns D, Garfinkel L, Samet J, editors. Changes in cigarette-related disease risks and their implication for prevention and control Monograph. 8. USDHHS NIH NCI; 1998. pp. 13–112. [Google Scholar]
- 14.Cancer Prevention Study Overview. [Accessed on June 18, 2011]; Available at: http://www.cancer.org/Research/ResearchProgramsFunding/cancer-prevention-study-overviews.
- 15.Bowers NL, Gerber H, Hickman JC, Jones DA, Nesbitt CJ. Actuarial Mathematics. 2. Schaumburg, IL: Society of Actuaries; 1997. [Google Scholar]
- 16.Burns D, Anderson C, et al. Risk Analysis. 2011. Chapter 2: Smoking Histories of the US Population, Birth Cohorts 1900–1970. [Google Scholar]
- 17.Cancer Intervention and Surveillance Modeling Network Publication Resources. [Accessed on June 18, 2011]; Available at: http://cisnet.cancer.gov/resources/cohort_lifeID_B4Z.html.
- 18.McMahon P, Zaslavsky A, Weinstein M, Kuntz K, Weeks J, Gazelle G. Estimation of Mortality Rates for Disease Simulation Models Using Bayesian Evidence Synthesis. Medical Decision Making. 2006;26:497–511. doi: 10.1177/0272989X06291326. [DOI] [PubMed] [Google Scholar]
- 19. [Accessed June 18, 2011];Cancer Intervention and Surveillance Modeling Network About CISNET. Available at: http://cisnet.cancer.gov/about/
- 20.Cleveland WS. Robust Locally Weighted Regression and Smoothing Scatterplots. Journal of the American Statistical Association. 1979;74:829–836. [Google Scholar]
- 21.Hastie TJ, Tibshirani RJ. Generalized Additive Models. New York: Chapman and Hall; 1990. [Google Scholar]


